A high level presentation about how we're working with data at Kickstarter. Includes details on our events stack, some ETL, Redshift queries, and our process of handling and processing data requests internally.
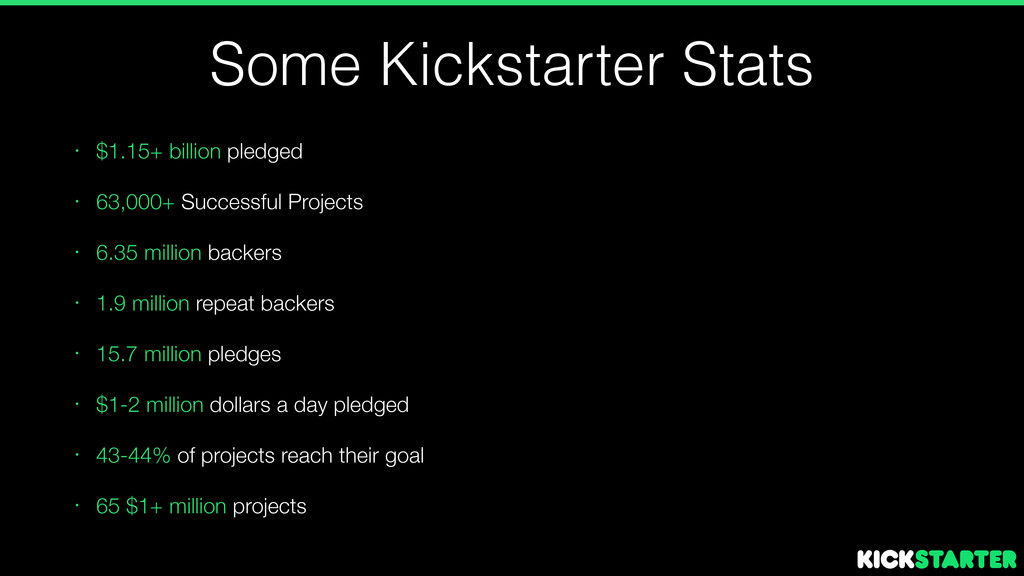
Projects • 6.35 million backers • 1.9 million repeat backers • 15.7 million pledges • $1-2 million dollars a day pledged • 43-44% of projects reach their goal • 65 $1+ million projects
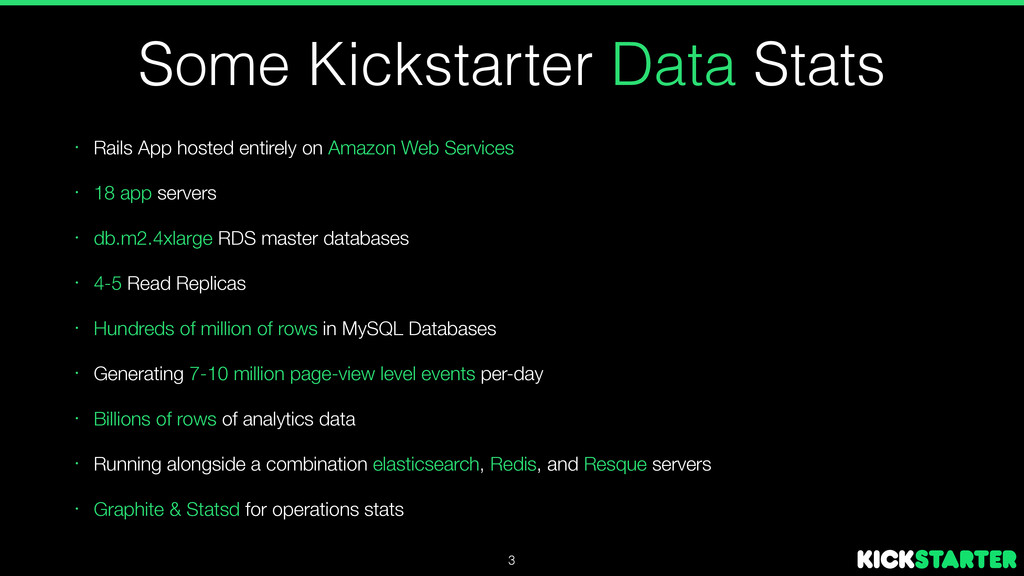
Amazon Web Services • 18 app servers • db.m2.4xlarge RDS master databases • 4-5 Read Replicas • Hundreds of million of rows in MySQL Databases • Generating 7-10 million page-view level events per-day • Billions of rows of analytics data • Running alongside a combination elasticsearch, Redis, and Resque servers • Graphite & Statsd for operations stats 3
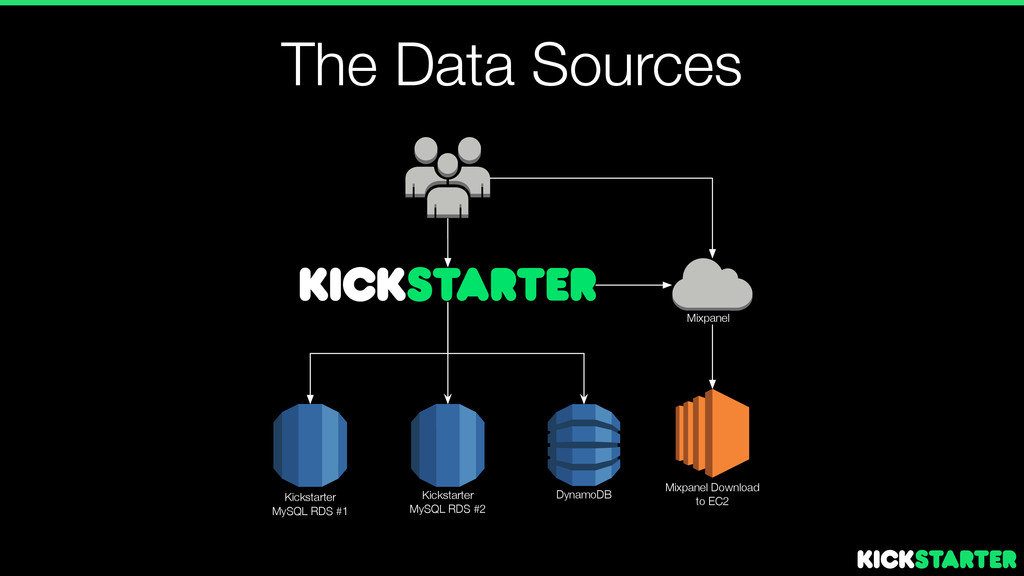
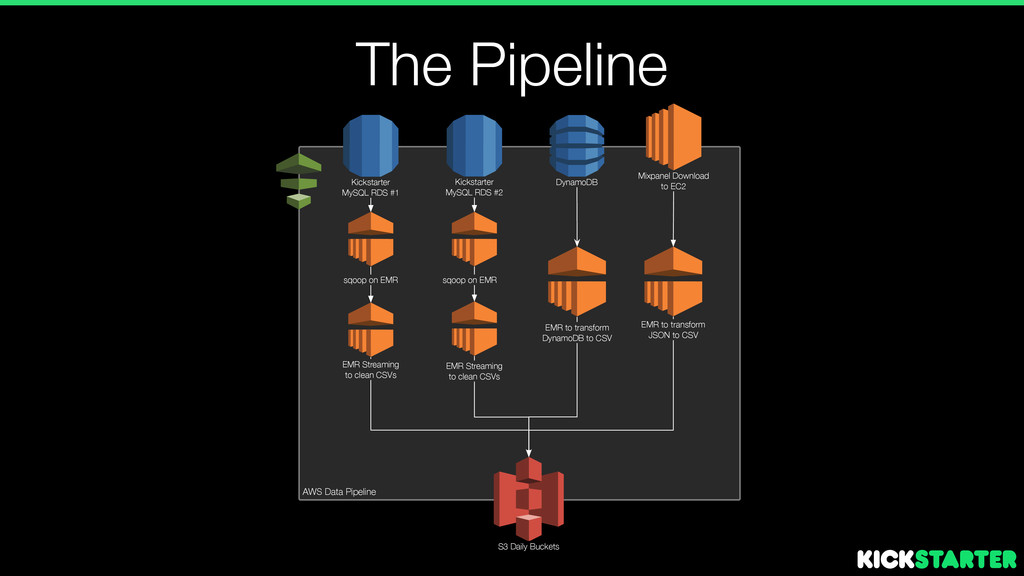
S3 Daily Buckets sqoop on EMR Mixpanel Download to EC2 EMR Streaming to clean CSVs EMR to transform JSON to CSV EMR Streaming to clean CSVs sqoop on EMR AWS Data Pipeline DynamoDB EMR to transform DynamoDB to CSV
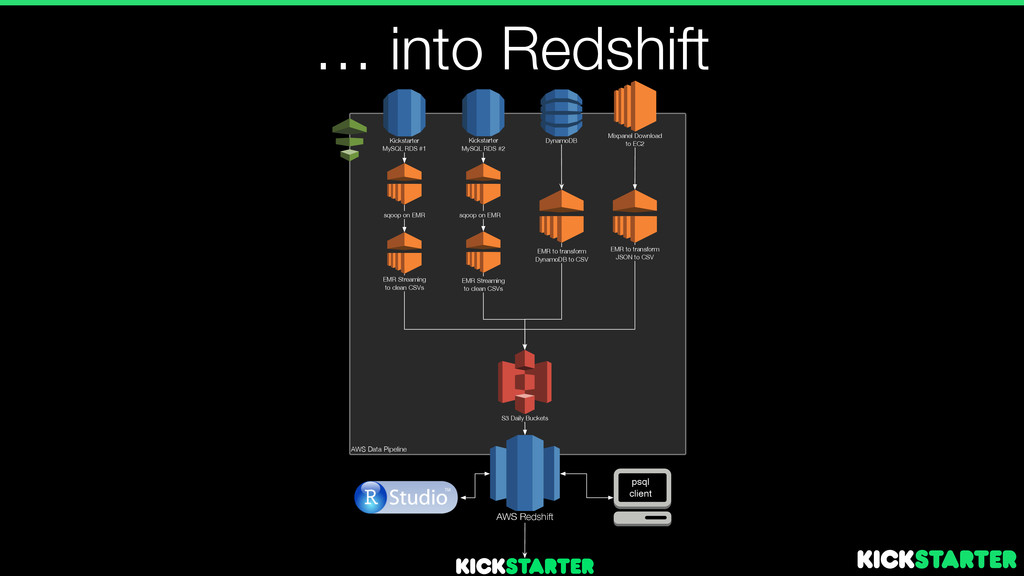
#2 S3 Daily Buckets sqoop on EMR Mixpanel Download to EC2 EMR Streaming to clean CSVs psql client AWS Redshift EMR to transform JSON to CSV EMR Streaming to clean CSVs sqoop on EMR AWS Data Pipeline DynamoDB EMR to transform DynamoDB to CSV
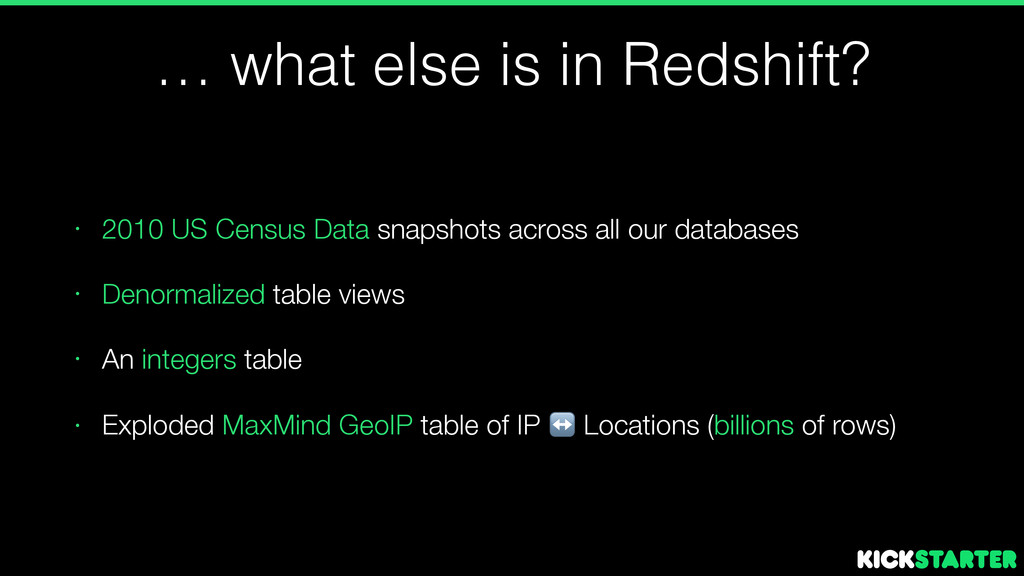
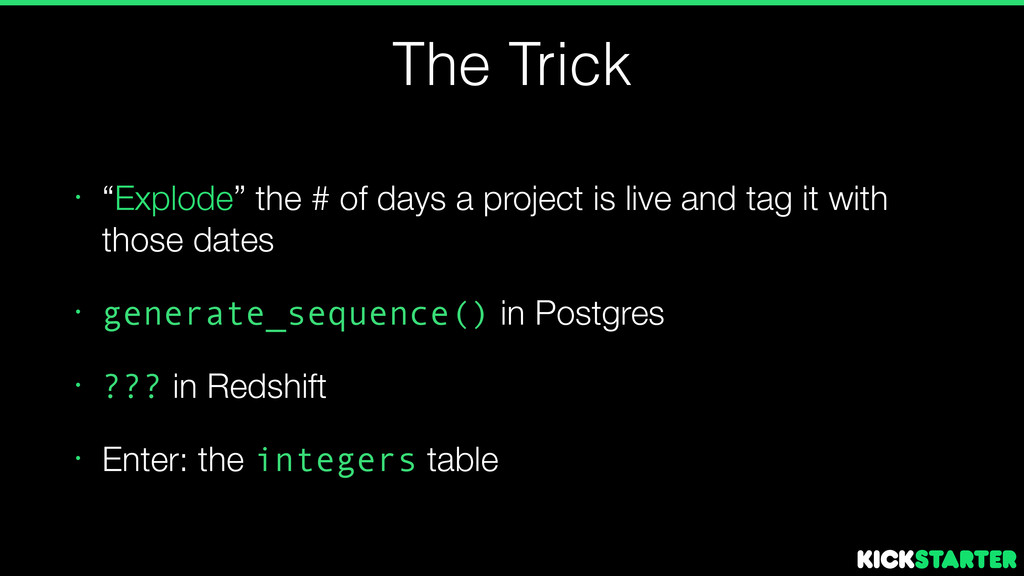
Data snapshots across all our databases • Denormalized table views • An integers table • Exploded MaxMind GeoIP table of IP ↔️ Locations (billions of rows)
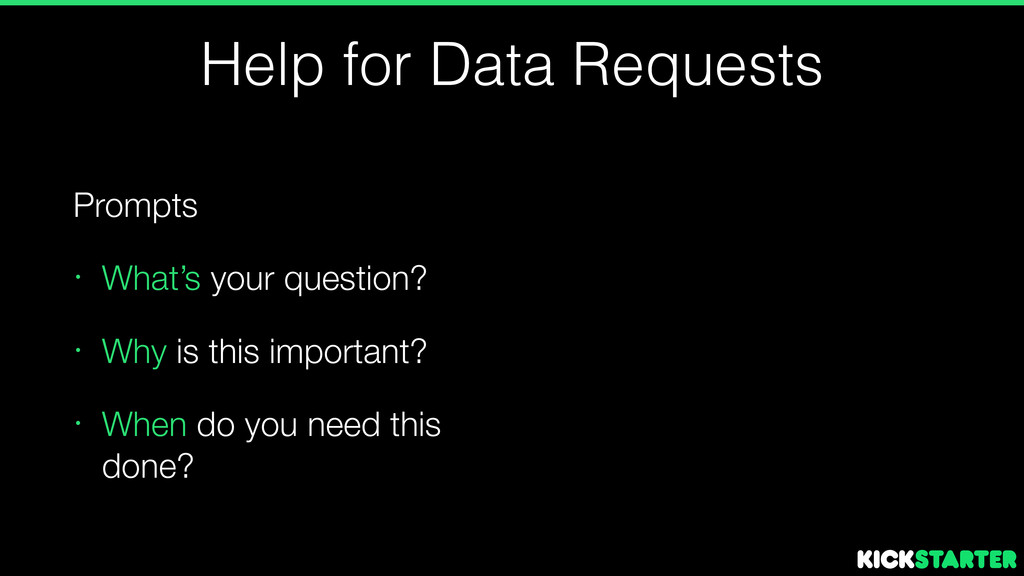
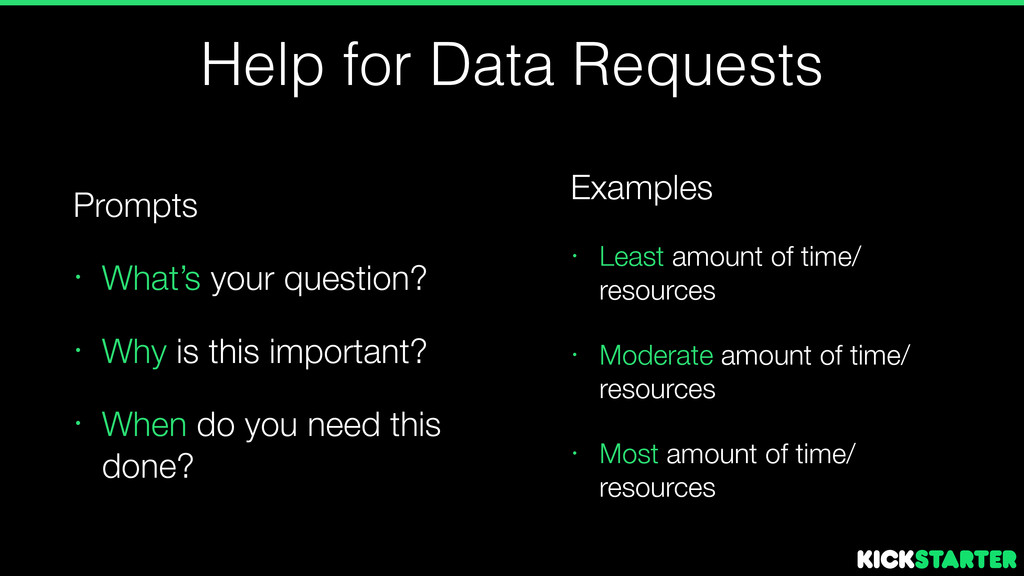
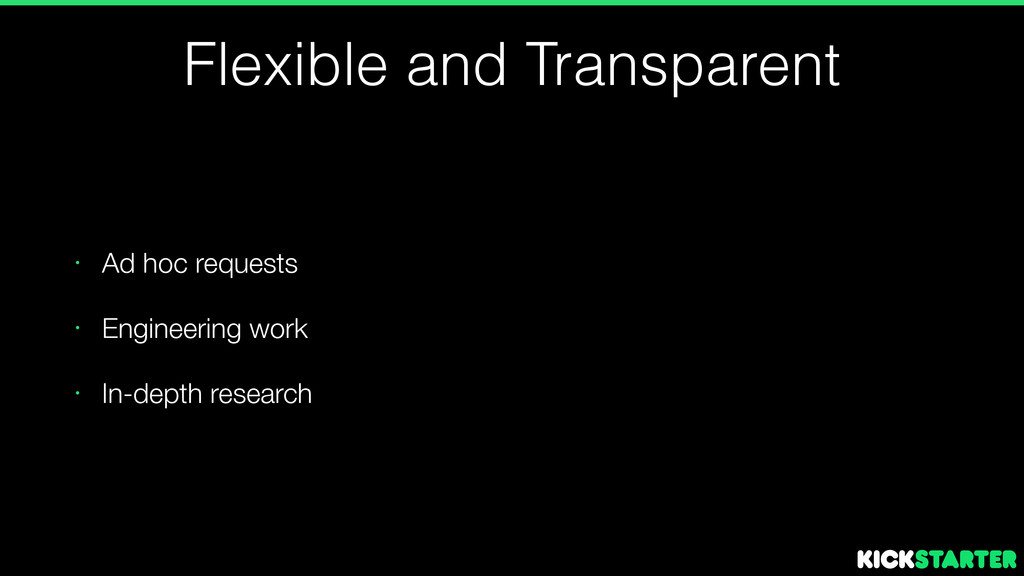
Why is this important? • When do you need this done? Examples • Least amount of time/ resources • Moderate amount of time/ resources • Most amount of time/ resources
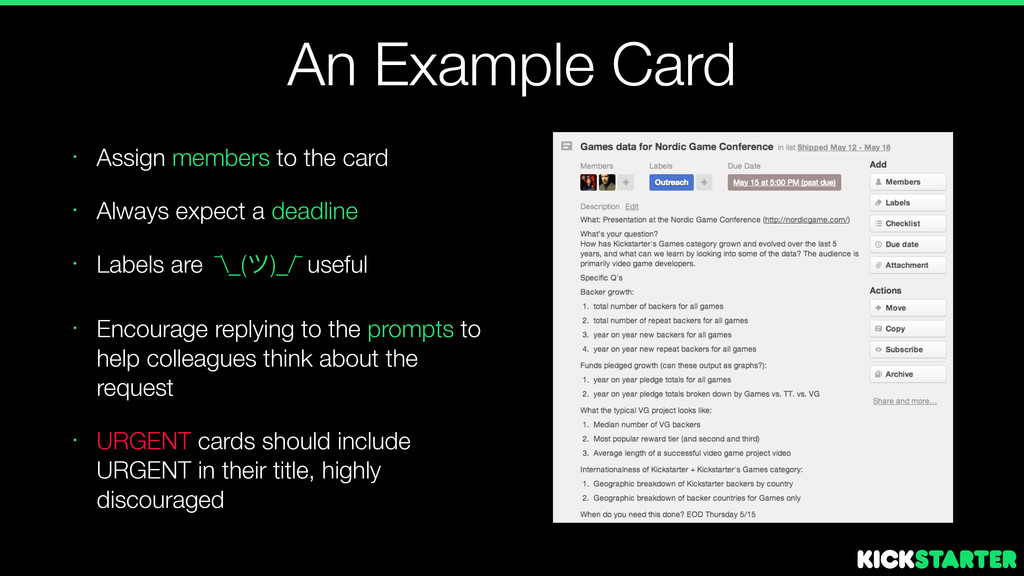
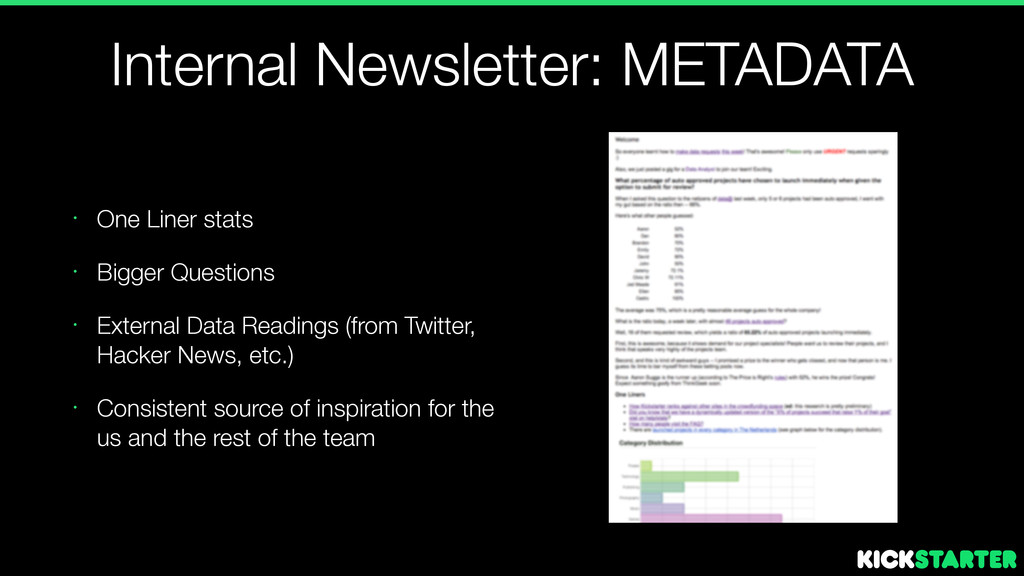
Always expect a deadline • Labels are ¯\_(π)_/¯ useful • Encourage replying to the prompts to help colleagues think about the request • URGENT cards should include URGENT in their title, highly discouraged
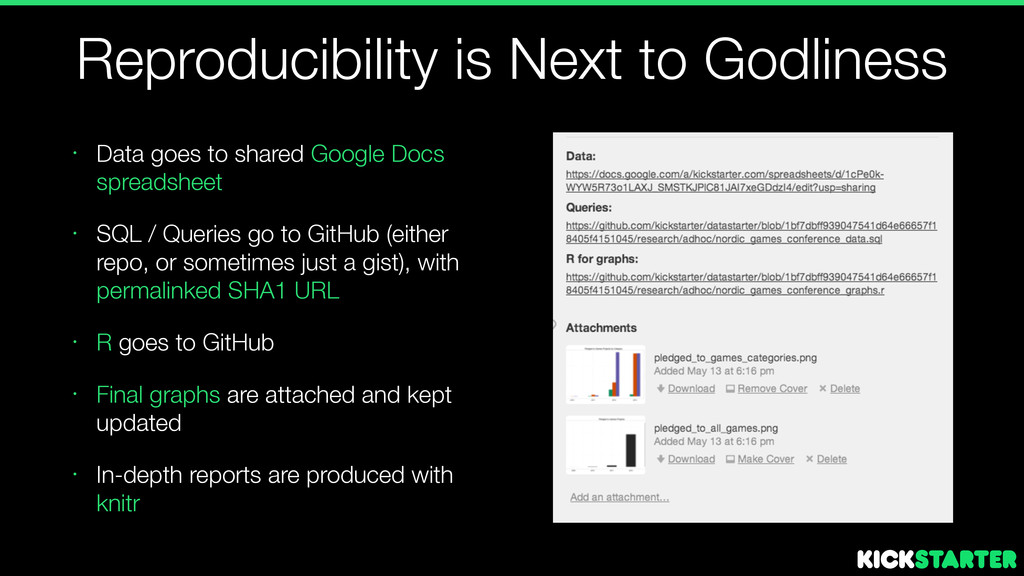
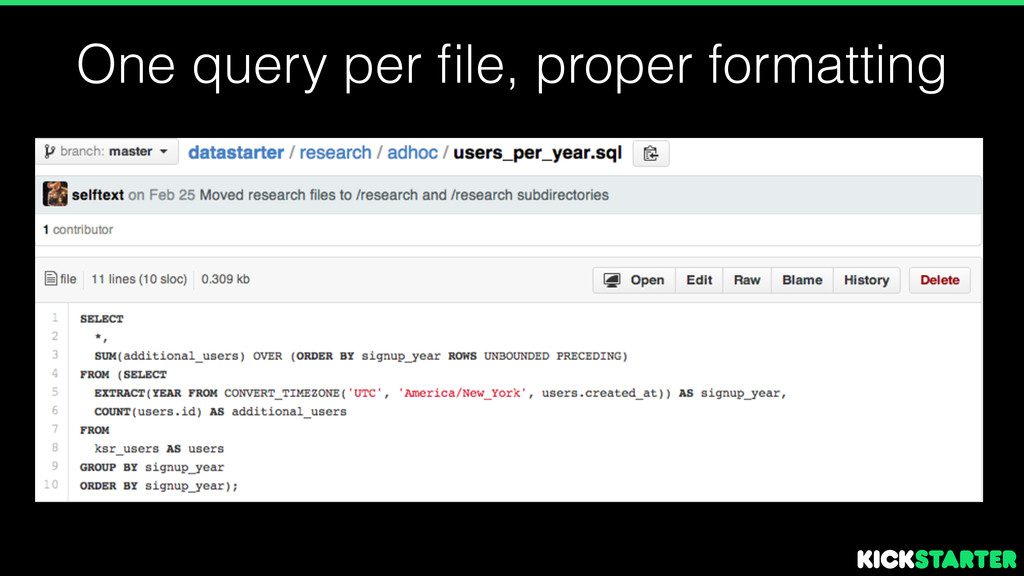
/ Queries go to GitHub (either repo, or sometimes just a gist), with permalinked SHA1 URL • R goes to GitHub • Final graphs are attached and kept updated • In-depth reports are produced with knitr Reproducibility is Next to Godliness
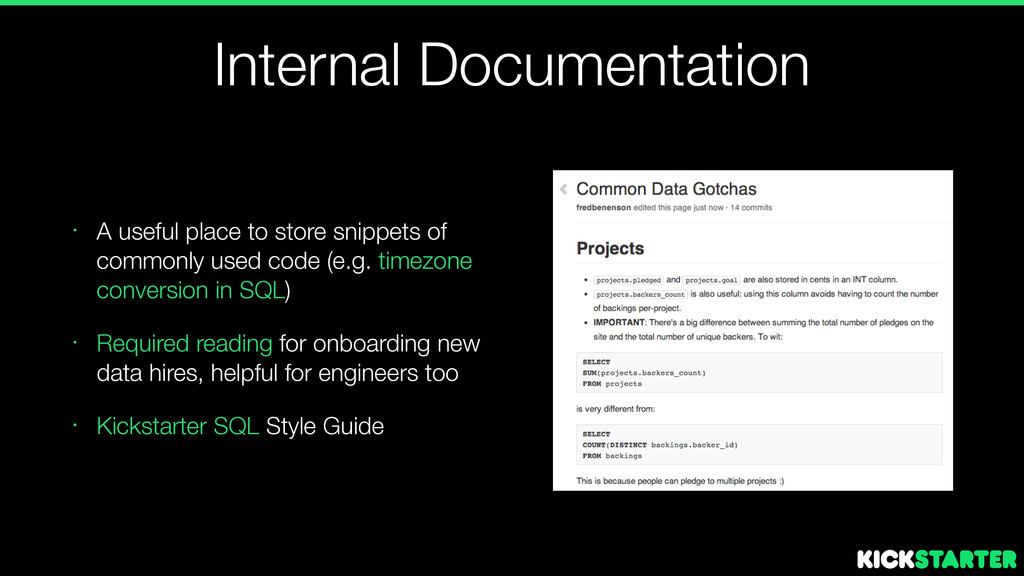
commonly used code (e.g. timezone conversion in SQL) • Required reading for onboarding new data hires, helpful for engineers too • Kickstarter SQL Style Guide
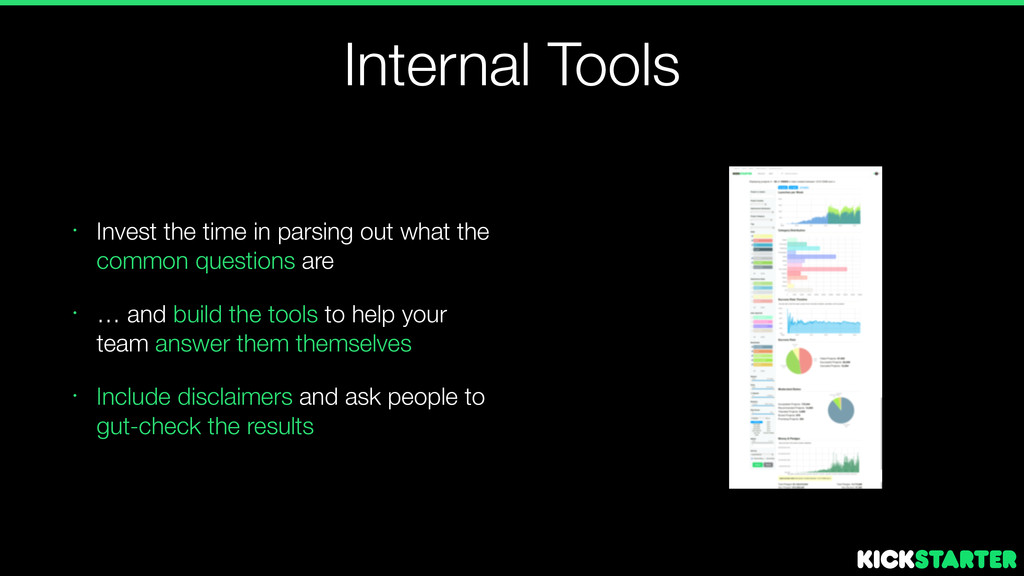
the common questions are • … and build the tools to help your team answer them themselves • Include disclaimers and ask people to gut-check the results
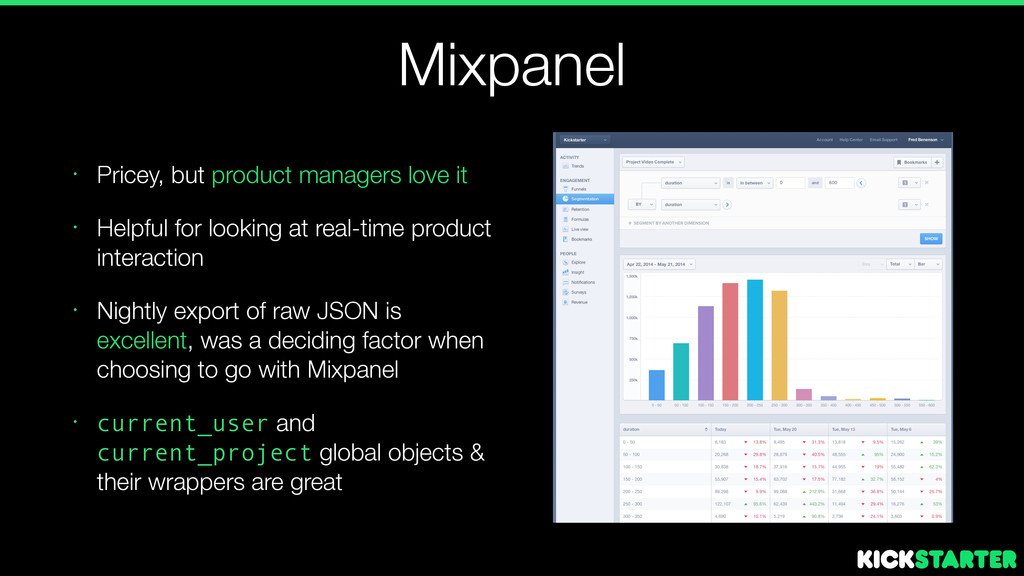
for looking at real-time product interaction • Nightly export of raw JSON is excellent, was a deciding factor when choosing to go with Mixpanel • current_user and current_project global objects & their wrappers are great
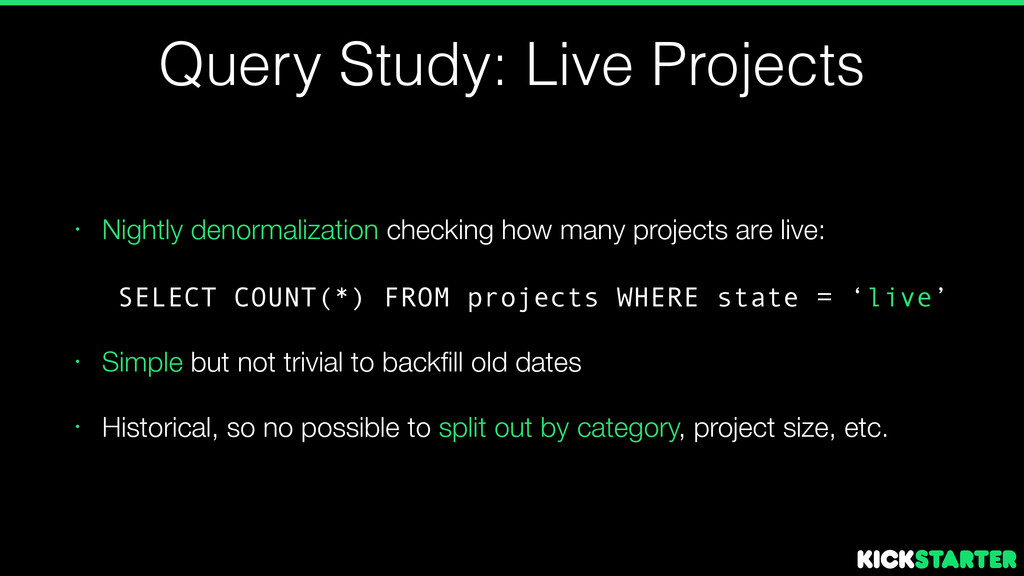
projects are live: SELECT COUNT(*) FROM projects WHERE state = ‘live’ • Simple but not trivial to backfill old dates • Historical, so no possible to split out by category, project size, etc.
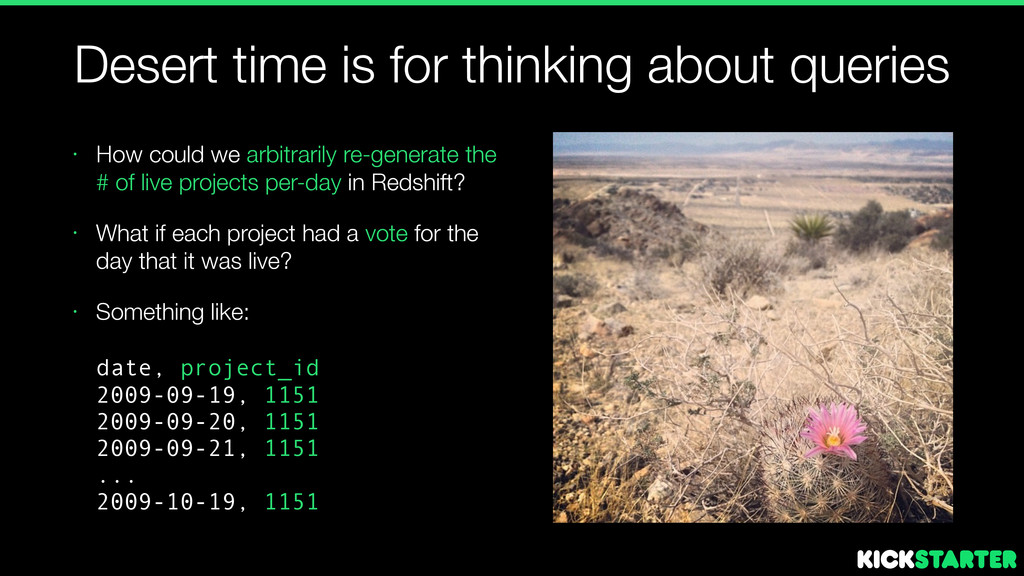
we arbitrarily re-generate the # of live projects per-day in Redshift? • What if each project had a vote for the day that it was live? • Something like: date, project_id 2009-09-19, 1151 2009-09-20, 1151 2009-09-21, 1151 ... 2009-10-19, 1151
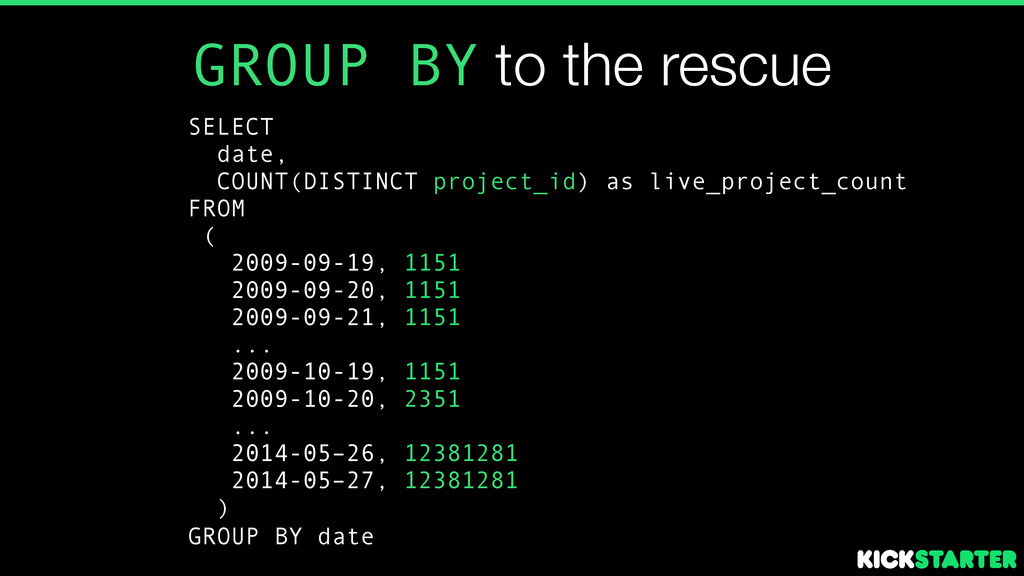
as live_project_count FROM ( 2009-09-19, 1151 2009-09-20, 1151 2009-09-21, 1151 ... 2009-10-19, 1151 2009-10-20, 2351 ... 2014-05–26, 12381281 2014-05–27, 12381281 ) GROUP BY date
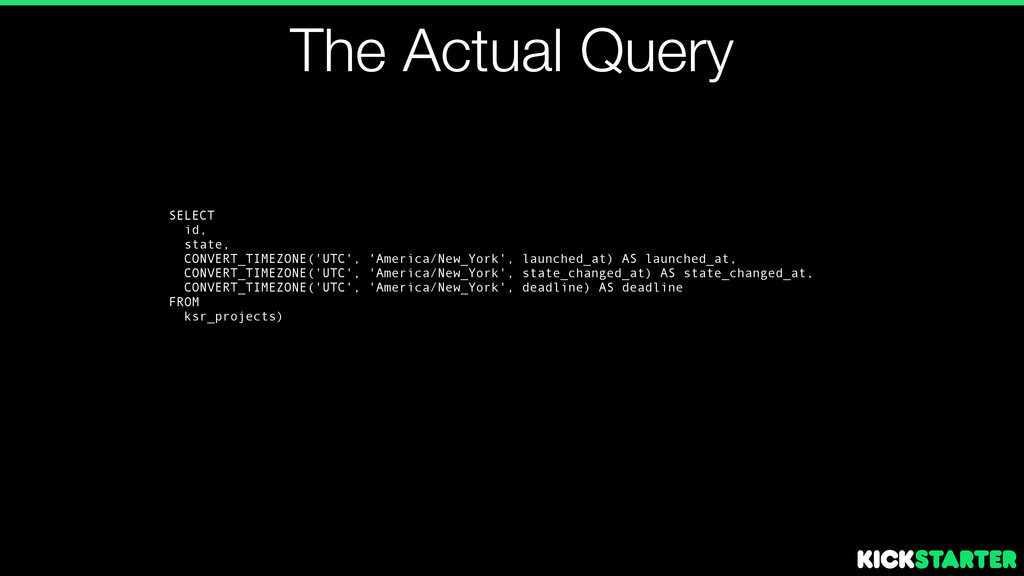
launched_at, CONVERT_TIMEZONE('UTC', 'America/New_York', state_changed_at) AS state_changed_at, CONVERT_TIMEZONE('UTC', 'America/New_York', deadline) AS deadline FROM ksr_projects)
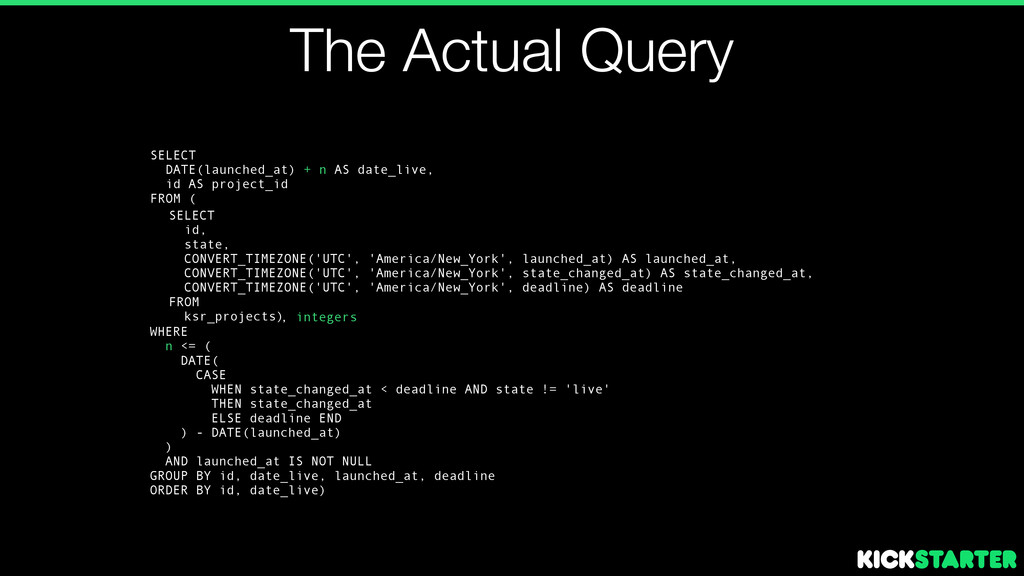
launched_at, CONVERT_TIMEZONE('UTC', 'America/New_York', state_changed_at) AS state_changed_at, CONVERT_TIMEZONE('UTC', 'America/New_York', deadline) AS deadline FROM ksr_projects) SELECT DATE(launched_at) + n AS date_live, id AS project_id FROM ( ! WHERE n <= ( DATE( CASE WHEN state_changed_at < deadline AND state != 'live' THEN state_changed_at ELSE deadline END ) - DATE(launched_at) ) AND launched_at IS NOT NULL GROUP BY id, date_live, launched_at, deadline ORDER BY id, date_live) , integers
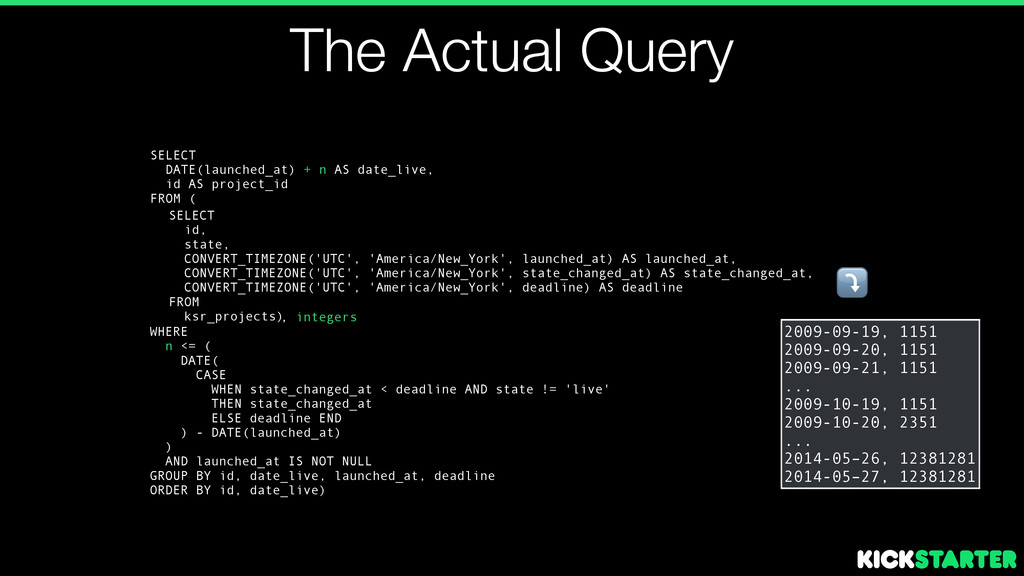
launched_at, CONVERT_TIMEZONE('UTC', 'America/New_York', state_changed_at) AS state_changed_at, CONVERT_TIMEZONE('UTC', 'America/New_York', deadline) AS deadline FROM ksr_projects) SELECT DATE(launched_at) + n AS date_live, id AS project_id FROM ( ! WHERE n <= ( DATE( CASE WHEN state_changed_at < deadline AND state != 'live' THEN state_changed_at ELSE deadline END ) - DATE(launched_at) ) AND launched_at IS NOT NULL GROUP BY id, date_live, launched_at, deadline ORDER BY id, date_live) , integers 2009-09-19, 1151 2009-09-20, 1151 2009-09-21, 1151 ... 2009-10-19, 1151 2009-10-20, 2351 ... 2014-05–26, 12381281 2014-05–27, 12381281 ⤵️
launched_at, CONVERT_TIMEZONE('UTC', 'America/New_York', state_changed_at) AS state_changed_at, CONVERT_TIMEZONE('UTC', 'America/New_York', deadline) AS deadline FROM ksr_projects) SELECT DATE(launched_at) + n AS date_live, id AS project_id FROM ( ! WHERE n <= ( DATE( CASE WHEN state_changed_at < deadline AND state != 'live' THEN state_changed_at ELSE deadline END ) - DATE(launched_at) ) AND launched_at IS NOT NULL GROUP BY id, date_live, launched_at, deadline ORDER BY id, date_live) , integers SELECT date_live, COUNT(DISTINCT project_id) AS live_projects FROM ( GROUP BY date_live; 2009-09-19, 1151 2009-09-20, 1151 2009-09-21, 1151 ... 2009-10-19, 1151 2009-10-20, 2351 ... 2014-05–26, 12381281 2014-05–27, 12381281 ⤵️
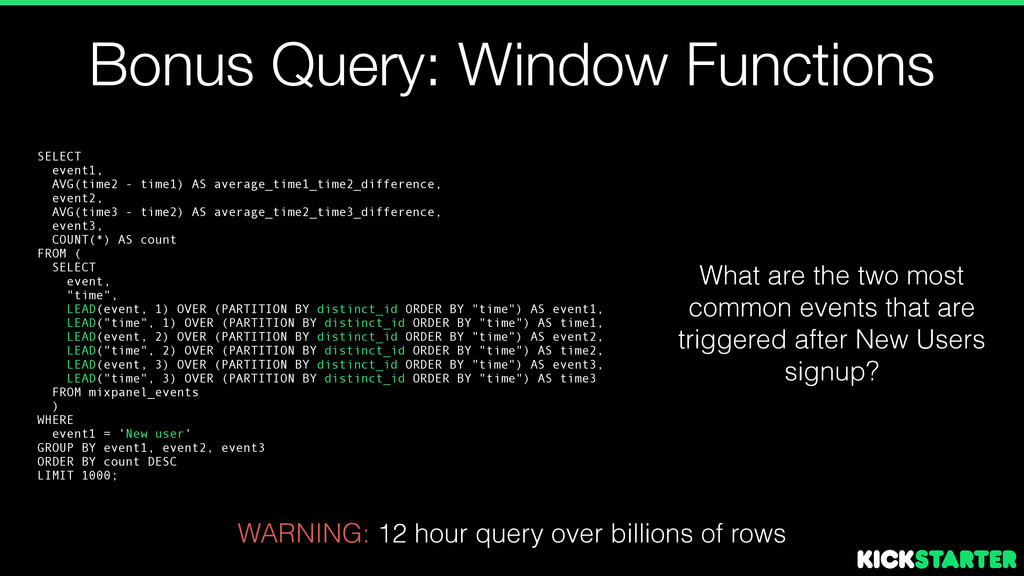
average_time1_time2_difference, event2, AVG(time3 - time2) AS average_time2_time3_difference, event3, COUNT(*) AS count FROM ( SELECT event, "time", LEAD(event, 1) OVER (PARTITION BY distinct_id ORDER BY "time") AS event1, LEAD("time", 1) OVER (PARTITION BY distinct_id ORDER BY "time") AS time1, LEAD(event, 2) OVER (PARTITION BY distinct_id ORDER BY "time") AS event2, LEAD("time", 2) OVER (PARTITION BY distinct_id ORDER BY "time") AS time2, LEAD(event, 3) OVER (PARTITION BY distinct_id ORDER BY "time") AS event3, LEAD("time", 3) OVER (PARTITION BY distinct_id ORDER BY "time") AS time3 FROM mixpanel_events ) WHERE event1 = 'New user' GROUP BY event1, event2, event3 ORDER BY count DESC LIMIT 1000; WARNING: 12 hour query over billions of rows What are the two most common events that are triggered after New Users signup?
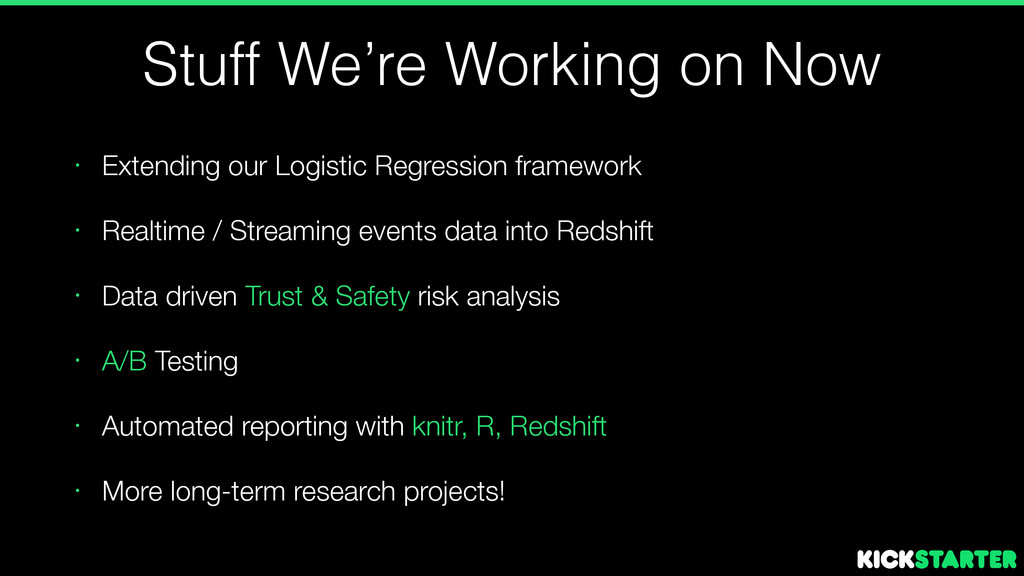
events data into Redshift • Data driven Trust & Safety risk analysis • A/B Testing • Automated reporting with knitr, R, Redshift • More long-term research projects! Stuff We’re Working on Now
![Data @ Kickstarter: A Guided Tour [email protected] / [email protected] @fredbenenson](https://files.speakerdeck.com/presentations/8f4ec0e0cfec0131b2c37a72b021c15e/slide_0.jpg)