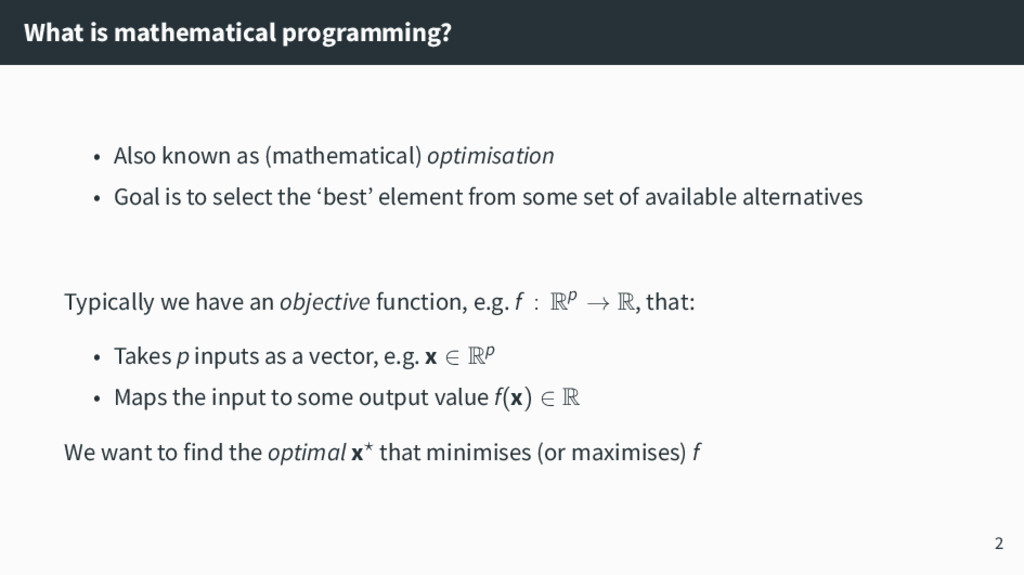
• Goal is to select the ‘best’ element from some set of available alternatives Typically we have an objective function, e.g. f : Rp → R, that: • Takes p inputs as a vector, e.g. x ∈ Rp • Maps the input to some output value f(x) ∈ R We want to find the optimal x⋆ that minimises (or maximises) f 2
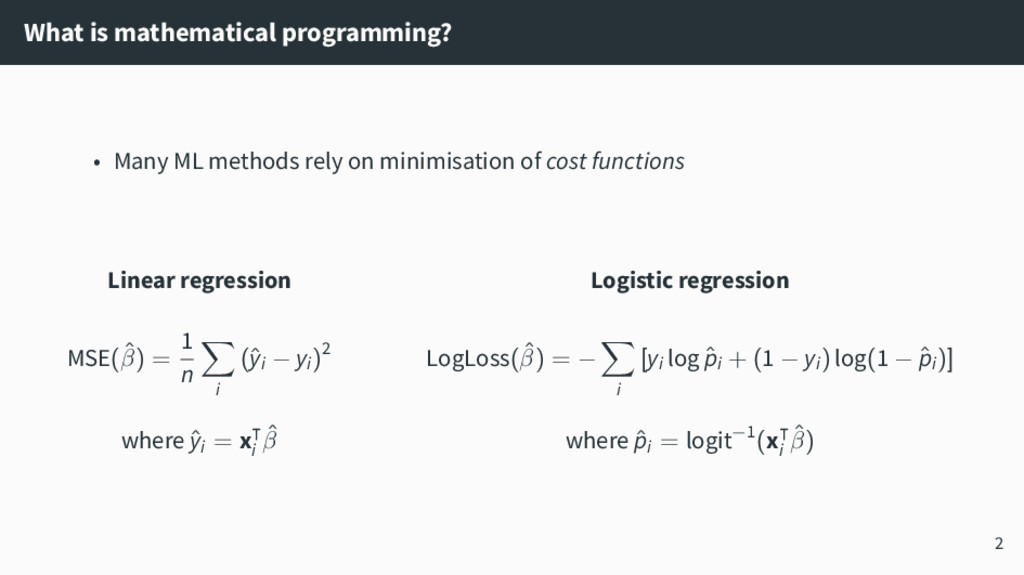
minimisation of cost functions Linear regression MSE(ˆ β) = 1 n ∑ i (ˆ yi − yi)2 where ˆ yi = x⊺ i ˆ β Logistic regression LogLoss(ˆ β) = − ∑ i [yi log ˆ pi + (1 − yi) log(1 − ˆ pi)] where ˆ pi = logit−1(x⊺ i ˆ β) 2
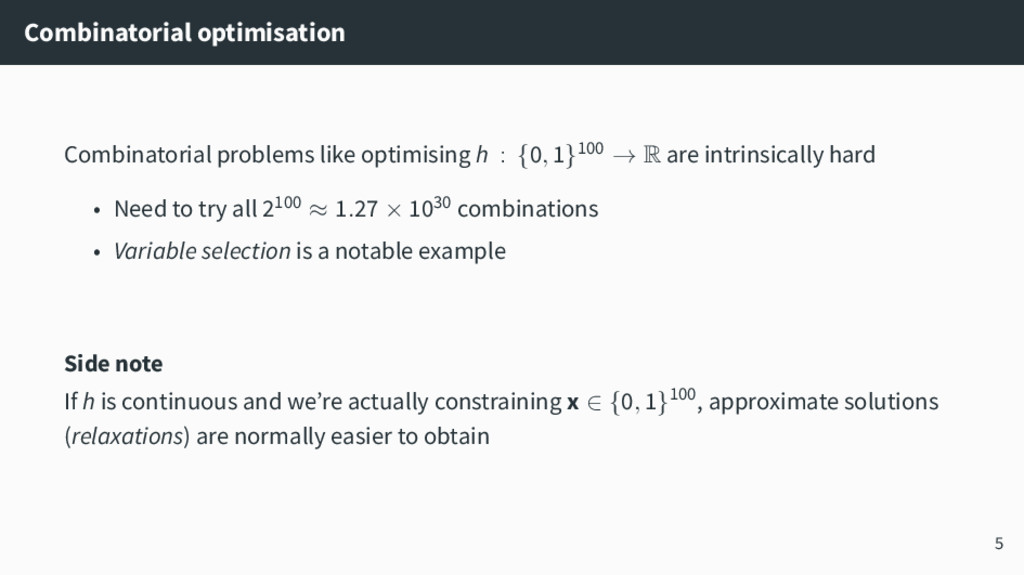
→ R are intrinsically hard • Need to try all 2100 ≈ 1.27 × 1030 combinations • Variable selection is a notable example Side note If h is continuous and we’re actually constraining x ∈ {0, 1}100, approximate solutions (relaxations) are normally easier to obtain 5
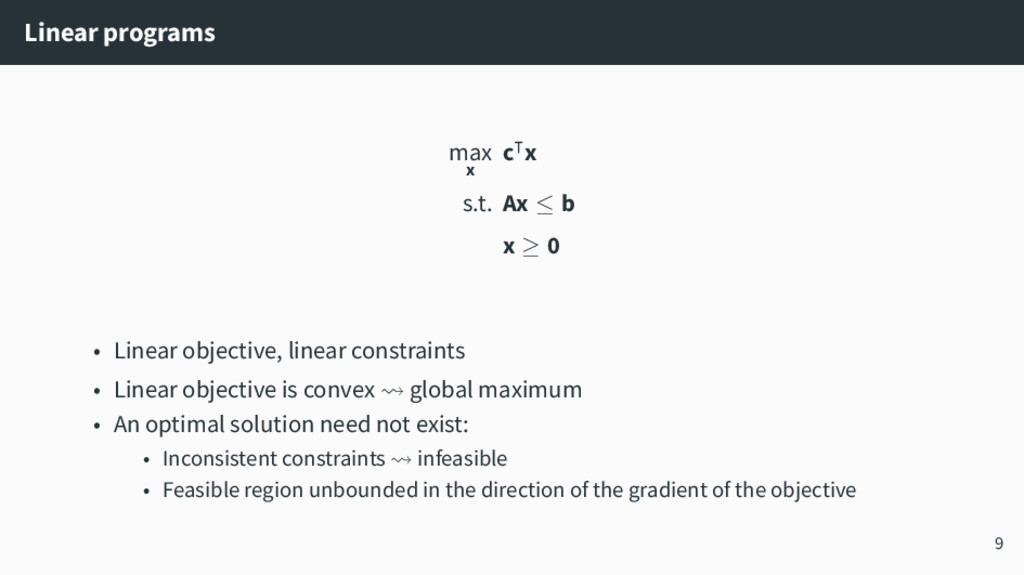
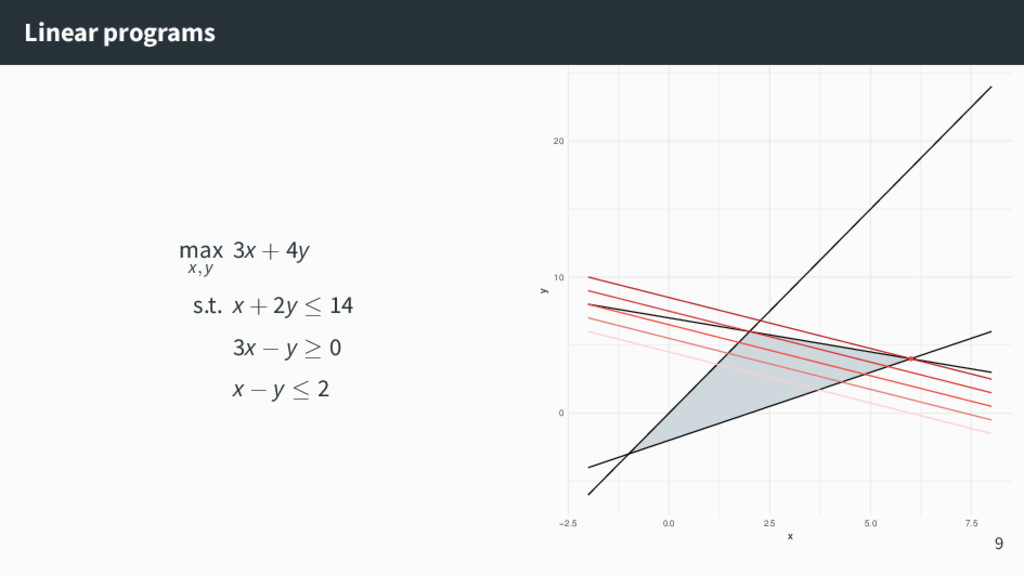
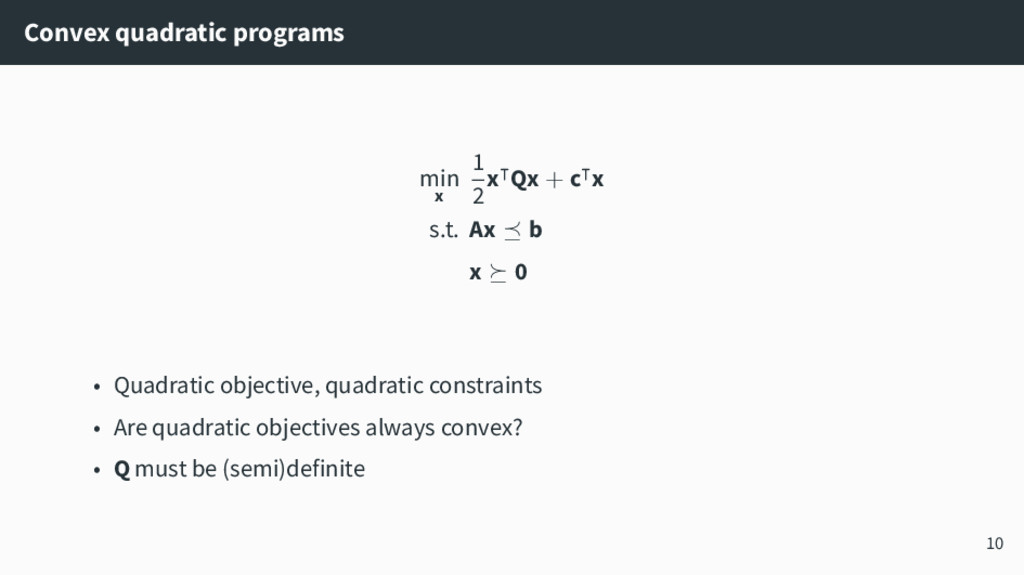
≥ 0 • Linear objective, linear constraints • Linear objective is convex ⇝ global maximum • An optimal solution need not exist: • Inconsistent constraints ⇝ infeasible • Feasible region unbounded in the direction of the gradient of the objective 9
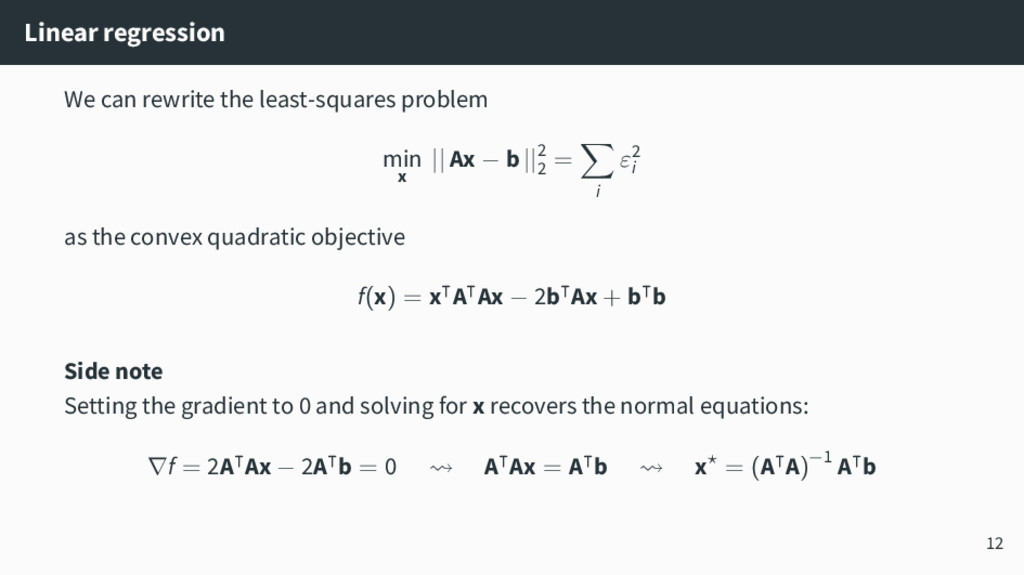
|| Ax − b ||2 2 = ∑ i ε2 i as the convex quadratic objective f(x) = x⊺A⊺Ax − 2b⊺Ax + b⊺b Side note Setting the gradient to 0 and solving for x recovers the normal equations: ∇f = 2A⊺Ax − 2A⊺b = 0 ⇝ A⊺Ax = A⊺b ⇝ x⋆ = (A⊺A)−1 A⊺b 12
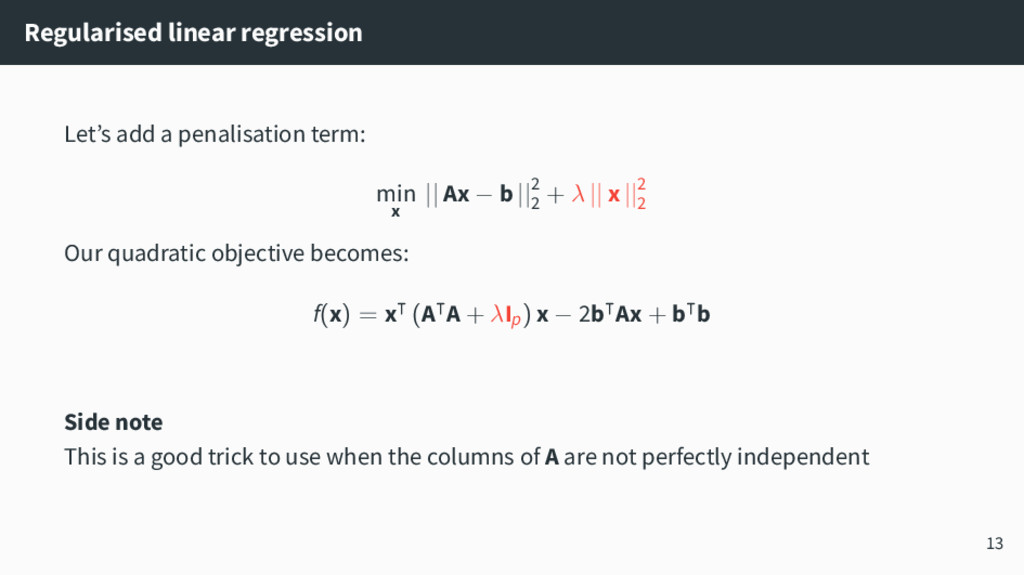
|| Ax − b ||2 2 + λ || x ||2 2 Our quadratic objective becomes: f(x) = x⊺ (A⊺A + λIp) x − 2b⊺Ax + b⊺b Side note This is a good trick to use when the columns of A are not perfectly independent 13
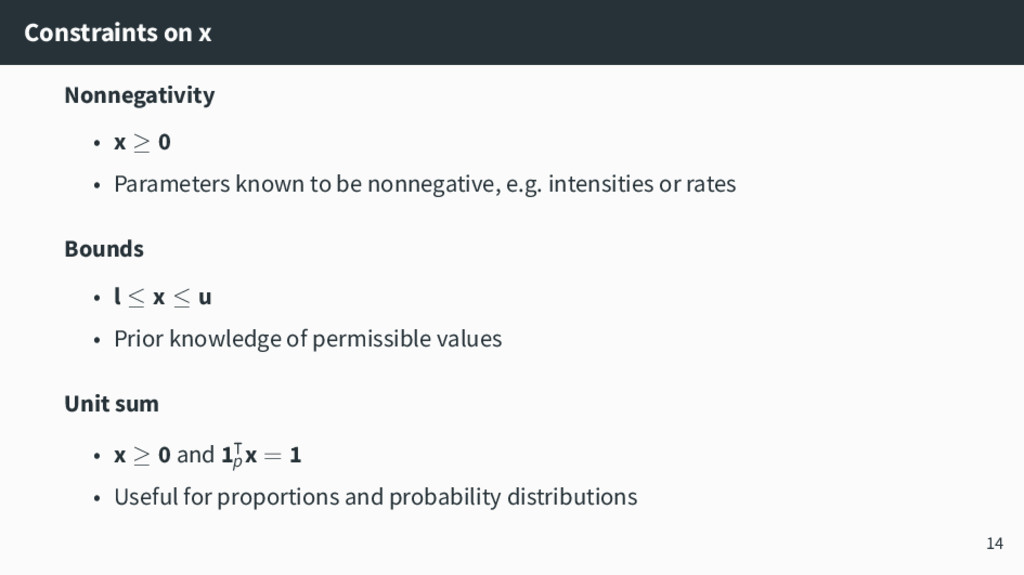
known to be nonnegative, e.g. intensities or rates Bounds • l ≤ x ≤ u • Prior knowledge of permissible values Unit sum • x ≥ 0 and 1⊺ p x = 1 • Useful for proportions and probability distributions 14
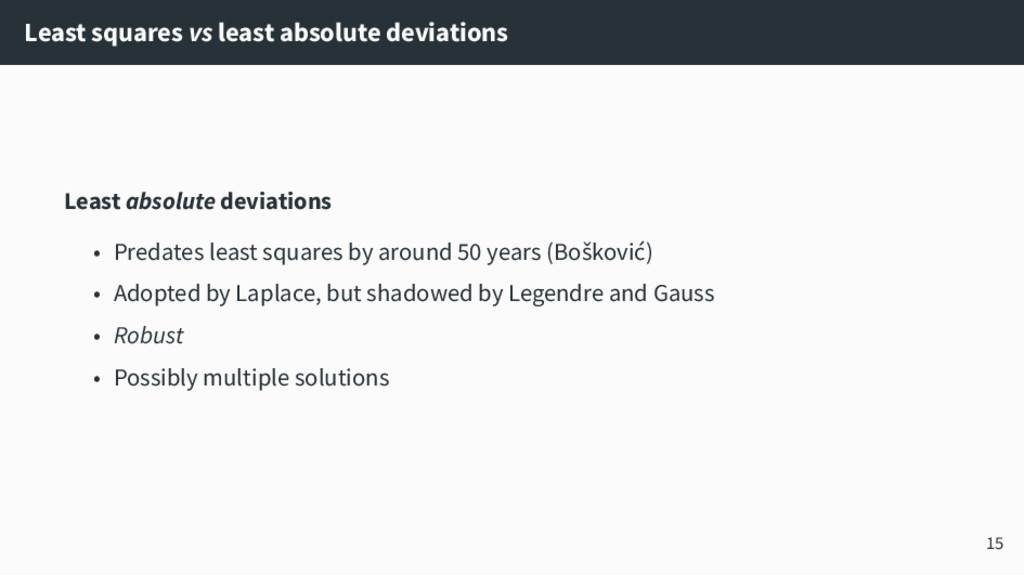
Predates least squares by around 50 years (Bošković) • Adopted by Laplace, but shadowed by Legendre and Gauss • Robust • Possibly multiple solutions 15
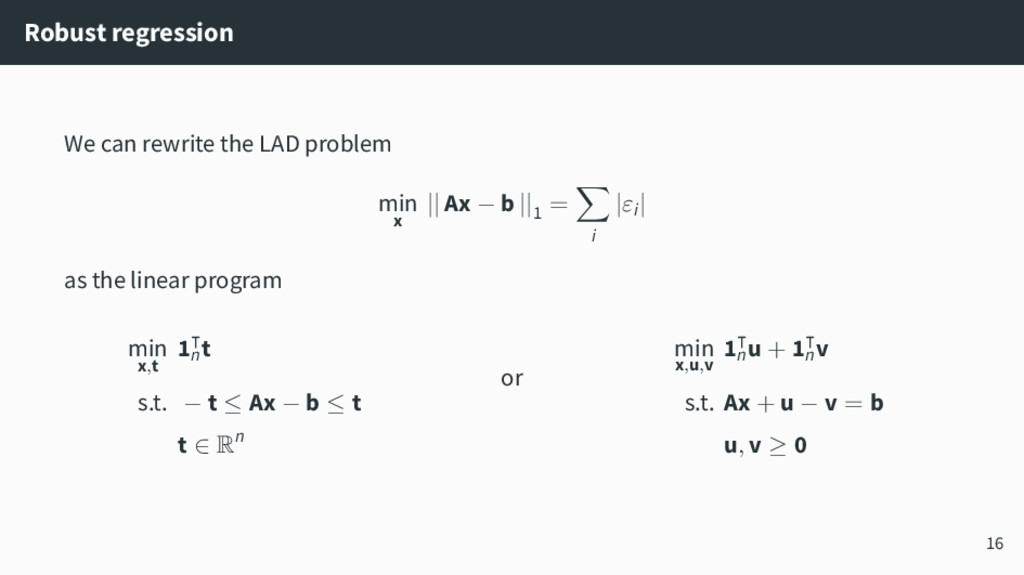
|| Ax − b ||1 = ∑ i |εi| as the linear program min x,t 1⊺ n t s.t. − t ≤ Ax − b ≤ t t ∈ Rn or min x,u,v 1⊺ n u + 1⊺ n v s.t. Ax + u − v = b u, v ≥ 0 16
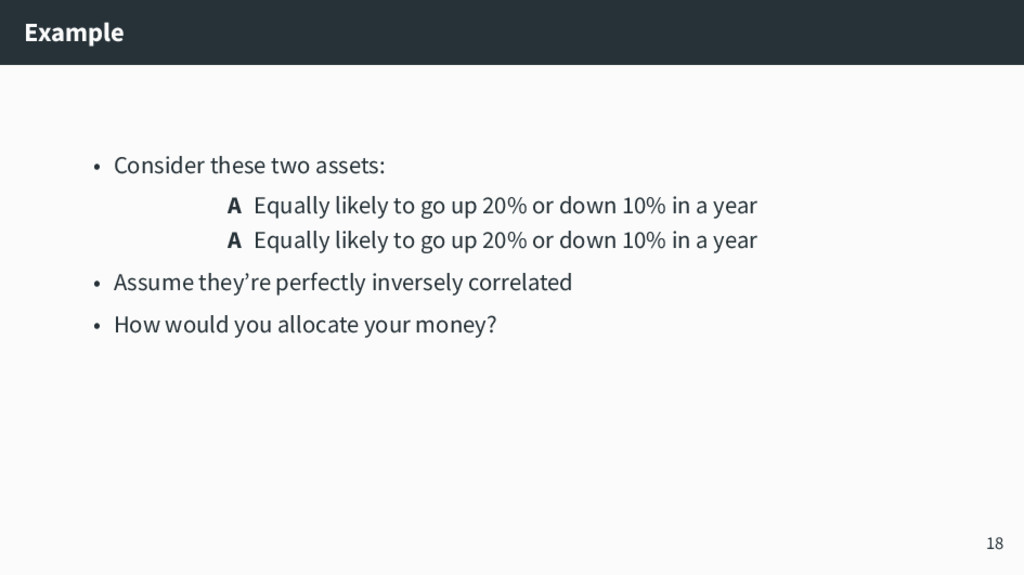
go up 20% or down 10% in a year A Equally likely to go up 20% or down 10% in a year • Assume they’re perfectly inversely correlated • How would you allocate your money? 18
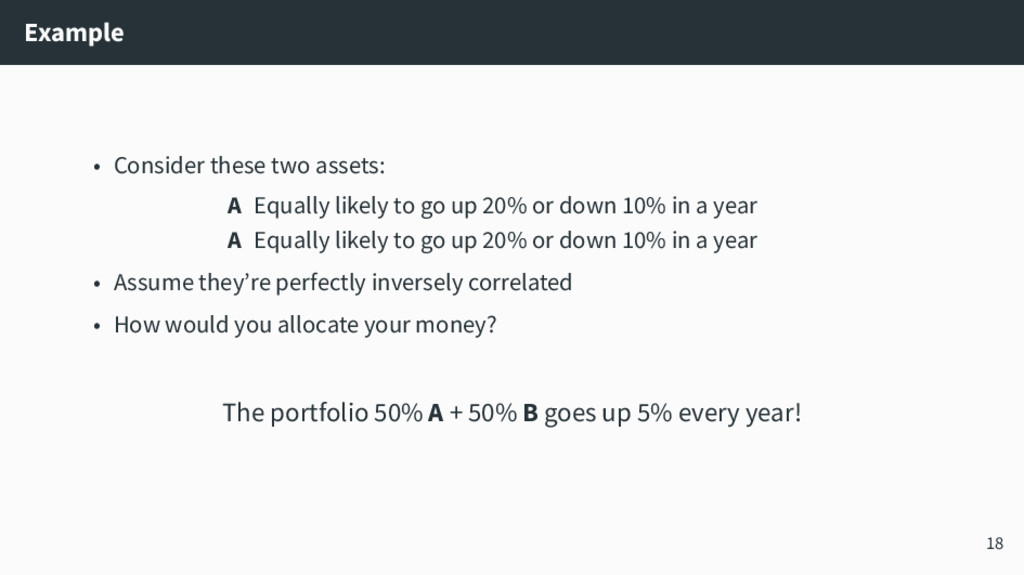
go up 20% or down 10% in a year A Equally likely to go up 20% or down 10% in a year • Assume they’re perfectly inversely correlated • How would you allocate your money? The portfolio 50% A + 50% B goes up 5% every year! 18
asset i at time t ≤ T, we can compute: • The reward of asset i: rewardi = 1 T ∑ t ri(t) • The risk of asset i: riski = 1 T ∑ t [ri(t) − rewardi]2 We can compute the same quantities for a portfolio x ≥ 0, 1⊺ p x = 1 19
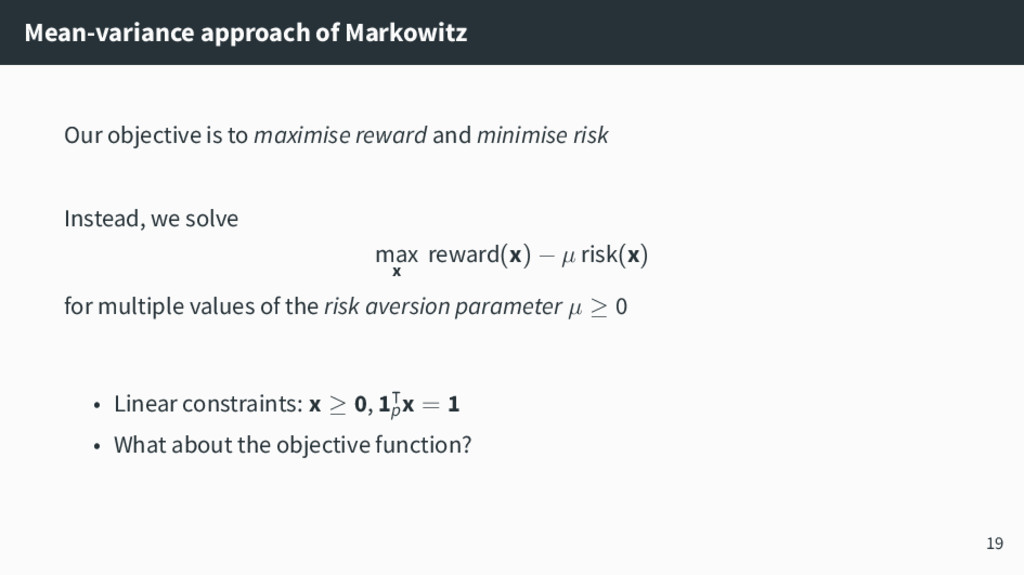
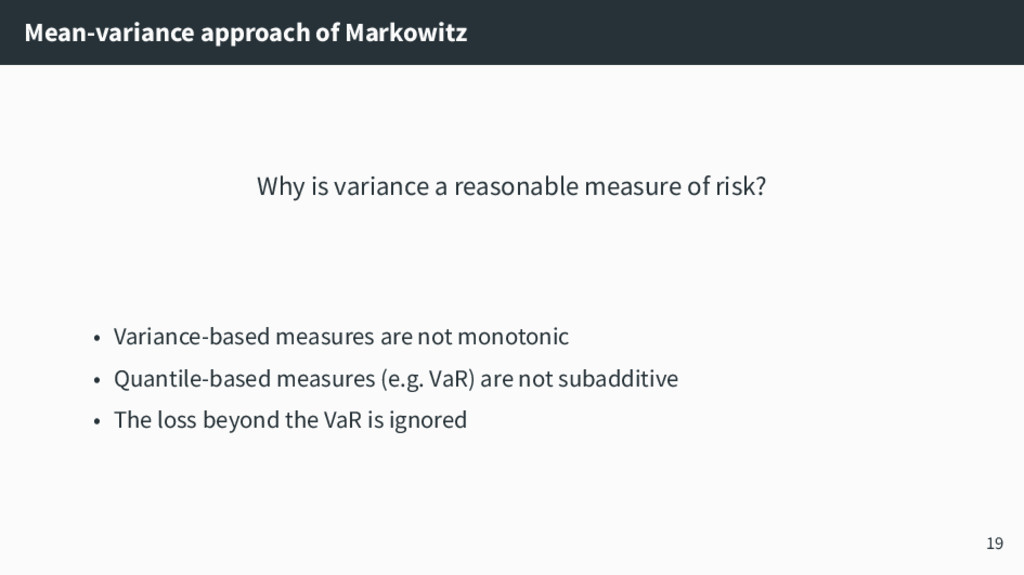
and minimise risk Instead, we solve max x reward(x) − µ risk(x) for multiple values of the risk aversion parameter µ ≥ 0 • Linear constraints: x ≥ 0, 1⊺ p x = 1 • What about the objective function? 19
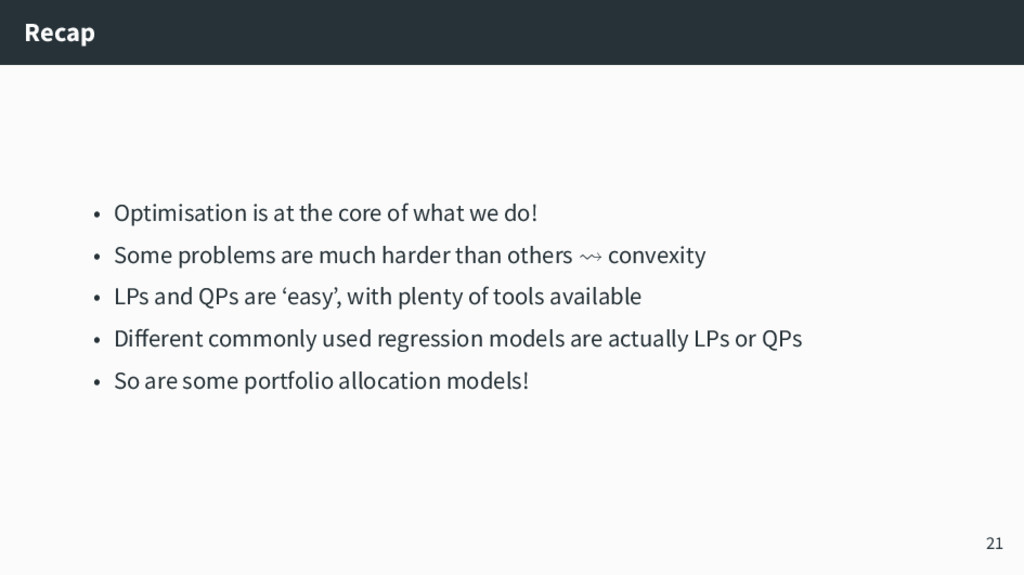
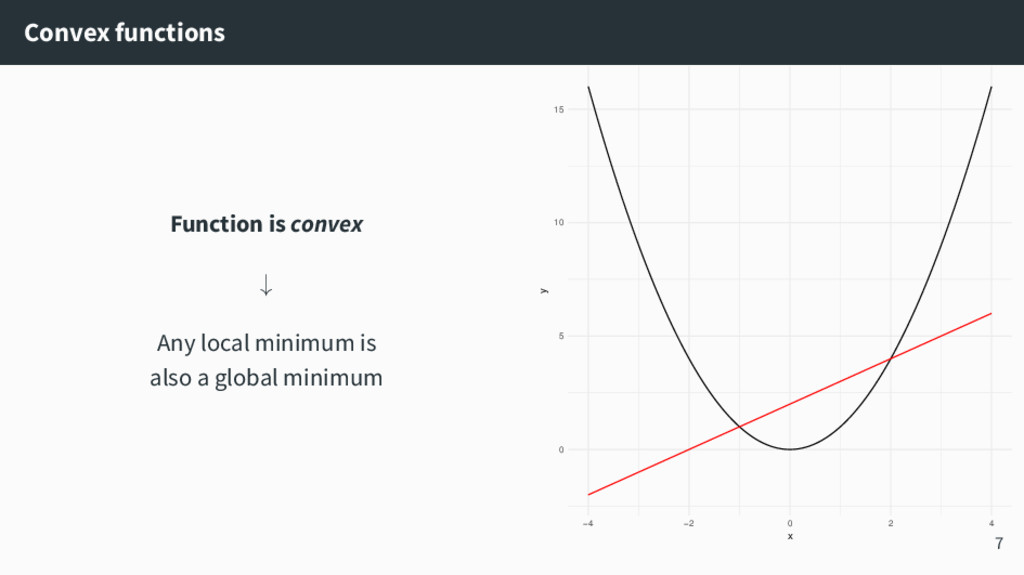
do! • Some problems are much harder than others ⇝ convexity • LPs and QPs are ‘easy’, with plenty of tools available • Different commonly used regression models are actually LPs or QPs • So are some portfolio allocation models! 21


 gcampanella
 martinlippert
 trycycle
 nagano
 masakiokuda
 analokmaus
.jpeg) arthur1
arthur1
 hanbao
 rlifchitz
 rajeshrinet
 institutdelelevage
 addyosmani
 inesmontani
 tmiket
 kimpetersen
 lauravandoore
 tammyeverts
 baasie
 ivargrimstad
 chrisshort
 bethany
 aleyda



![Constrained optimisation What about g : [0, 1]100 → R?](https://files.speakerdeck.com/presentations/cc6bec5254ce46b4a5c0c0d612d4e093/slide_10.jpg)