Presentation on 3D FMBV method used in the placenta presented at the Interational Society of Ultrasound in Obstetrics and Gynaecology World Congress, Copenhagen, 2012.
(FMBV) estimation using power Doppler ultrasound (PD-US)” Gordon N. Stevenson1, Sally L. Collins2, Alec W. Welsh3, Lawrence W. Impey2, J. Alison Noble1 1Institute of Biomedical Engineering, Dept. of Eng. Science, University of Oxford, United Kingdom. 2Oxford Fetal Medicine Unit, John Radcliffe Hospital, Oxford, United Kingdom. 3School of Womens’ & Childrens’ Health, Royal Hospital for Women, University of New South Wales, Sydney, NSW, Australia. G.N Stevenson (University of Oxford) 3D FMBV of the Placenta ISUOG 2012 1 / 9
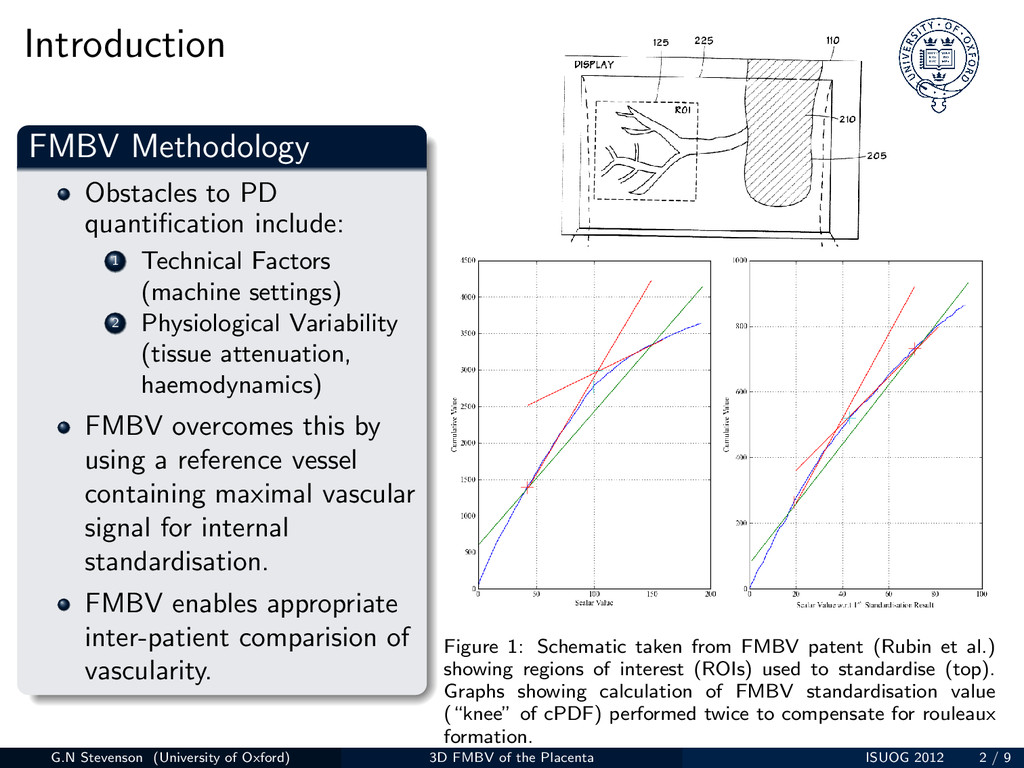
Factors (machine settings) 2 Physiological Variability (tissue attenuation, haemodynamics) FMBV overcomes this by using a reference vessel containing maximal vascular signal for internal standardisation. FMBV enables appropriate inter-patient comparision of vascularity. Figure 1: Schematic taken from FMBV patent (Rubin et al.) showing regions of interest (ROIs) used to standardise (top). Graphs showing calculation of FMBV standardisation value (“knee” of cPDF) performed twice to compensate for rouleaux formation. G.N Stevenson (University of Oxford) 3D FMBV of the Placenta ISUOG 2012 2 / 9
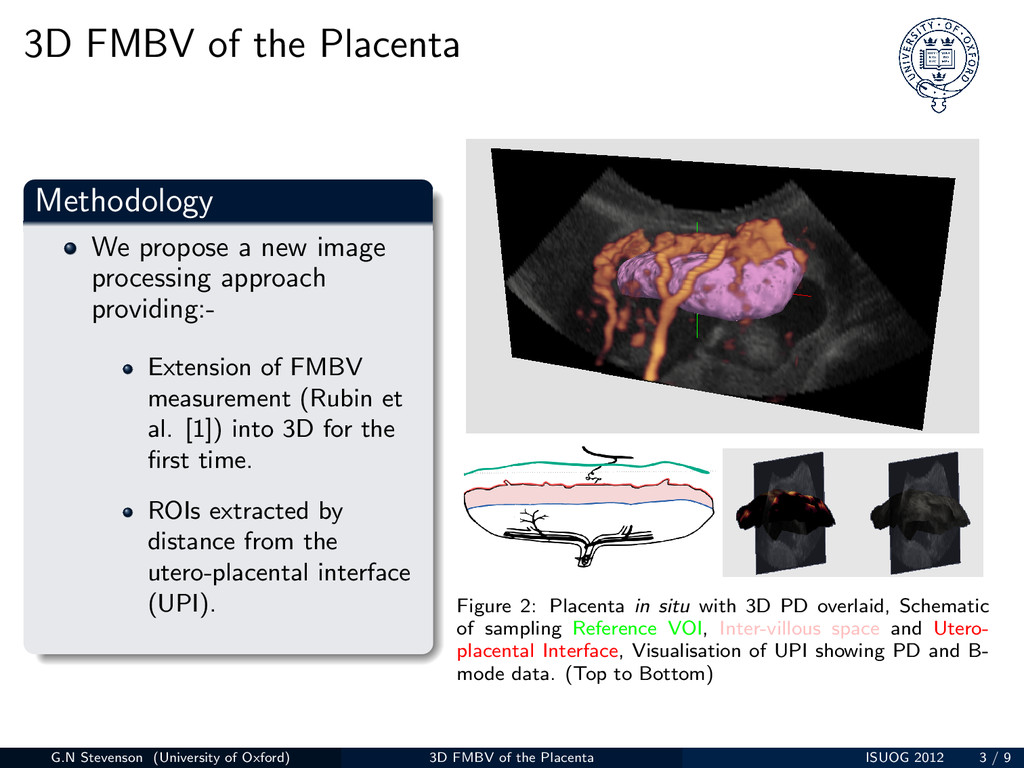
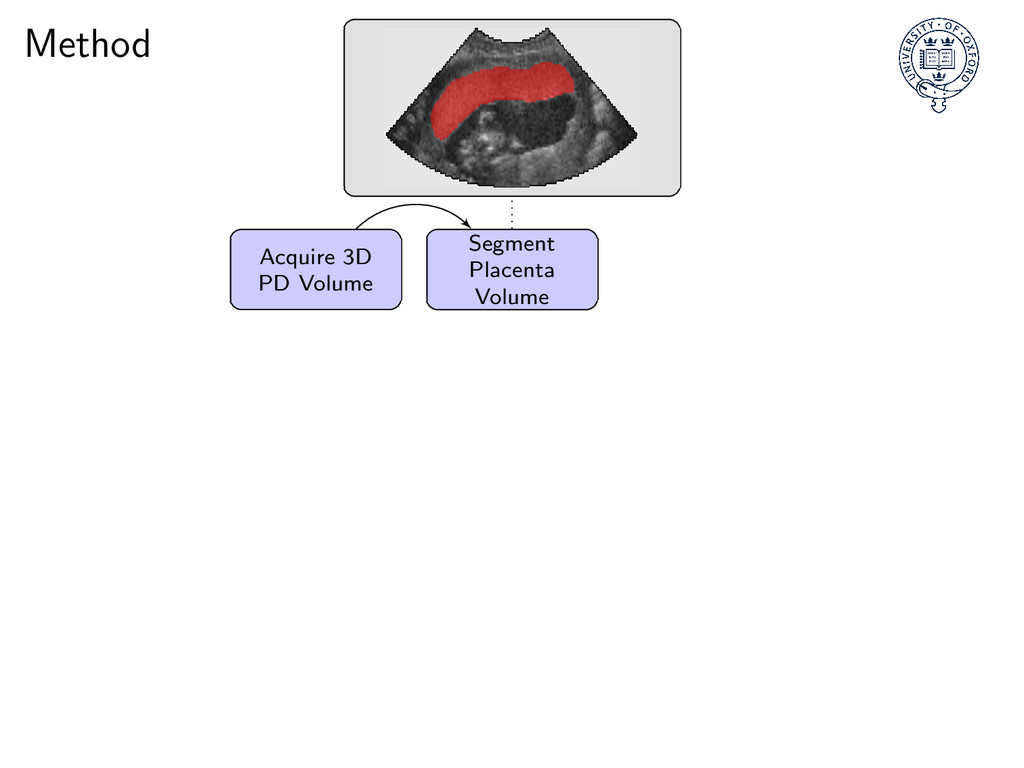
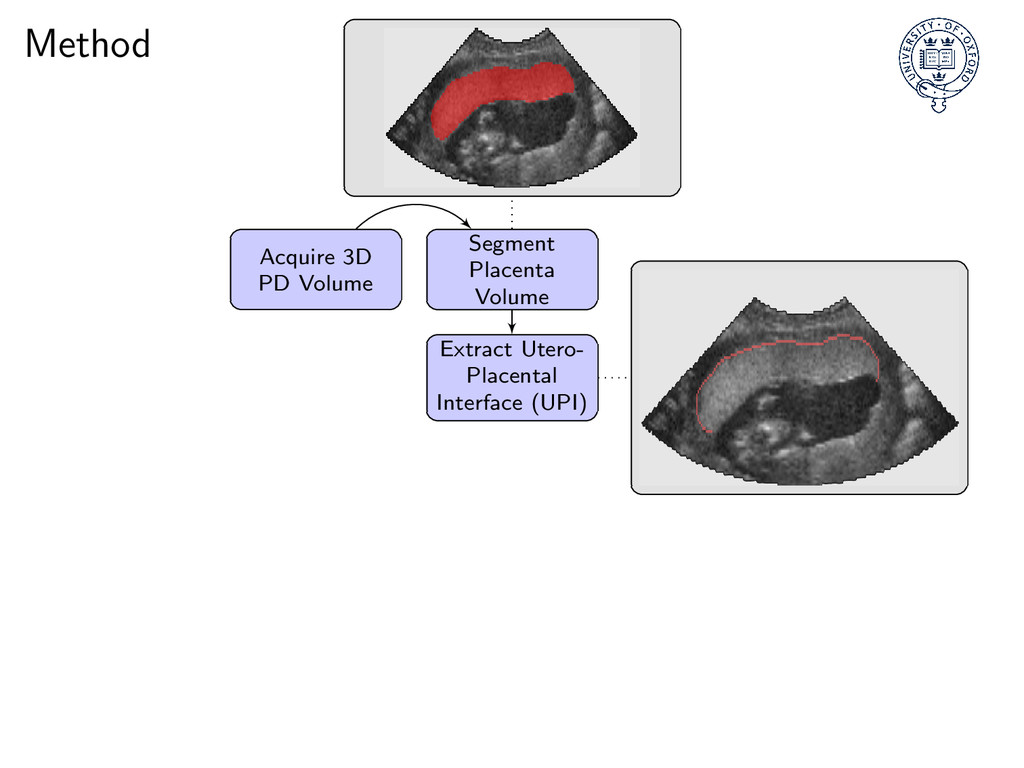
image processing approach providing:- Extension of FMBV measurement (Rubin et al. [1]) into 3D for the first time. ROIs extracted by distance from the utero-placental interface (UPI). Figure 2: Placenta in situ with 3D PD overlaid, Schematic of sampling Reference VOI, Inter-villous space and Utero- placental Interface, Visualisation of UPI showing PD and B- mode data. (Top to Bottom) G.N Stevenson (University of Oxford) 3D FMBV of the Placenta ISUOG 2012 3 / 9
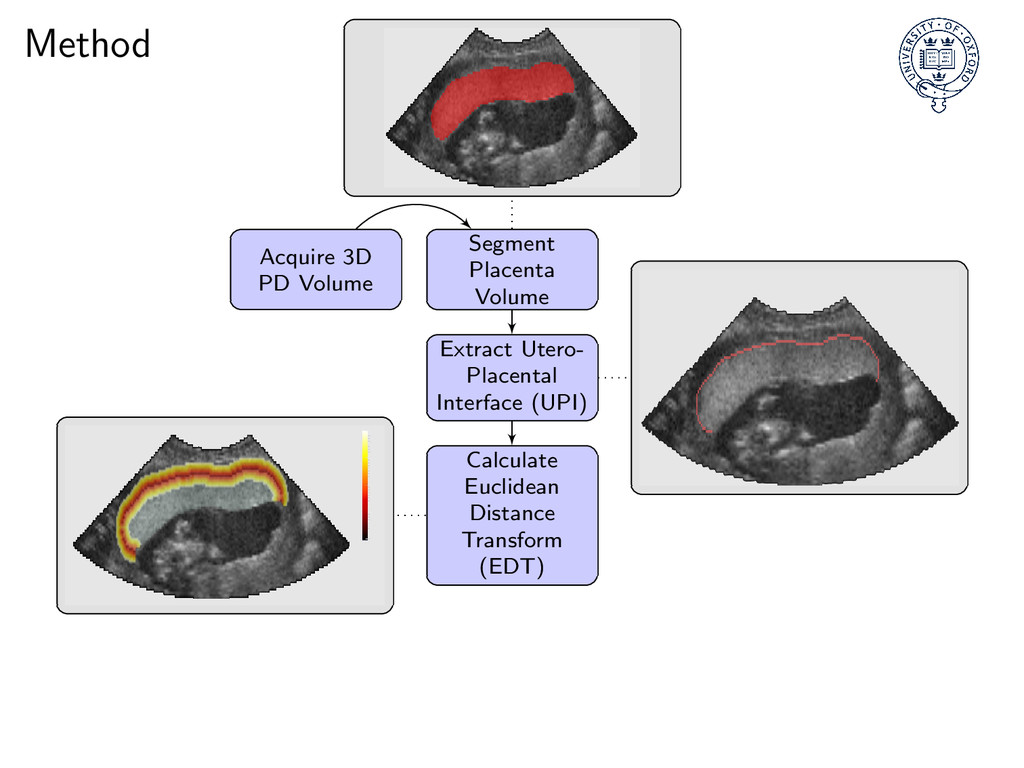
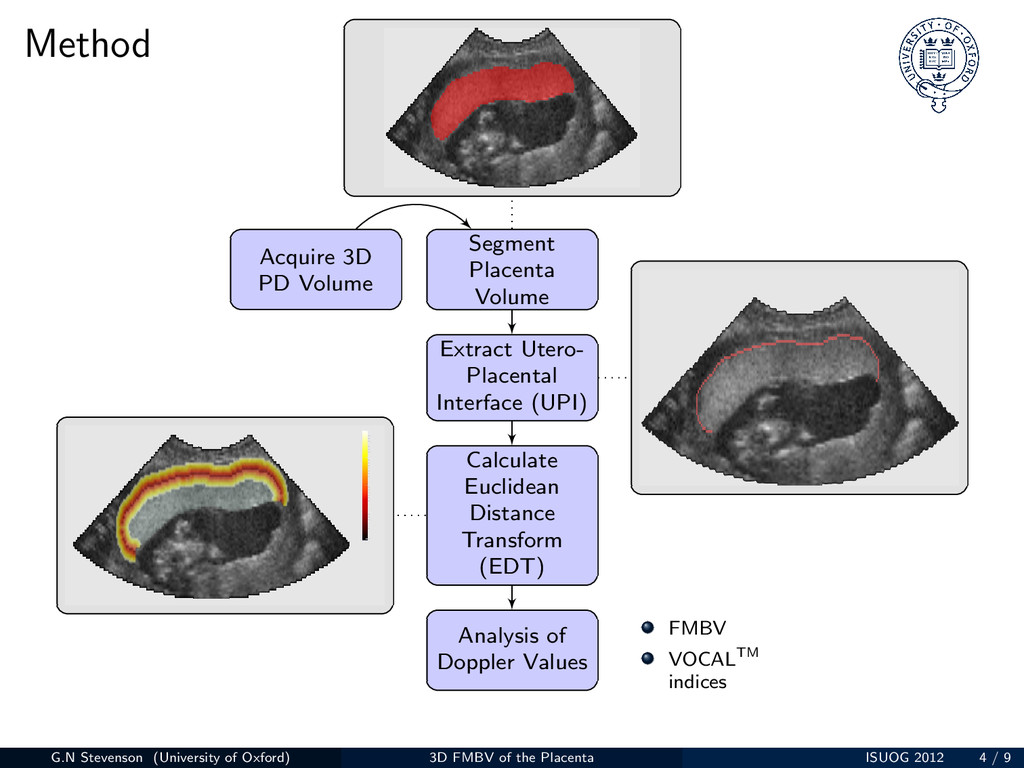
Placental Interface (UPI) Calculate Euclidean Distance Transform (EDT) Analysis of Doppler Values FMBV VOCALTM indices G.N Stevenson (University of Oxford) 3D FMBV of the Placenta ISUOG 2012 4 / 9
FMBV, VOCAL indices (VI & FI) and Mean Pixel Intensity (MPI) were calculated for VOIs set distances from the UPI. FMBV standardisation was taken from 10mm above the UPI . [3] Figure 3: Visualisation of framework showing 3D placental volume, 2D B-Mode slice and VOIs with colouring based on Euclidean Distance from UPI. G.N Stevenson (University of Oxford) 3D FMBV of the Placenta ISUOG 2012 5 / 9
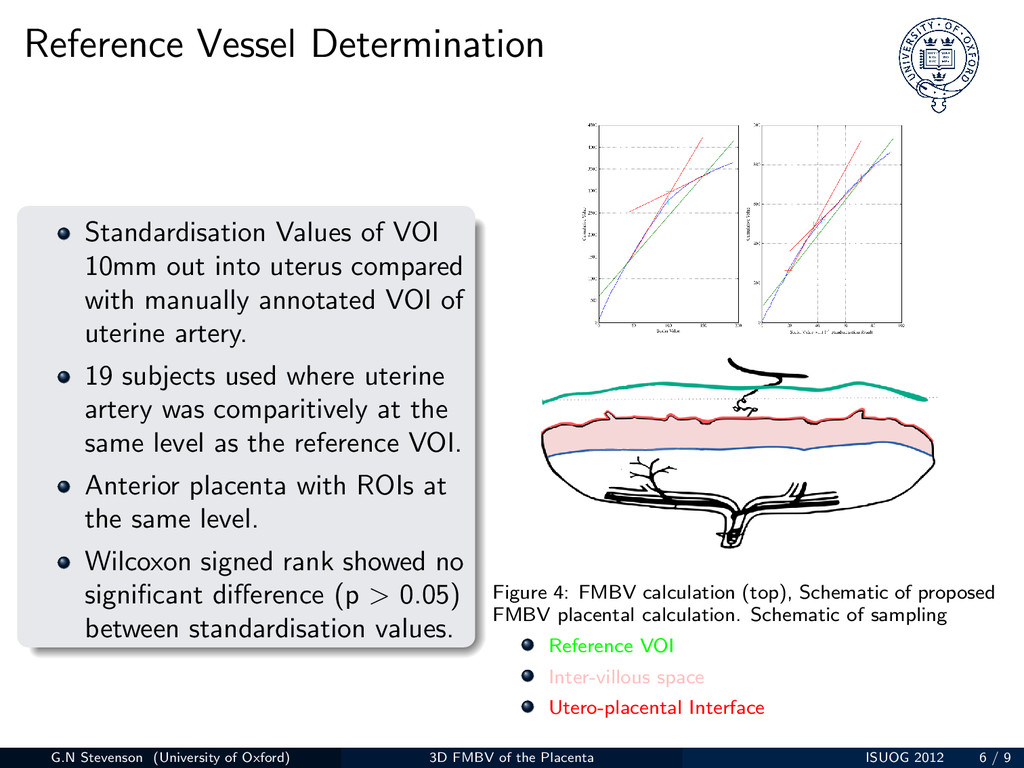
uterus compared with manually annotated VOI of uterine artery. 19 subjects used where uterine artery was comparitively at the same level as the reference VOI. Anterior placenta with ROIs at the same level. Wilcoxon signed rank showed no significant difference (p > 0.05) between standardisation values. Figure 4: FMBV calculation (top), Schematic of proposed FMBV placental calculation. Schematic of sampling Reference VOI Inter-villous space Utero-placental Interface G.N Stevenson (University of Oxford) 3D FMBV of the Placenta ISUOG 2012 6 / 9
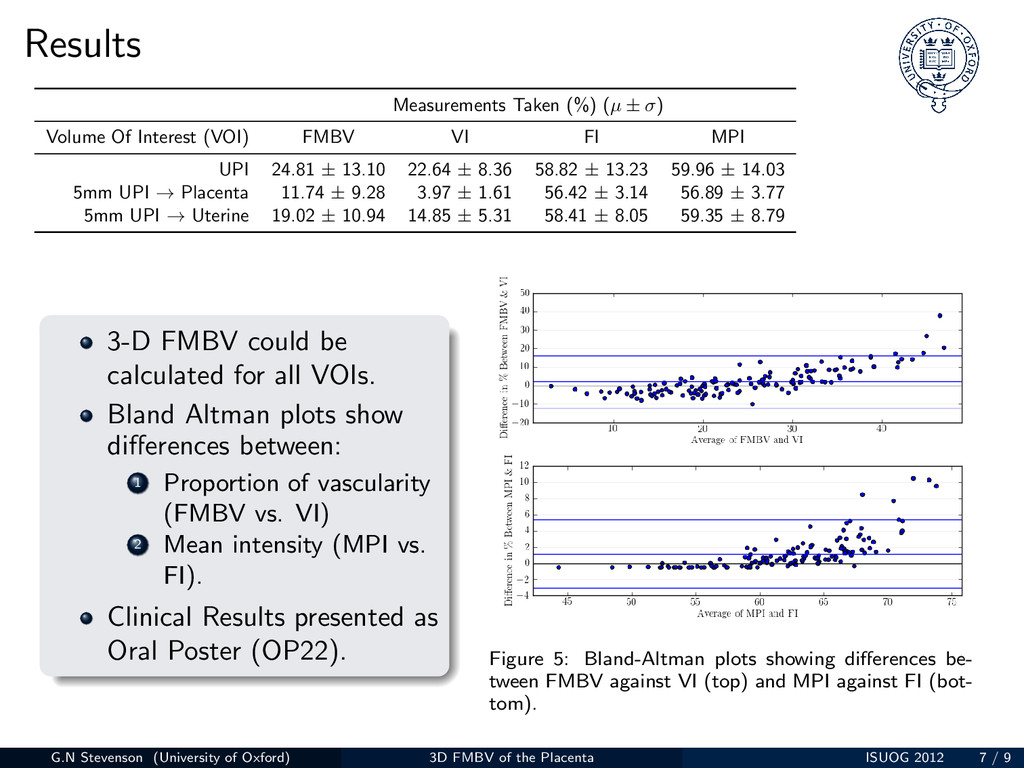
into 3D using offline semi-automated image processing. VOCAL indices only correlate with 3D-FMBV and MPI in VOIs with low vascularity. Advantages of our technique: Standardisation allows appropriate inter-patient comparison Automation reduces sampling and operator error The method is independent of make of US machine used. Future Work Further Validation - Phantom, Inter-Machine and Longitudinal Studies Full Automation. G.N Stevenson (University of Oxford) 3D FMBV of the Placenta ISUOG 2012 8 / 9
Centre and Oxford Fetal Medicine Unit. References Rubin, J.M. and Adler, R.S. and Fowlkes, J.B. and Spratt, S. and Pallister, J.E. and Chen, J.F. and Carson, P.L., Fractional moving blood volume: estimation with power Doppler US., Radiology, 1995. Stevenson, G. N. and Collins, S.L. and Impey, L. and Noble, J.A., A novel semi-automated (SA) technique for 3D ultrasound measurement of placental volume, ISUOG World Congress,2010,36,82, S1. Burton, G.J. and Woods, A.W. and Jauniaux, E., Rheological and physiological consequences of conversion of the maternal spiral arteries for uteroplacental blood flow during human pregnancy, Placenta, 2009, 30, 473–482, 6. G.N Stevenson (University of Oxford) 3D FMBV of the Placenta ISUOG 2012 9 / 9