Upgrade to Pro — share decks privately, control downloads, hide ads and more …

Increasing library intelligence by harmonizing assessment tools

Giannis Tsakonas
July 25, 2019
230

Increasing library intelligence by harmonizing assessment tools

Purpose: Academic libraries are considered as key factors in the educational system of a country and strong pylons for the economic development and societal cohesion. Libraries have always intended to provide qualitative services and frequently run surveys that measure the opinion of their users. Our contribution aims to show how the findings of a survey can be aligned with information from other assessment tools to better inform library management.
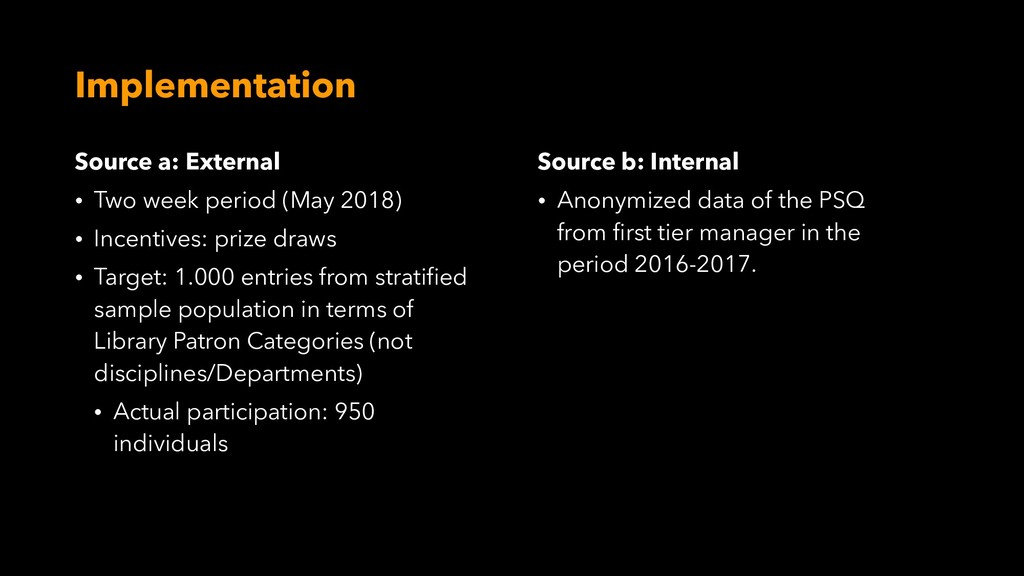
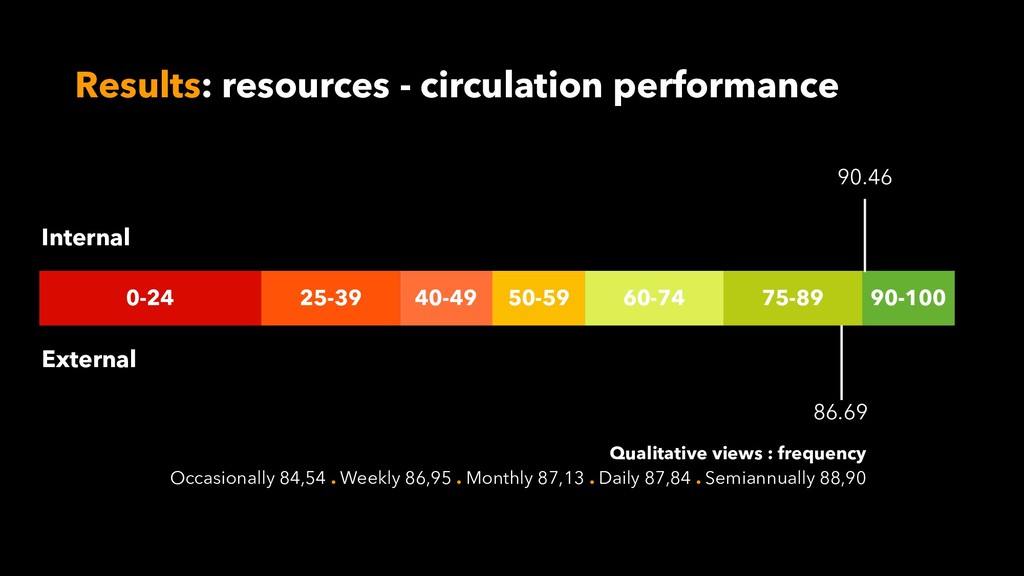
Design, methodology or approach: We analyze external data of our Library’s performance as collected by an electronically conducted survey in May 2018. The initial objective was to collect 1000 questionnaires from all registered Library users; however, 950 questionnaires were collected in a two weeks’ period, securing the quota sampling conditions. Descriptive statistical analysis via SPSS was conducted to find the key measurements and to explore deeper the various associations. At the same time, we compared the scores of library performance as reflected in internal managerial assessment practices over the span of two years.
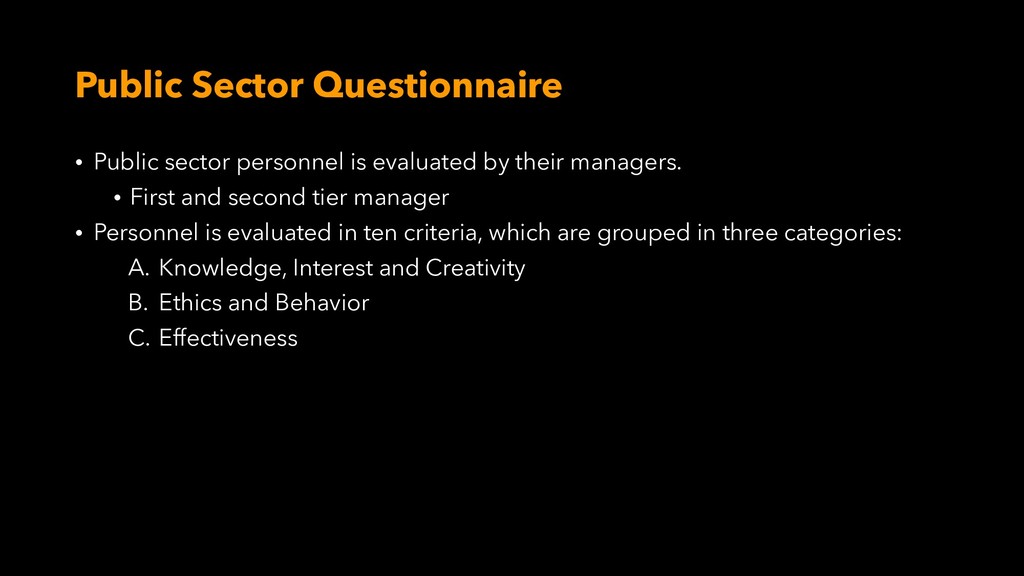
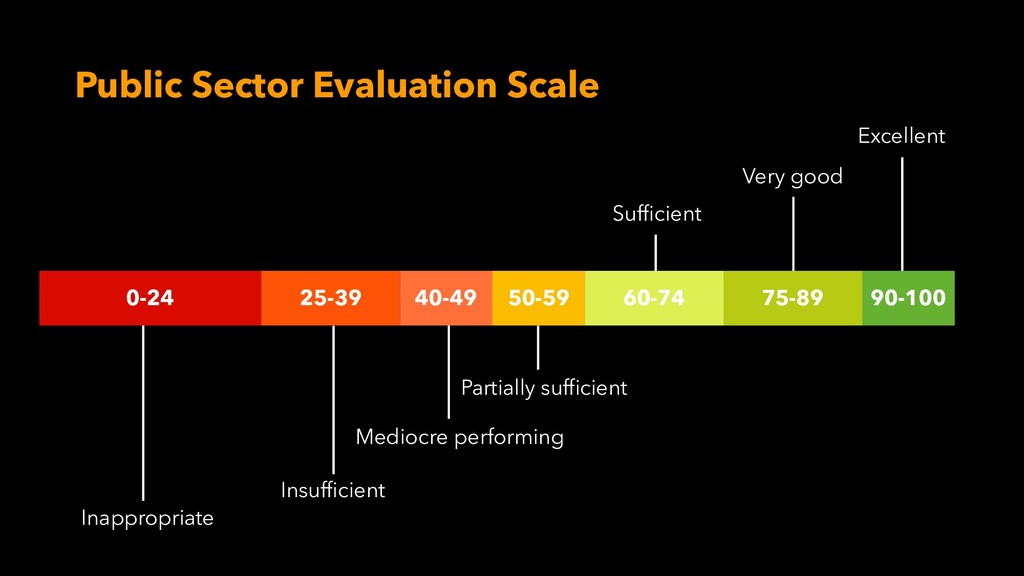
Originality and value of the proposal: This study applies a framework that exploits the existing percentage measurement scale for the assessment of Greek public sector employees to gather users’ opinion on certain performance categories. This scale, as well as its interpretation module, is used for the defragmentation of the information that comes from varied assessment notions, tools and practices.
Research or practical limitations or implications (as applicable): The study is a quantitative one. It is constrained by the country conditions, which cannot be the same elsewhere, but it gives an example how various assessment tools can be coordinated.
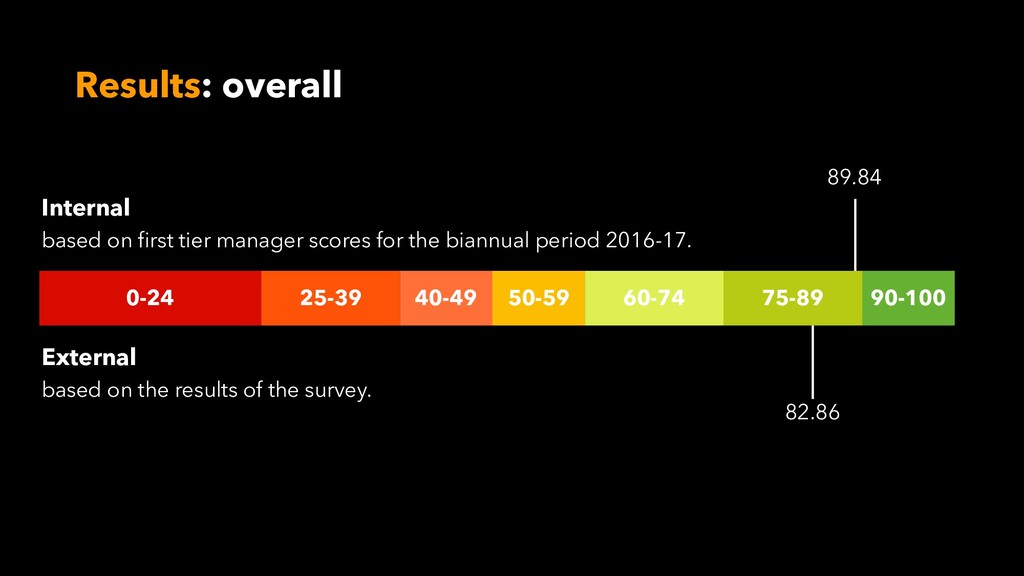
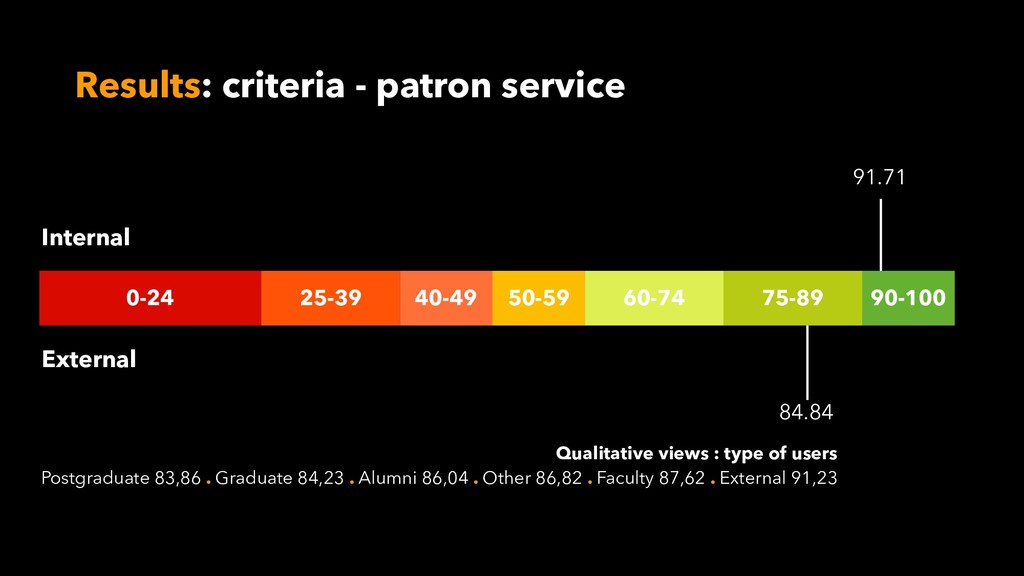
Findings: Our survey findings showed that the library users were well satisfied with the conduct of staff and think that the library has margins for improvement to fulfil its role as a study place and collection. These findings seem close to the respective internal assessment scores. Therefore, our study showcases that there can be a harmonization of various assessments tools, internal and external, and the library administration can be informed about its performance in a coherent way.
Conclusions: The present study offers a new viewpoint for the harmonization of various assessment tools, either coming from the library user base, or from the public sector management.

Giannis Tsakonas

July 25, 2019
Tweet

More Decks by Giannis Tsakonas

Transcript

  1. increasing library intelligence by harmonizing assessment tools Aggeliki Giannopoulou, Georgia

    Giannopoulou, Alexandra Goudis, Giannis Tsakonas Library & Information Center, University of Patras, Greece 13th International Conference on Performance Measurement in Libraries
  2. Why & Purpose • There are different tools that evaluate

    performance of an organization /often custom-made / for various levels: institutional, national, sector. • Different instruments & scales do not associate. There is lack of a common interpretation schema to enable decision making. • Distinct, asynchronous and non-associated evaluation practices increase demands in resources. we were motivated by the need to have a light-weight evaluation instrument that is not constrained by domain specific elements and is connected with the Public Sector practices for performance evaluation
  3. Public Sector Questionnaire • Public sector personnel is evaluated by

    their managers. • First and second tier manager • Personnel is evaluated in ten criteria, which are grouped in three categories: A. Knowledge, Interest and Creativity B. Ethics and Behavior C. Effectiveness
  4. Public Sector Evaluation Scale Excellent Inappropriate Insufficient Mediocre performing Partially

    sufficient Sufficient Very good 0-24 25-39 40-49 50-59 60-74 75-89 90-100
  5. Conditions • Mapping conceptually the relevant criteria together (Qc and

    Q2) LIS PSQ p1 p2 p3 p4 p... Qa Q1 Qb Q2 Qc Q3 • Mapping criteria to resources (p1, p3, p4... = personnel members responsible for the performance of a service)
  6. Implementation Source a: External • Two week period (May 2018)

    • Incentives: prize draws • Target: 1.000 entries from stratified sample population in terms of Library Patron Categories (not disciplines/Departments) • Actual participation: 950 individuals Source b: Internal • Anonymized data of the PSQ from first tier manager in the period 2016-2017.
  7. Instrument • 13 questions • Online (the last three days

    some printed were also collected) • Mobile devices friendly • Encourage youngsters' participation. • One page • Sliders for percentages
  8. Results: overall Internal based on first tier manager scores for

    the biannual period 2016-17. External based on the results of the survey. 0-24 25-39 40-49 50-59 60-74 75-89 90-100 89.84 82.86
  9. Results: criteria - patron service 0-24 25-39 40-49 50-59 60-74

    75-89 90-100 Internal External 91.71 84.84 Qualitative views : type of users Postgraduate 83,86 . Graduate 84,23 . Alumni 86,04 . Other 86,82 . Faculty 87,62 . External 91,23
  10. Results: resources - circulation performance 0-24 25-39 40-49 50-59 60-74

    75-89 90-100 Internal External 86.69 90.46 Qualitative views : frequency Occasionally 84,54 . Weekly 86,95 . Monthly 87,13 . Daily 87,84 . Semiannually 88,90
  11. Conclusions • We are able to see on a consistent

    and commonly applied scheme various performance scores and to interpret the results of the user survey with a scale that operates in a detailed context. • The percentage scale is easy to communicate to the public and understand it, while it is transparent and straightforward for the library administration. • This approach provides a validation benchmark to the first tier manager for comparing his assessment practices. • All results should be interpreted in context. There are certain limitations in resources. • Future work includes the fine-tuning of our survey instrument. The semantics of each question should be clearly mapped.