Upgrade to Pro — share decks privately, control downloads, hide ads and more …

The Economic Impact of Integrated Medical-Behavioral Services

Health Integrated
March 26, 2015
240

The Economic Impact of Integrated Medical-Behavioral Services

Presented by Stephen P. Melek at the Executive Leadership Summit on March 24 - 26, 2015.

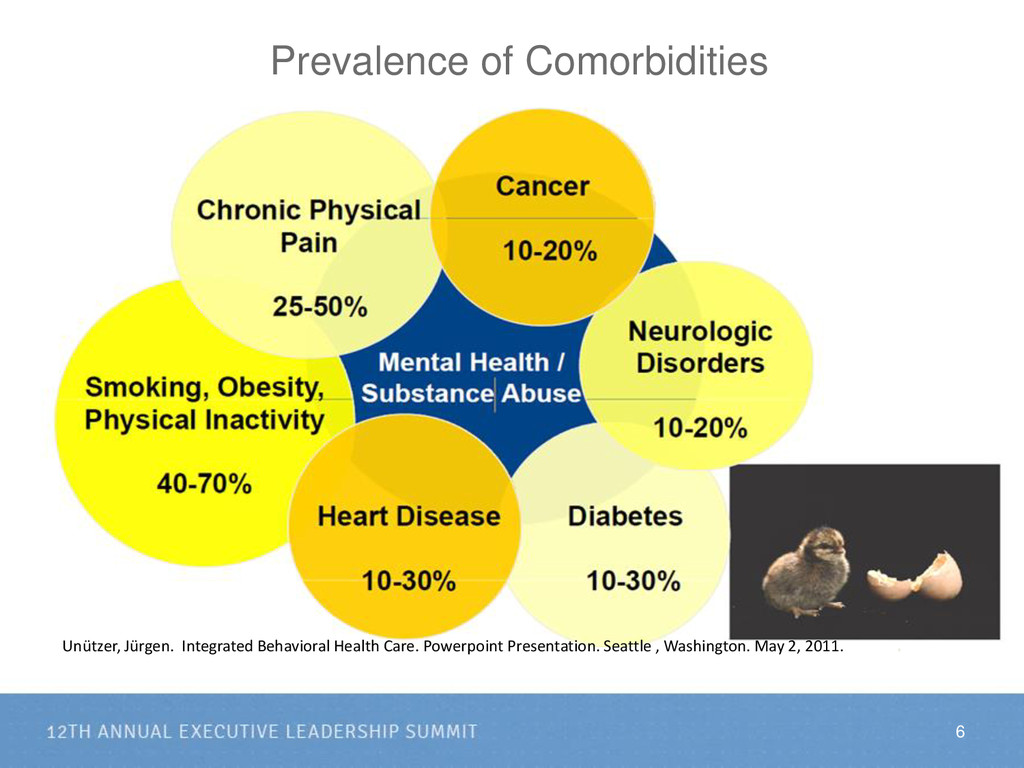
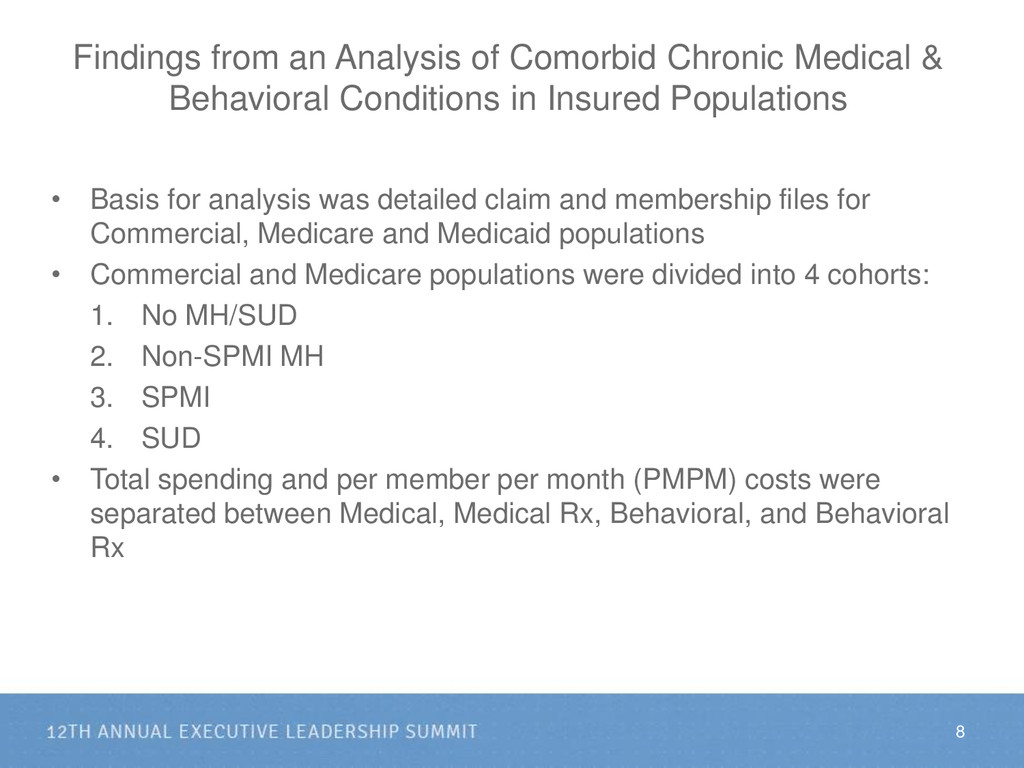
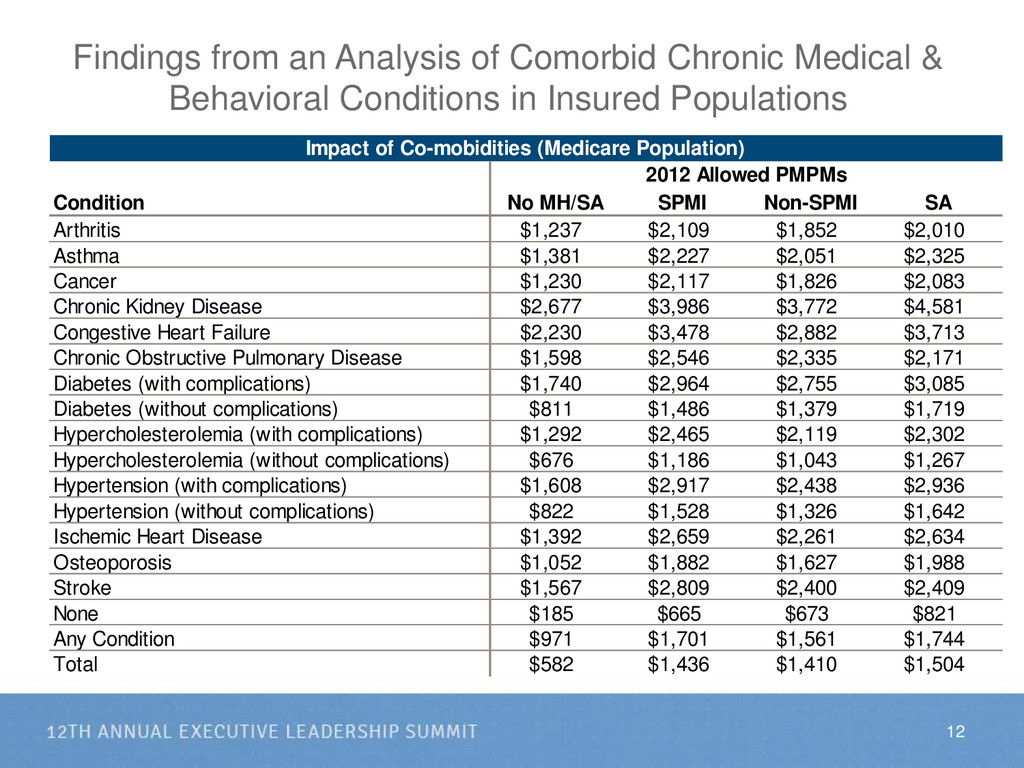
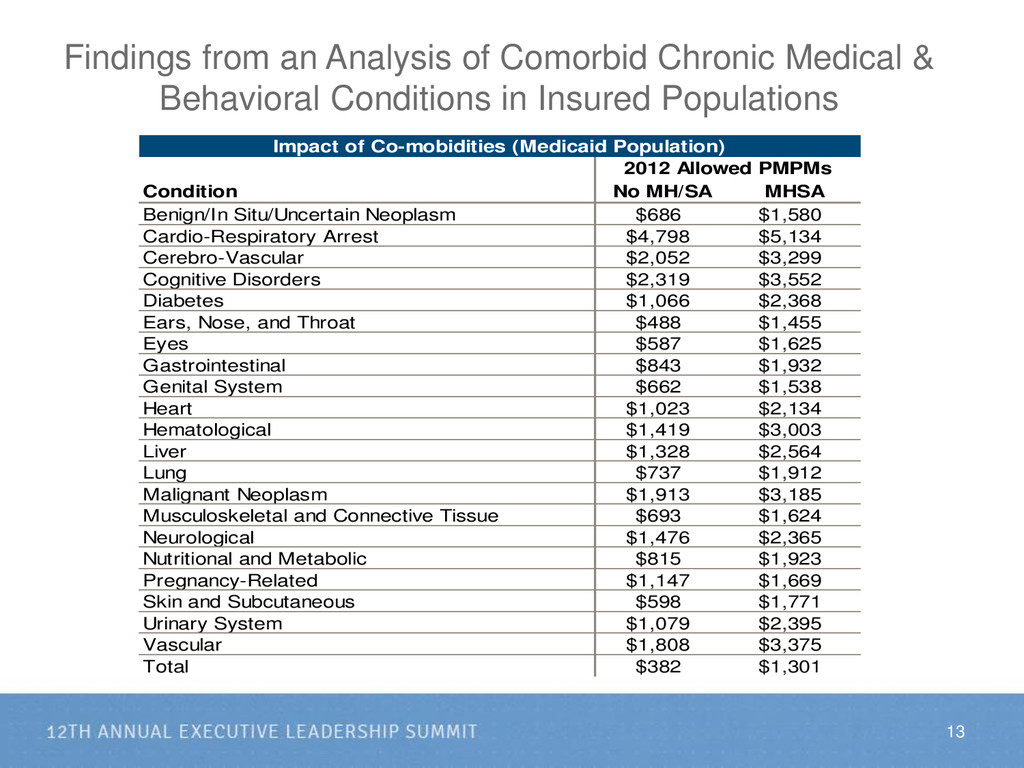
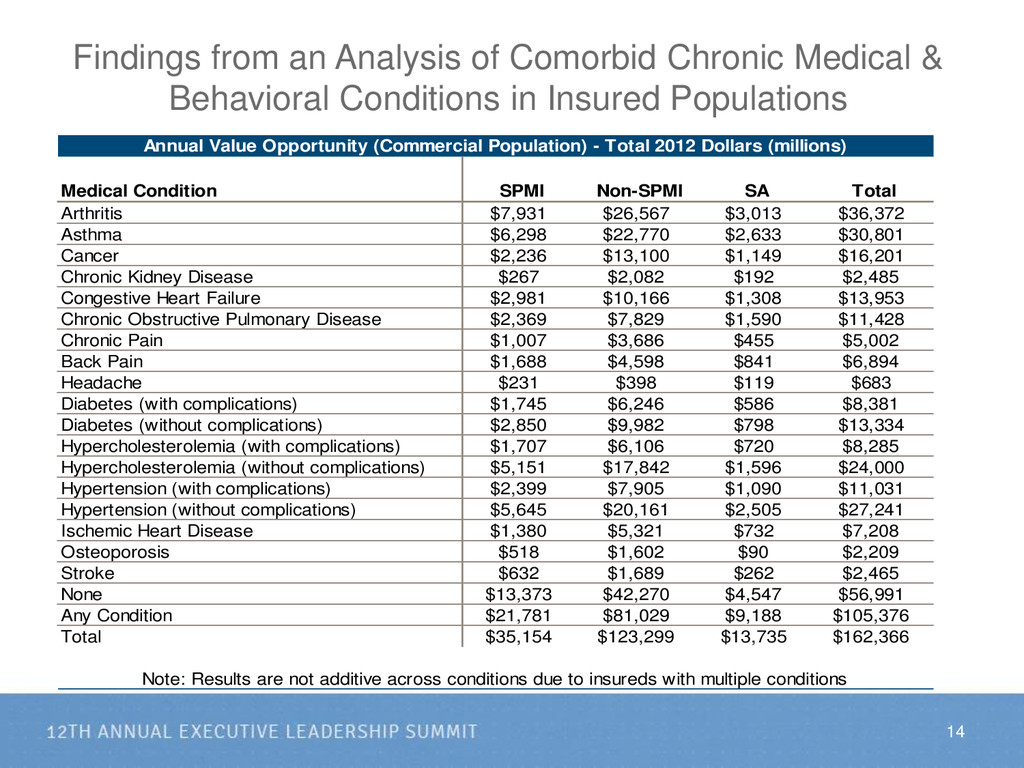
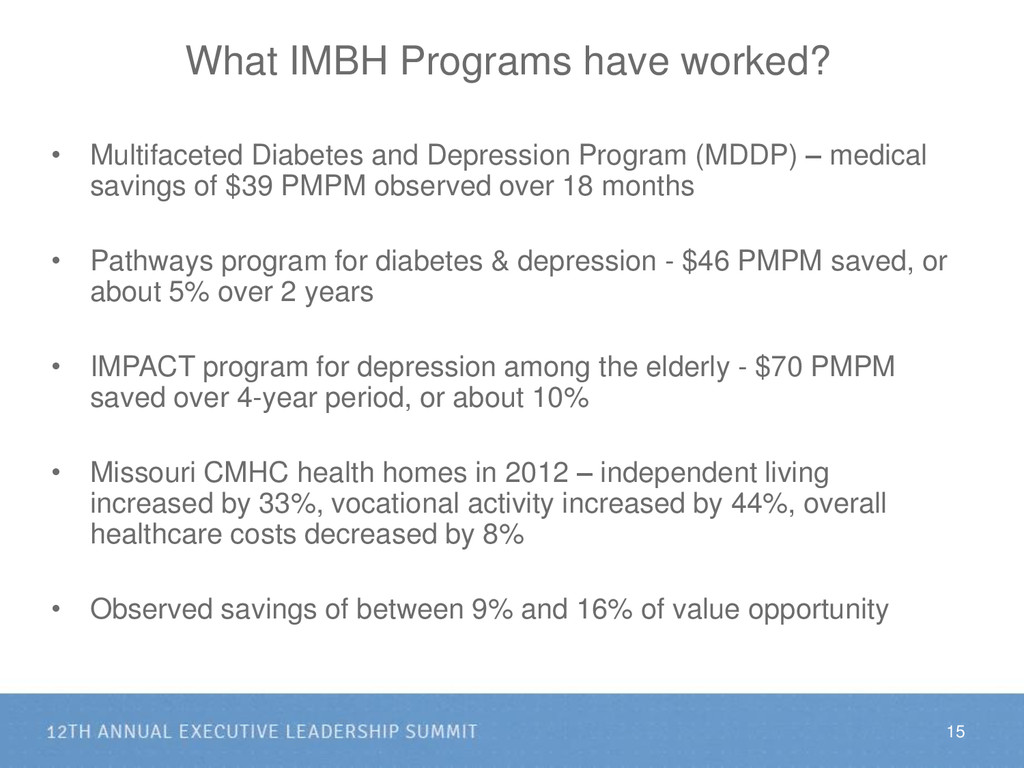
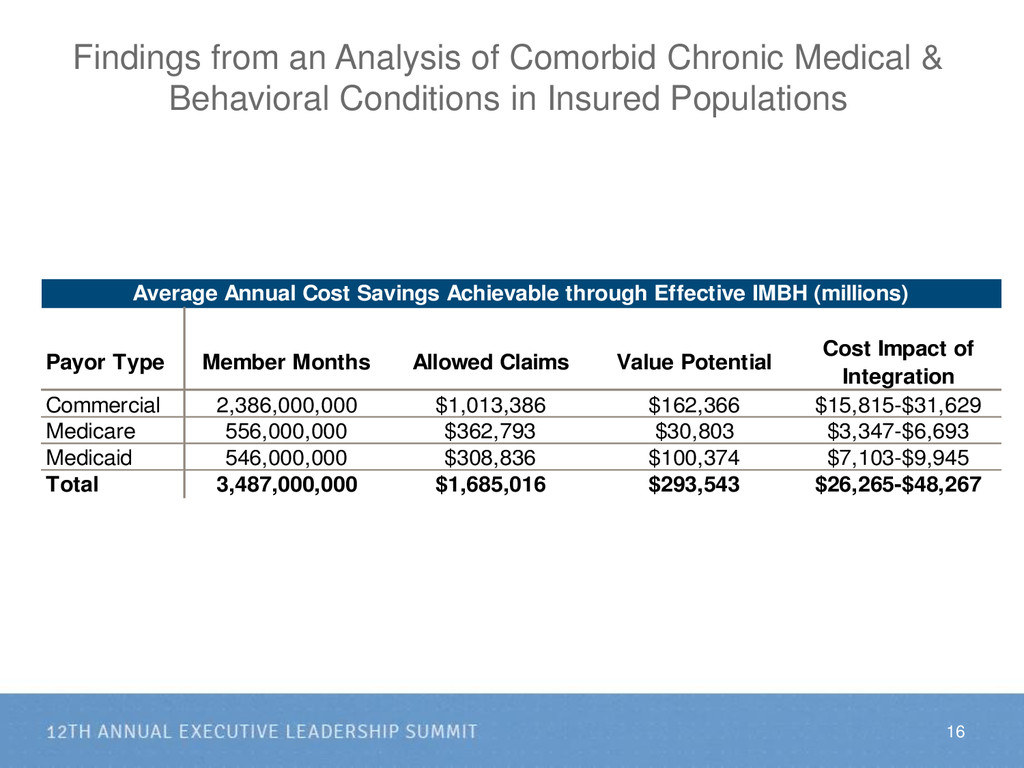
Medical costs for treating insured members with chronic medical and comorbid mental health/substance use disorder (MH/SUD) conditions can be 2-3 times as high as those beneficiaries who don‘t have the comorbid MH/SUD conditions. The additional health care costs incurred by people with behavioral comorbidities were estimated to be $293 billion in 2012 across commercially-insured, Medicaid, and Medicare beneficiaries in the United States. Most of the increased cost for those with comorbid MH/SUD conditions is attributed to medical services (not behavioral services), creating a large opportunity for savings on the medical side through integration of behavioral and medical services. Based on Milliman literature review on the results of effective IMBH programs, we calculate that 9-16% of this total additional spending may be saved through effective integration of care.

Health Integrated

March 26, 2015
Tweet

More Decks by Health Integrated

Transcript

  1. The Quality of Treatment • In spite of effective treatments

    and evidence-based guidelines, only 1 in 5 individuals with depression who seek treatment are treated according to minimum standards (JAMA, 2003). 4
  2. 5

  3. Prevalence of Comorbidities 6 . Unützer, Jürgen. Integrated Behavioral Health

    Care. Powerpoint Presentation. Seattle , Washington. May 2, 2011.
  4. Findings from an Analysis of Comorbid Chronic Medical & Behavioral

    Conditions in Insured Populations • Basis for analysis was detailed claim and membership files for Commercial, Medicare and Medicaid populations • Commercial and Medicare populations were divided into 4 cohorts: 1. No MH/SUD 2. Non-SPMI MH 3. SPMI 4. SUD • Total spending and per member per month (PMPM) costs were separated between Medical, Medical Rx, Behavioral, and Behavioral Rx 8
  5. Findings from an Analysis of Comorbid Chronic Medical & Behavioral

    Conditions in Insured Populations 9 Population Behavioral Health Diagnosis Member Months Medical Behavioral Medical Rx Behavioral Rx Total Commercial No MH/SA 2,048,000,000 $280 $3 $53 $4 $340 Non-SPMI MH 278,000,000 $661 $23 $145 $74 $903 SPMI 47,000,000 $759 $128 $135 $175 $1,197 SA 22,000,000 $830 $73 $102 $67 $1,072 Total 2,386,000,000 $335 $8 $66 $16 $425 Medicare No MH/SA 508,000,000 $579 $3 N/A* N/A* $582 Non-SPMI MH 23,000,000 $1,369 $40 N/A* N/A* $1,409 SPMI 21,000,000 $1,222 $215 N/A* N/A* $1,437 SA 6,000,000 $1,291 $213 N/A* N/A* $1,504 Total 556,000,000 $640 $13 N/A* N/A* $653 Medicaid No MH/SA 437,000,000 $309 $4 $63 $5 $381 MH/SA 109,000,000 $757 $286 $172 $86 $1,301 Total 546,000,000 $398 $61 $85 $21 $565 Total No MH/SA 2,993,000,000 $335 $3 $55 $4 $397 MH/SA 494,000,000 $751 $100 $148 $86 $1,085 Total 3,487,000,000 $394 $17 $69 $17 $497 Per Member Per Month (PMPM) Healthcare Costs by Market Total Spending for Full Population (PMPM, 2012 Allowed Dollars)
  6. Findings from an Analysis of Comorbid Chronic Medical & Behavioral

    Conditions in Insured Populations 10 Population Behavioral Health Diagnosis Medical Behavioral Medical Rx Behavioral Rx Total Commercial No MH/SA $573,171 $5,628 $109,464 $8,833 $697,096 Non-SPMI MH $184,147 $6,502 $40,361 $20,507 $251,517 SPMI $35,408 $5,954 $6,312 $8,167 $55,841 SA $18,227 $1,596 $2,236 $1,473 $23,532 Total $800,317 $18,336 $157,038 $37,695 $1,013,386 Medicare No MH/SA $294,241 $1,619 N/A N/A $295,860 Non-SPMI MH $31,167 $914 N/A N/A $32,081 SPMI $26,142 $4,596 N/A N/A $30,738 SA $8,346 $1,379 N/A N/A $9,725 Total $355,559 $7,234 N/A N/A $362,793 Medicaid No MH/SA $134,920 $1,963 $27,710 $2,176 $166,769 MH/SA $82,655 $31,264 $18,759 $9,389 $142,067 Total $217,575 $33,227 $46,468 $11,566 $308,836 Total No MH/SA $1,002,332 $9,210 $137,173 $11,009 $1,159,724 MH/SA $371,119 $49,587 $66,333 $38,252 $525,291 Total $1,373,451 $58,797 $203,507 $49,261 $1,685,016 (Millions, 2012 Allowed Dollars) Total Spending for Full Population Total Healthcare Costs by Market
  7. Findings from an Analysis of Comorbid Chronic Medical & Behavioral

    Conditions in Insured Populations 11 Condition No MH/SA SPMI Non-SPMI SA Arthritis $814 $2,065 $1,586 $1,827 Asthma $569 $1,851 $1,389 $1,774 Cancer $1,360 $2,525 $2,338 $2,668 Chronic Kidney Disease $4,650 $5,664 $6,232 $6,901 Congestive Heart Failure $1,274 $2,649 $1,955 $2,827 Chronic Obstructive Pulmonary Disease $992 $2,719 $2,088 $2,028 Chronic Pain $1,259 $2,355 $1,780 $2,387 Back Pain $1,624 $3,109 $2,395 $2,705 Headache $1,659 $3,311 $2,221 $3,354 Diabetes (with complications) $1,821 $3,366 $2,681 $3,678 Diabetes (without complications) $811 $1,775 $1,353 $1,848 Hypercholesterolemia (with complications) $1,369 $2,769 $2,061 $2,349 Hypercholesterolemia (without complications) $649 $1,498 $1,065 $1,411 Hypertension (with complications) $1,447 $3,056 $2,220 $2,621 Hypertension (without complications) $688 $1,641 $1,157 $1,494 Ischemic Heart Disease $1,443 $3,006 $2,319 $2,335 Osteoporosis $874 $2,312 $1,592 $1,720 Stroke $1,673 $3,556 $2,590 $2,554 None $221 $762 $528 $615 Any Condition $695 $1,690 $1,271 $1,577 Total $340 $1,197 $903 $1,071 2012 Allowed PMPMs Impact of Co-mobidities (Commercial Population)
  8. Findings from an Analysis of Comorbid Chronic Medical & Behavioral

    Conditions in Insured Populations 12 Condition No MH/SA SPMI Non-SPMI SA Arthritis $1,237 $2,109 $1,852 $2,010 Asthma $1,381 $2,227 $2,051 $2,325 Cancer $1,230 $2,117 $1,826 $2,083 Chronic Kidney Disease $2,677 $3,986 $3,772 $4,581 Congestive Heart Failure $2,230 $3,478 $2,882 $3,713 Chronic Obstructive Pulmonary Disease $1,598 $2,546 $2,335 $2,171 Diabetes (with complications) $1,740 $2,964 $2,755 $3,085 Diabetes (without complications) $811 $1,486 $1,379 $1,719 Hypercholesterolemia (with complications) $1,292 $2,465 $2,119 $2,302 Hypercholesterolemia (without complications) $676 $1,186 $1,043 $1,267 Hypertension (with complications) $1,608 $2,917 $2,438 $2,936 Hypertension (without complications) $822 $1,528 $1,326 $1,642 Ischemic Heart Disease $1,392 $2,659 $2,261 $2,634 Osteoporosis $1,052 $1,882 $1,627 $1,988 Stroke $1,567 $2,809 $2,400 $2,409 None $185 $665 $673 $821 Any Condition $971 $1,701 $1,561 $1,744 Total $582 $1,436 $1,410 $1,504 2012 Allowed PMPMs Impact of Co-mobidities (Medicare Population)
  9. Findings from an Analysis of Comorbid Chronic Medical & Behavioral

    Conditions in Insured Populations 13 Condition No MH/SA MHSA Benign/In Situ/Uncertain Neoplasm $686 $1,580 Cardio-Respiratory Arrest $4,798 $5,134 Cerebro-Vascular $2,052 $3,299 Cognitive Disorders $2,319 $3,552 Diabetes $1,066 $2,368 Ears, Nose, and Throat $488 $1,455 Eyes $587 $1,625 Gastrointestinal $843 $1,932 Genital System $662 $1,538 Heart $1,023 $2,134 Hematological $1,419 $3,003 Liver $1,328 $2,564 Lung $737 $1,912 Malignant Neoplasm $1,913 $3,185 Musculoskeletal and Connective Tissue $693 $1,624 Neurological $1,476 $2,365 Nutritional and Metabolic $815 $1,923 Pregnancy-Related $1,147 $1,669 Skin and Subcutaneous $598 $1,771 Urinary System $1,079 $2,395 Vascular $1,808 $3,375 Total $382 $1,301 2012 Allowed PMPMs Impact of Co-mobidities (Medicaid Population)
  10. Findings from an Analysis of Comorbid Chronic Medical & Behavioral

    Conditions in Insured Populations 14 Medical Condition SPMI Non-SPMI SA Total Arthritis $7,931 $26,567 $3,013 $36,372 Asthma $6,298 $22,770 $2,633 $30,801 Cancer $2,236 $13,100 $1,149 $16,201 Chronic Kidney Disease $267 $2,082 $192 $2,485 Congestive Heart Failure $2,981 $10,166 $1,308 $13,953 Chronic Obstructive Pulmonary Disease $2,369 $7,829 $1,590 $11,428 Chronic Pain $1,007 $3,686 $455 $5,002 Back Pain $1,688 $4,598 $841 $6,894 Headache $231 $398 $119 $683 Diabetes (with complications) $1,745 $6,246 $586 $8,381 Diabetes (without complications) $2,850 $9,982 $798 $13,334 Hypercholesterolemia (with complications) $1,707 $6,106 $720 $8,285 Hypercholesterolemia (without complications) $5,151 $17,842 $1,596 $24,000 Hypertension (with complications) $2,399 $7,905 $1,090 $11,031 Hypertension (without complications) $5,645 $20,161 $2,505 $27,241 Ischemic Heart Disease $1,380 $5,321 $732 $7,208 Osteoporosis $518 $1,602 $90 $2,209 Stroke $632 $1,689 $262 $2,465 None $13,373 $42,270 $4,547 $56,991 Any Condition $21,781 $81,029 $9,188 $105,376 Total $35,154 $123,299 $13,735 $162,366 Annual Value Opportunity (Commercial Population) - Total 2012 Dollars (millions) Note: Results are not additive across conditions due to insureds with multiple conditions
  11. What IMBH Programs have worked? • Multifaceted Diabetes and Depression

    Program (MDDP) – medical savings of $39 PMPM observed over 18 months • Pathways program for diabetes & depression - $46 PMPM saved, or about 5% over 2 years • IMPACT program for depression among the elderly - $70 PMPM saved over 4-year period, or about 10% • Missouri CMHC health homes in 2012 – independent living increased by 33%, vocational activity increased by 44%, overall healthcare costs decreased by 8% • Observed savings of between 9% and 16% of value opportunity 15
  12. Findings from an Analysis of Comorbid Chronic Medical & Behavioral

    Conditions in Insured Populations 16 Payor Type Member Months Allowed Claims Value Potential Cost Impact of Integration Commercial 2,386,000,000 $1,013,386 $162,366 $15,815-$31,629 Medicare 556,000,000 $362,793 $30,803 $3,347-$6,693 Medicaid 546,000,000 $308,836 $100,374 $7,103-$9,945 Total 3,487,000,000 $1,685,016 $293,543 $26,265-$48,267 Average Annual Cost Savings Achievable through Effective IMBH (millions)
  13. Payment Model Reform Ideas • Primary Care Capitation, including primary

    physical and behavioral healthcare services, and also care coordination/management • Cap rates must be population-specific and risk adjusted • Options in Cap Rate for the addition of different levels of behavioral service responsibilities • Risk Sharing or Gain Sharing of non-primary care services • Requires setting risk adjusted targets PMPM for different member populations (commercial, Medicaid, Medicare) for IP facility, OP facility, other physician specialists, Rx and all other services. 17