Upgrade to Pro — share decks privately, control downloads, hide ads and more …

Monitoring Kubernetes with Prometheus

Sponsored · Your Podcast. Everywhere. Effortlessly. Share. Educate. Inspire. Entertain. You do you. We'll handle the rest. →
Avatar for Henri DF Henri DF
November 06, 2018

Monitoring Kubernetes with Prometheus

Presented at Percona Live Europe (Frankfurt) in November 2018.

Avatar for Henri DF

Henri DF

November 06, 2018

Other Decks in Technology

Transcript

  1. Hello. Henri Dubois-Ferriere Technical Director, Sysdig Doing “observability” for many

    many years, from network to web apps via many startups. PhD in CS from EPFL Repatriate from San Francisco to Switzerland
  2. Monitor why? • Know about outages before users tell me

    • Understand my production environment (or try…) • Plan/trend/forecast
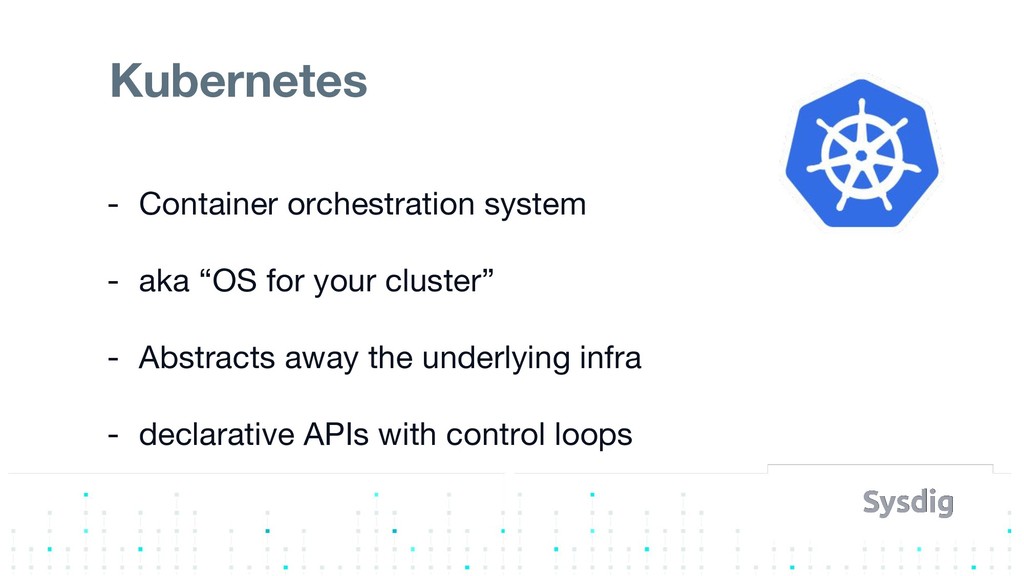
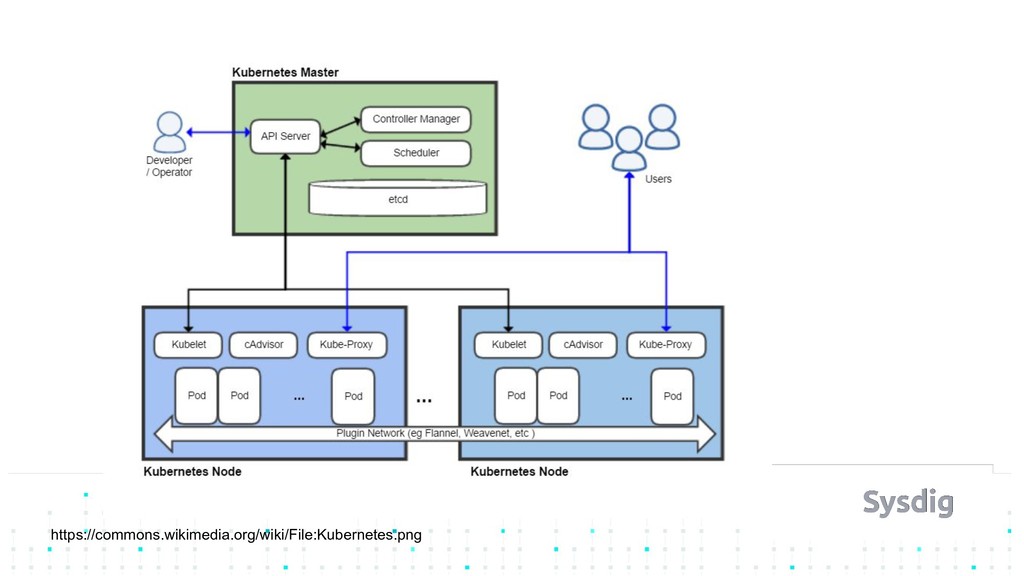
  3. Kubernetes - Container orchestration system - aka “OS for your

    cluster” - Abstracts away the underlying infra - declarative APIs with control loops
  4. Prometheus ❏ Started at SoundCloud in 2012 ❏ Motivated by

    challenges with monitoring dynamic environments ❏ Made public 2015, now second CNCF “graduate”
  5. It’s all about the pull - Prom scrapes targets to

    get metrics - Nice side effect: know when target down - Needs to know what to scrape
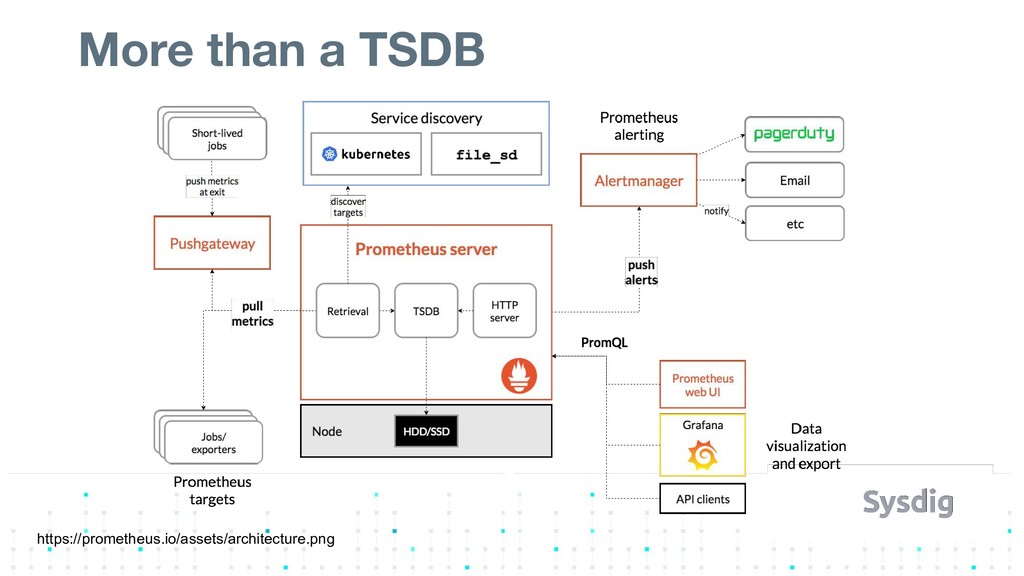
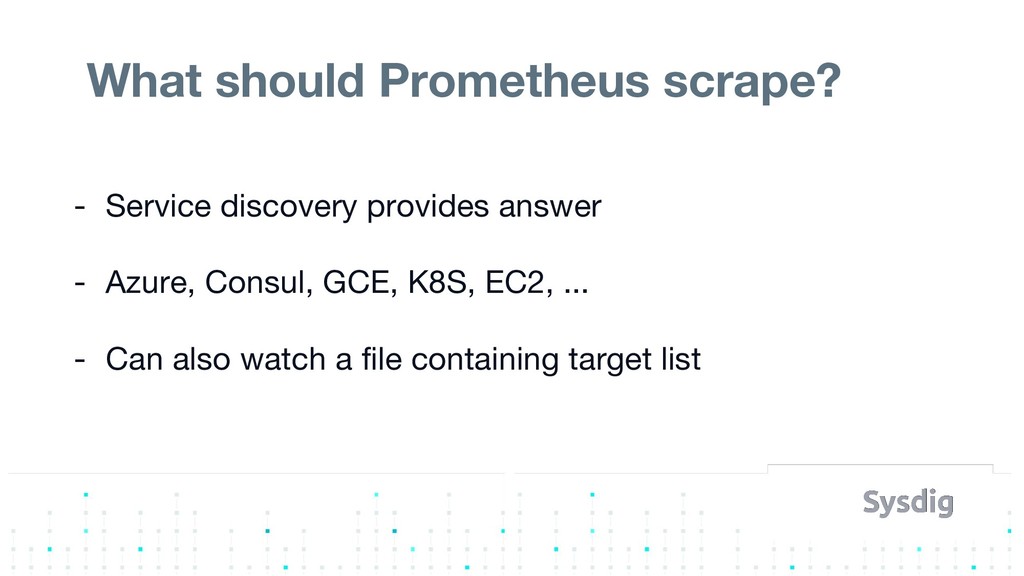
  6. What should Prometheus scrape? - Service discovery provides answer -

    Azure, Consul, GCE, K8S, EC2, ... - Can also watch a file containing target list
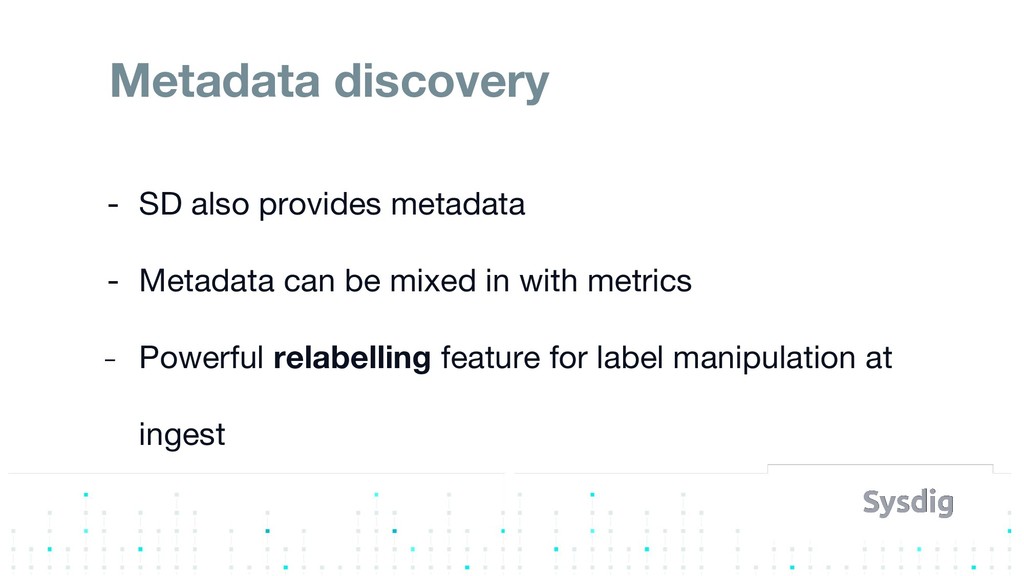
  7. Metadata discovery - SD also provides metadata - Metadata can

    be mixed in with metrics - Powerful relabelling feature for label manipulation at ingest
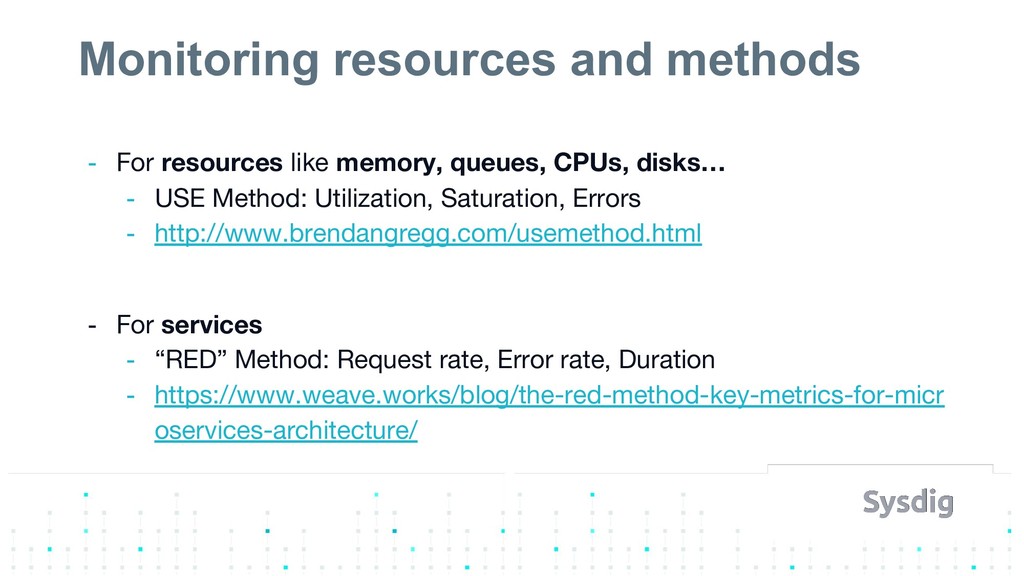
  8. Monitoring resources and methods - For resources like memory, queues,

    CPUs, disks… - USE Method: Utilization, Saturation, Errors - http://www.brendangregg.com/usemethod.html - For services - “RED” Method: Request rate, Error rate, Duration - https://www.weave.works/blog/the-red-method-key-metrics-for-micr oservices-architecture/
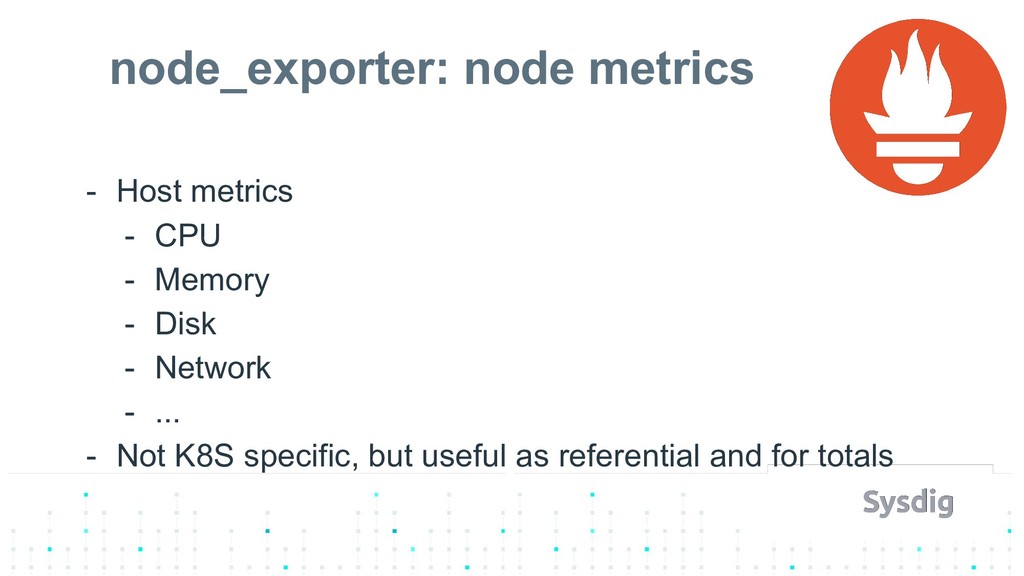
  9. - Host metrics - CPU - Memory - Disk -

    Network - ... - Not K8S specific, but useful as referential and for totals node_exporter: node metrics
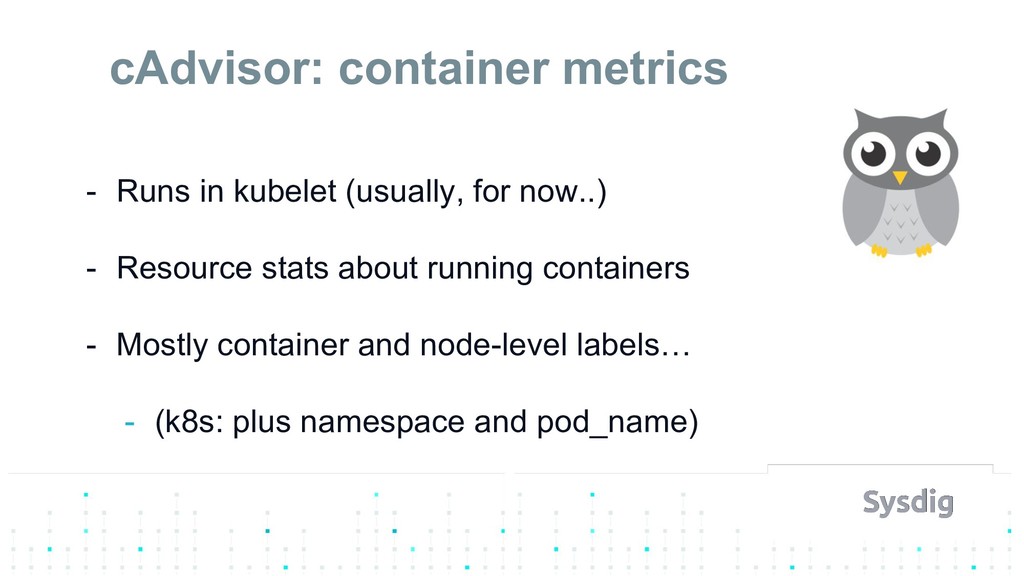
  10. - Runs in kubelet (usually, for now..) - Resource stats

    about running containers - Mostly container and node-level labels… - (k8s: plus namespace and pod_name) cAdvisor: container metrics
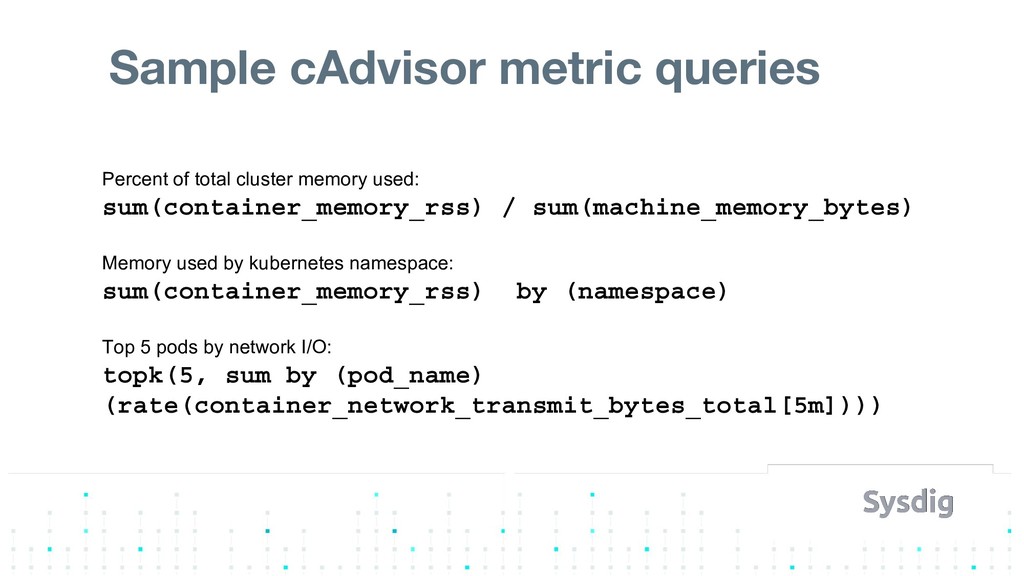
  11. Sample cAdvisor metric queries Percent of total cluster memory used:

    sum(container_memory_rss) / sum(machine_memory_bytes) Memory used by kubernetes namespace: sum(container_memory_rss) by (namespace) Top 5 pods by network I/O: topk(5, sum by (pod_name) (rate(container_network_transmit_bytes_total[5m])))
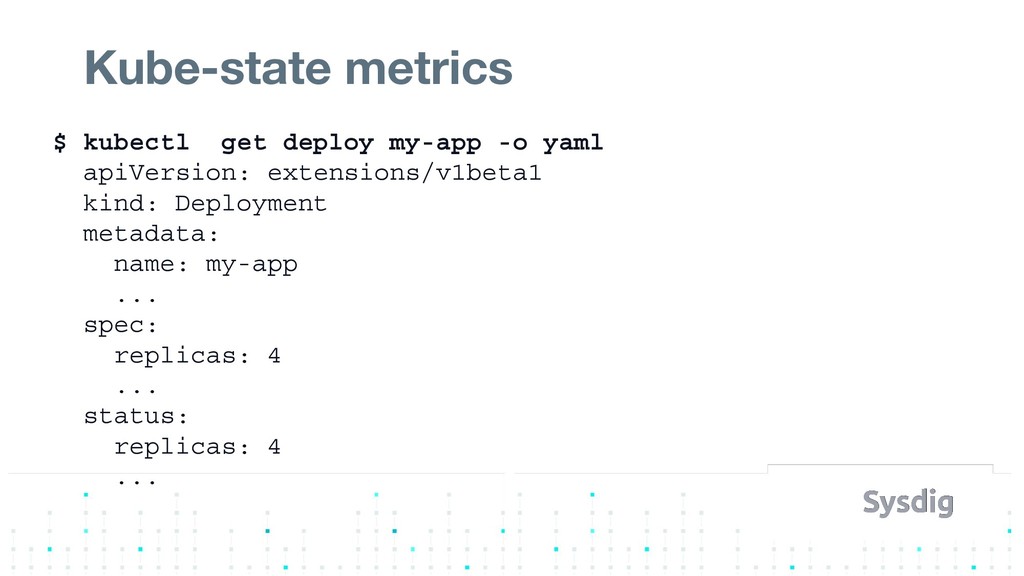
  12. $ kubectl get deploy my-app -o yaml apiVersion: extensions/v1beta1 kind:

    Deployment metadata: name: my-app ... spec: replicas: 4 ... status: replicas: 4 ... Kube-state metrics
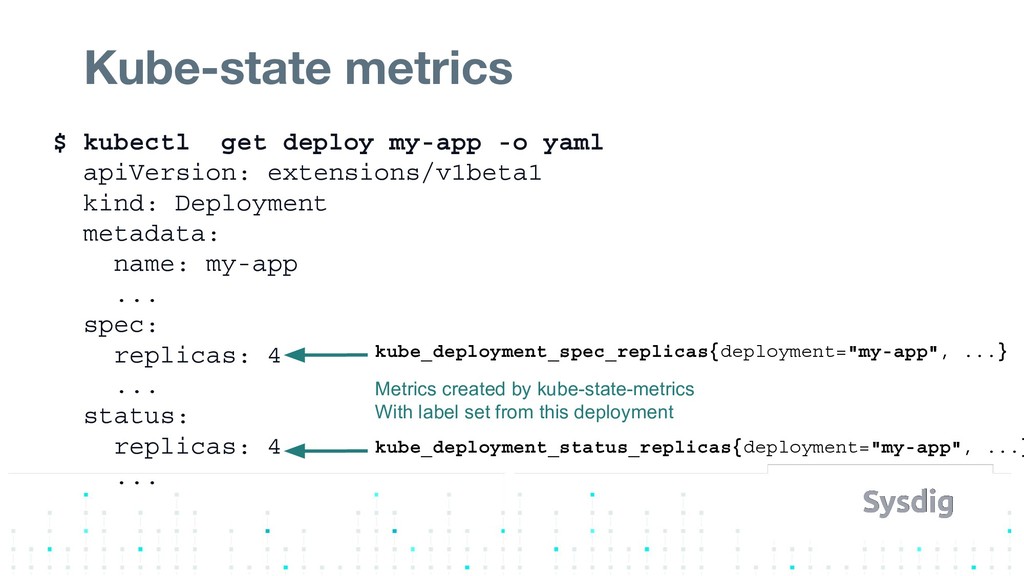
  13. $ kubectl get deploy my-app -o yaml apiVersion: extensions/v1beta1 kind:

    Deployment metadata: name: my-app ... spec: replicas: 4 ... status: replicas: 4 ... Kube-state metrics kube_deployment_spec_replicas{deployment="my-app", ...} Metrics created by kube-state-metrics With label set from this deployment kube_deployment_status_replicas{deployment="my-app", ...}
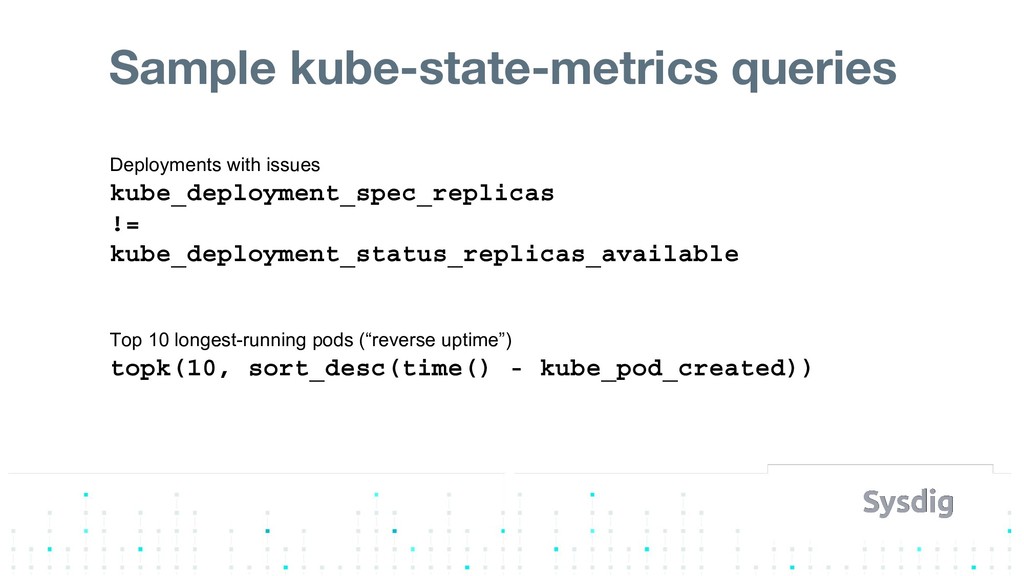
  14. Sample kube-state-metrics queries Deployments with issues kube_deployment_spec_replicas != kube_deployment_status_replicas_available Top

    10 longest-running pods (“reverse uptime”) topk(10, sort_desc(time() - kube_pod_created))
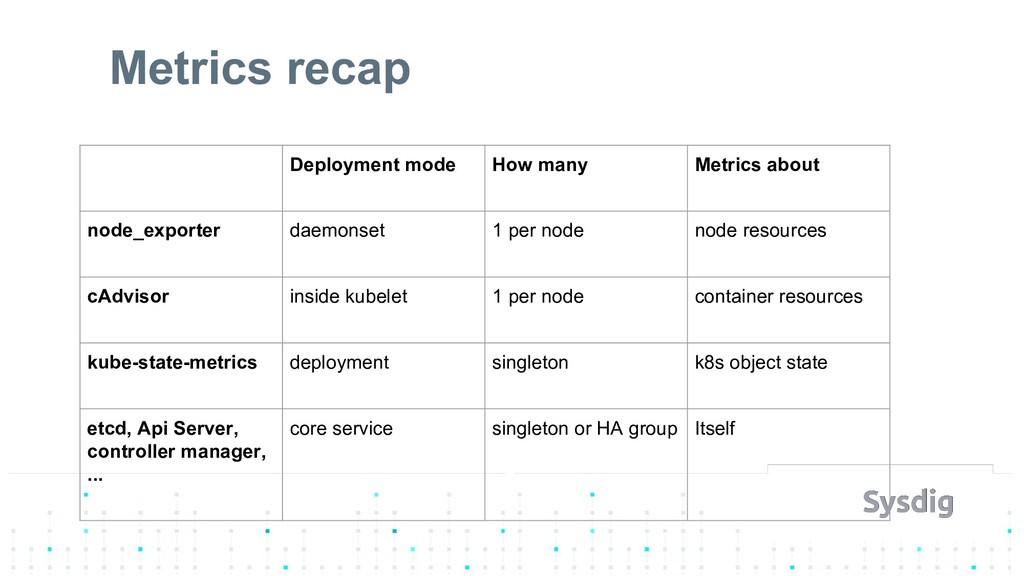
  15. Metrics recap Deployment mode How many Metrics about node_exporter daemonset

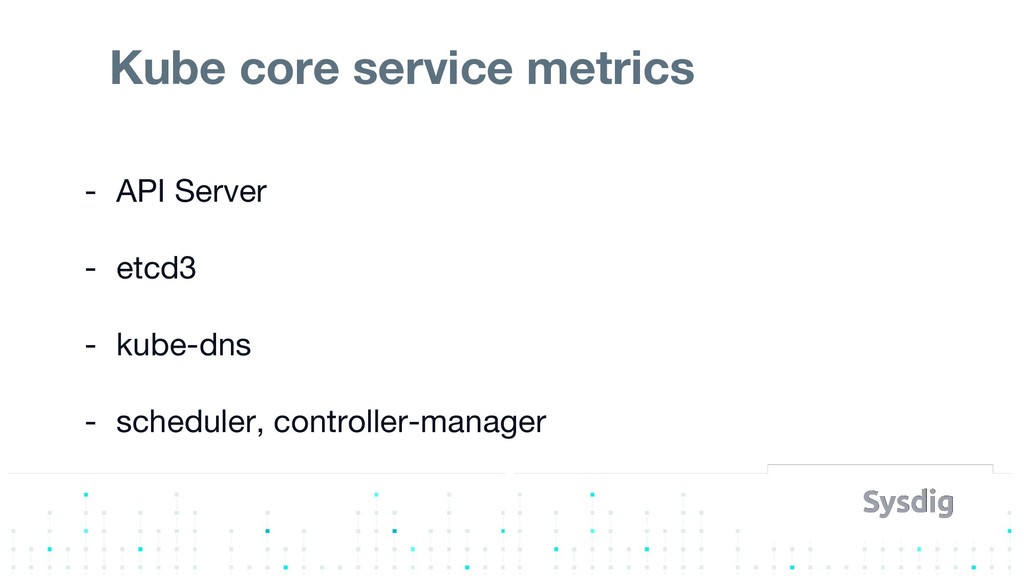
    1 per node node resources cAdvisor inside kubelet 1 per node container resources kube-state-metrics deployment singleton k8s object state etcd, Api Server, controller manager, ... core service singleton or HA group Itself
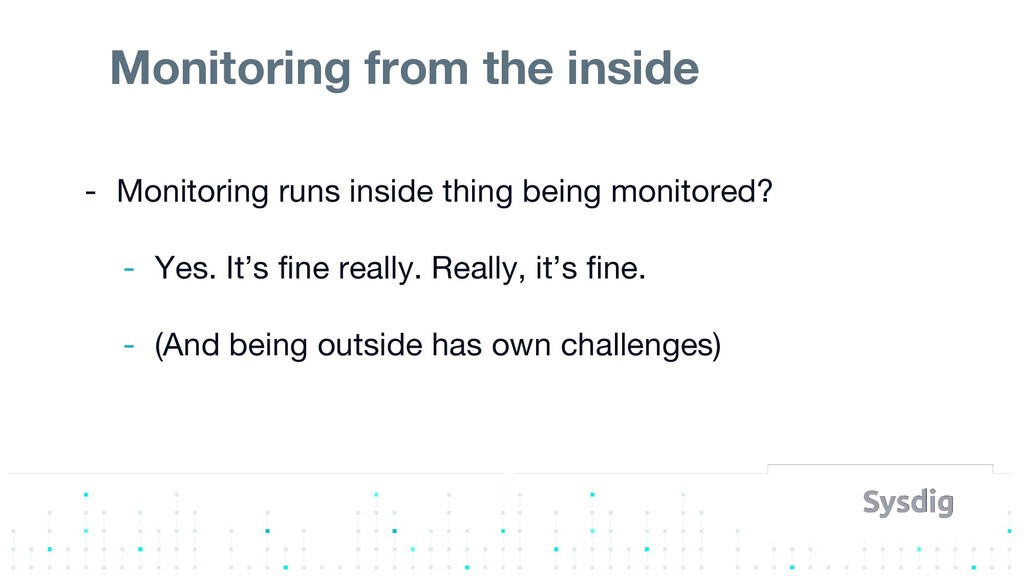
  16. - Monitoring runs inside thing being monitored? - Yes. It’s

    fine really. Really, it’s fine. - (And being outside has own challenges) Monitoring from the inside
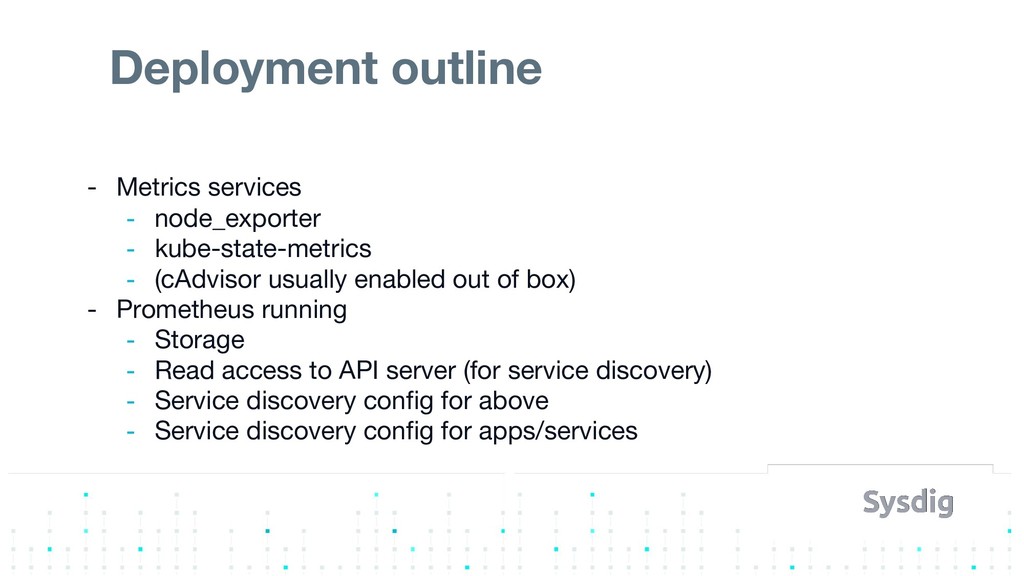
  17. - Metrics services - node_exporter - kube-state-metrics - (cAdvisor usually

    enabled out of box) - Prometheus running - Storage - Read access to API server (for service discovery) - Service discovery config for above - Service discovery config for apps/services Deployment outline
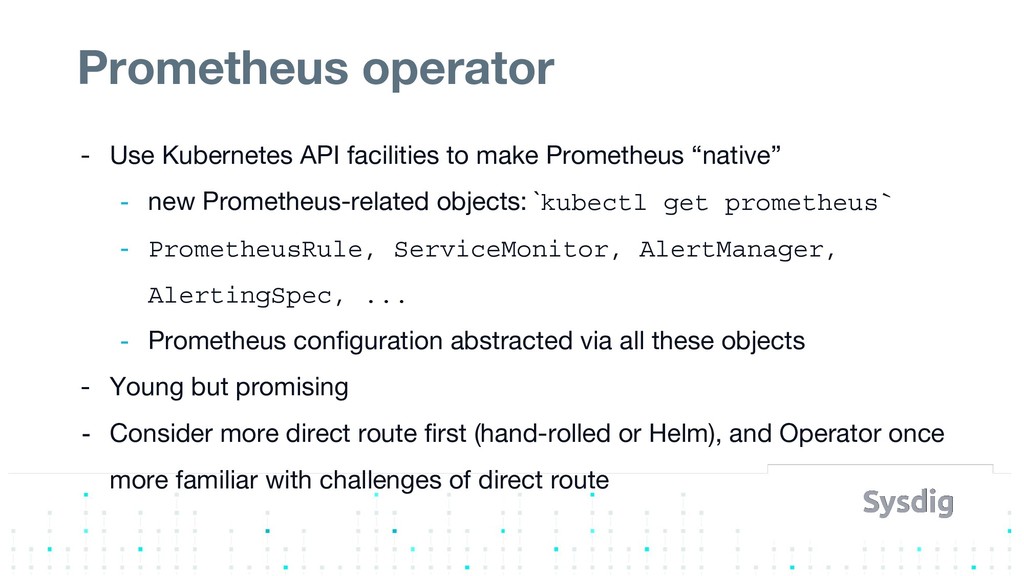
  18. Prometheus operator - Use Kubernetes API facilities to make Prometheus

    “native” - new Prometheus-related objects: `kubectl get prometheus` - PrometheusRule, ServiceMonitor, AlertManager, AlertingSpec, ... - Prometheus configuration abstracted via all these objects - Young but promising - Consider more direct route first (hand-rolled or Helm), and Operator once more familiar with challenges of direct route
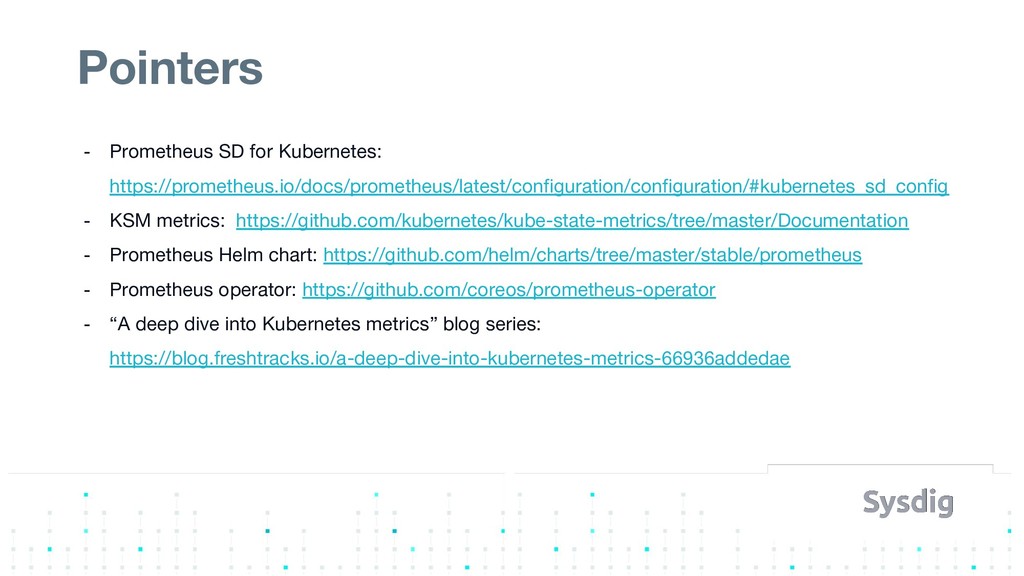
  19. Pointers - Prometheus SD for Kubernetes: https://prometheus.io/docs/prometheus/latest/configuration/configuration/#kubernetes_sd_config - KSM metrics:

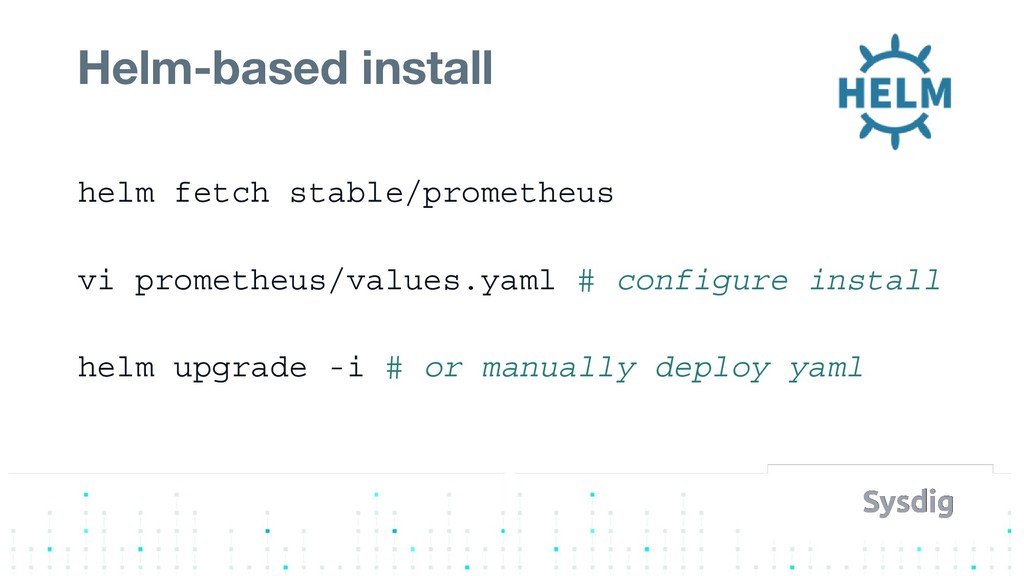
    https://github.com/kubernetes/kube-state-metrics/tree/master/Documentation - Prometheus Helm chart: https://github.com/helm/charts/tree/master/stable/prometheus - Prometheus operator: https://github.com/coreos/prometheus-operator - “A deep dive into Kubernetes metrics” blog series: https://blog.freshtracks.io/a-deep-dive-into-kubernetes-metrics-66936addedae