Agent • Time series data (metrics and events) and traces • Processing trillions of data points per day • Intelligent Alerting • We’re hiring! (www.datadoghq.com/careers/) Datadog Overview
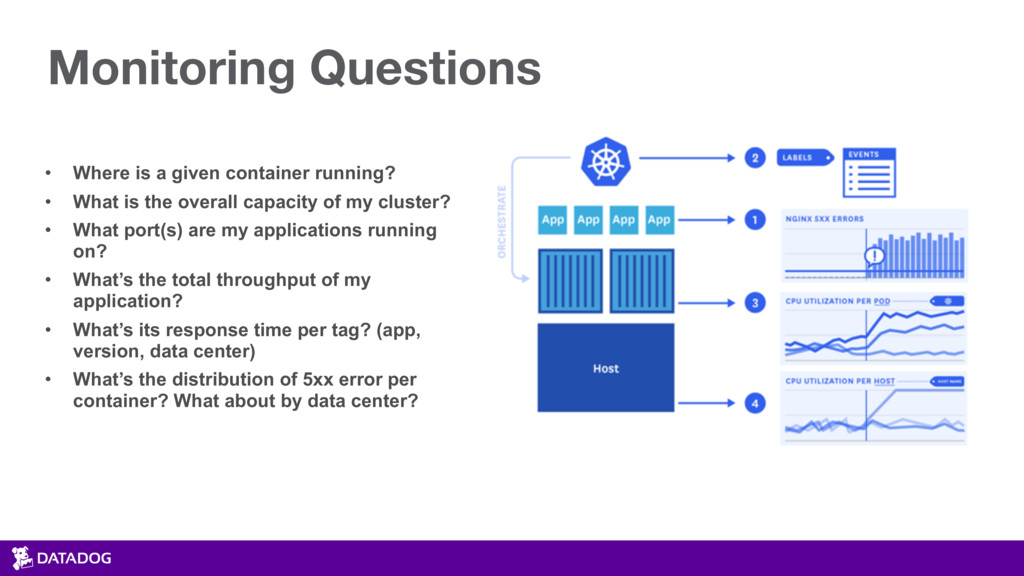
is the capacity of my cluster? • What port is my app running on? • What’s the total throughput of my app? • What’s its response time per tag? (app, version, region) • What’s the distribution of 5xx error per container?
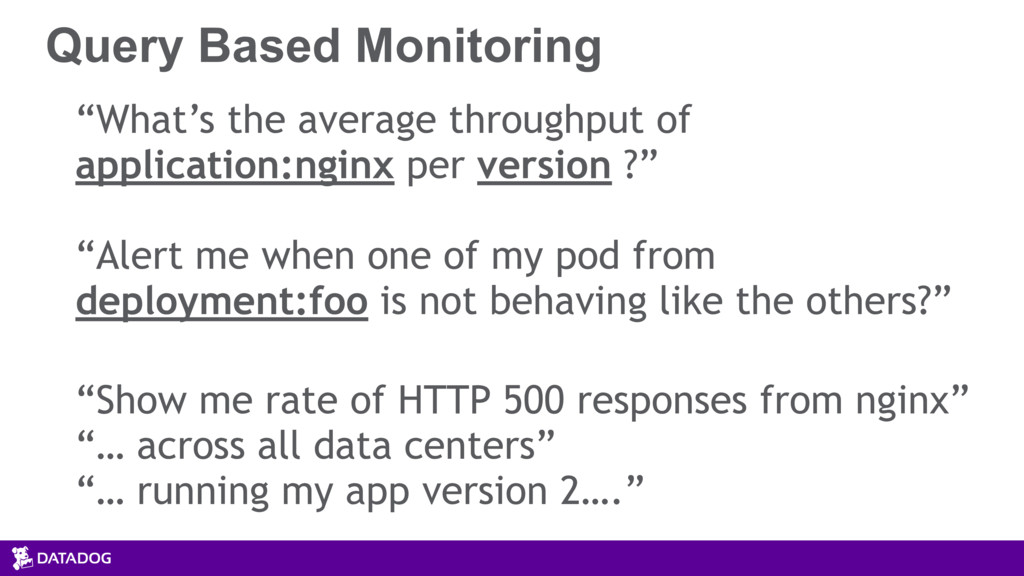
version ?” “Alert me when one of my pod from deployment:foo is not behaving like the others?” “Show me rate of HTTP 500 responses from nginx” “… across all data centers” “… running my app version 2….”
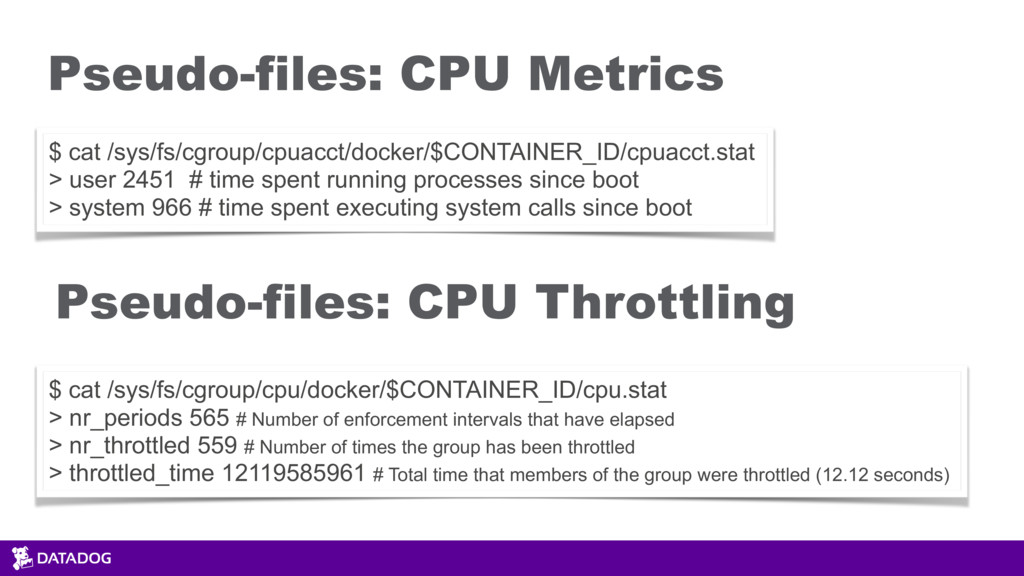
time spent running processes since boot > system 966 # time spent executing system calls since boot $ cat /sys/fs/cgroup/cpu/docker/$CONTAINER_ID/cpu.stat > nr_periods 565 # Number of enforcement intervals that have elapsed > nr_throttled 559 # Number of times the group has been throttled > throttled_time 12119585961 # Total time that members of the group were throttled (12.12 seconds) Pseudo-files: CPU Throttling
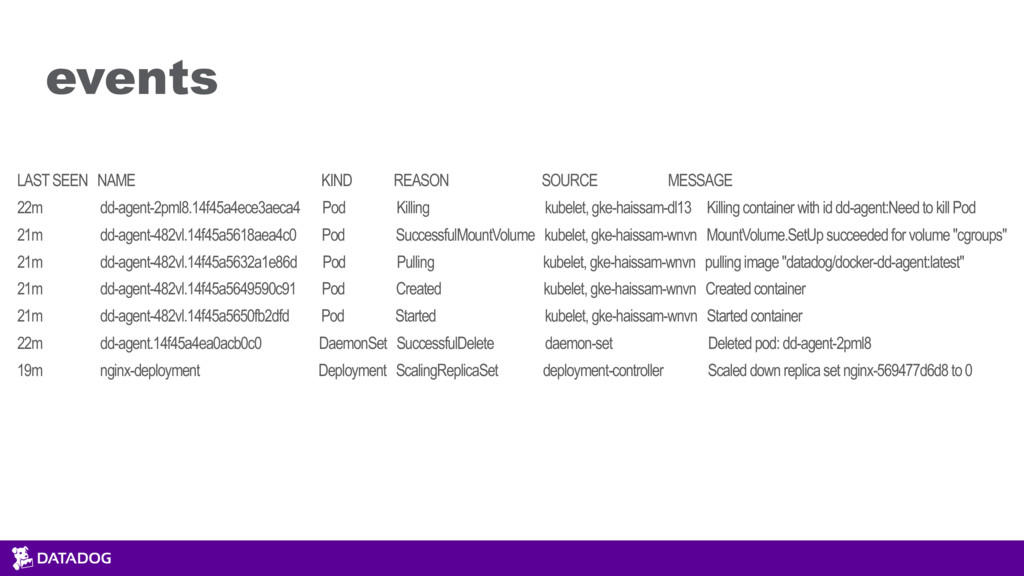
Killing kubelet, gke-haissam-dl13 Killing container with id dd-agent:Need to kill Pod 21m dd-agent-482vl.14f45a5618aea4c0 Pod SuccessfulMountVolume kubelet, gke-haissam-wnvn MountVolume.SetUp succeeded for volume "cgroups" 21m dd-agent-482vl.14f45a5632a1e86d Pod Pulling kubelet, gke-haissam-wnvn pulling image "datadog/docker-dd-agent:latest" 21m dd-agent-482vl.14f45a5649590c91 Pod Created kubelet, gke-haissam-wnvn Created container 21m dd-agent-482vl.14f45a5650fb2dfd Pod Started kubelet, gke-haissam-wnvn Started container 22m dd-agent.14f45a4ea0acb0c0 DaemonSet SuccessfulDelete daemon-set Deleted pod: dd-agent-2pml8 19m nginx-deployment Deployment ScalingReplicaSet deployment-controller Scaled down replica set nginx-569477d6d8 to 0 events
What is the overall capacity of my cluster? • What port(s) are my applications running on? • What’s the total throughput of my application? • What’s its response time per tag? (app, version, data center) • What’s the distribution of 5xx error per container? What about by data center?
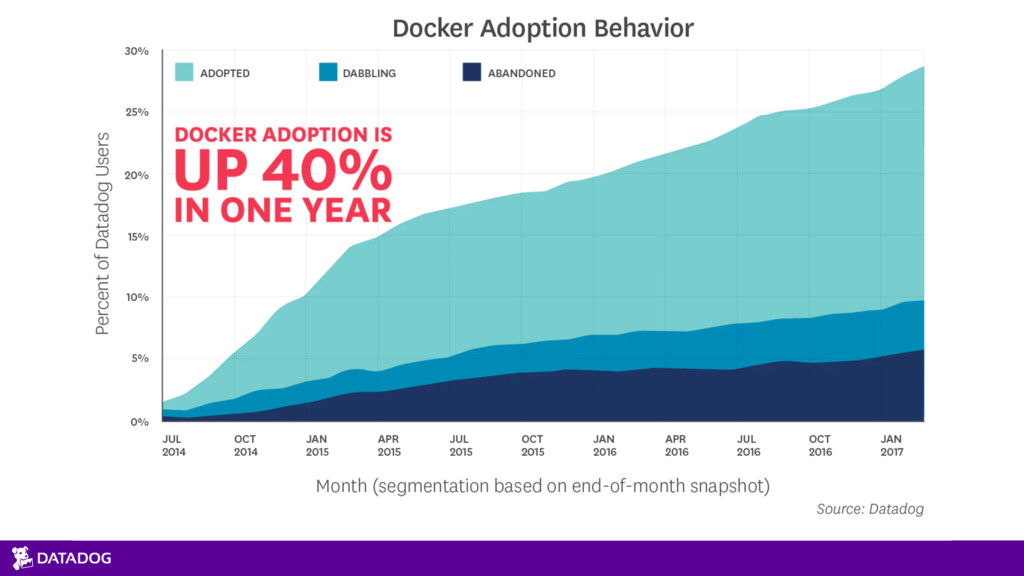
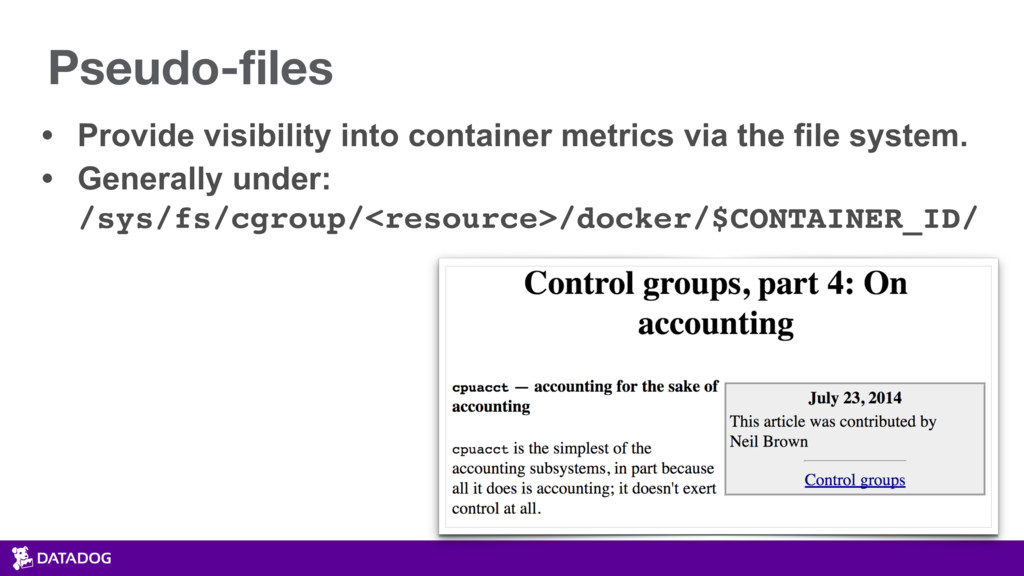
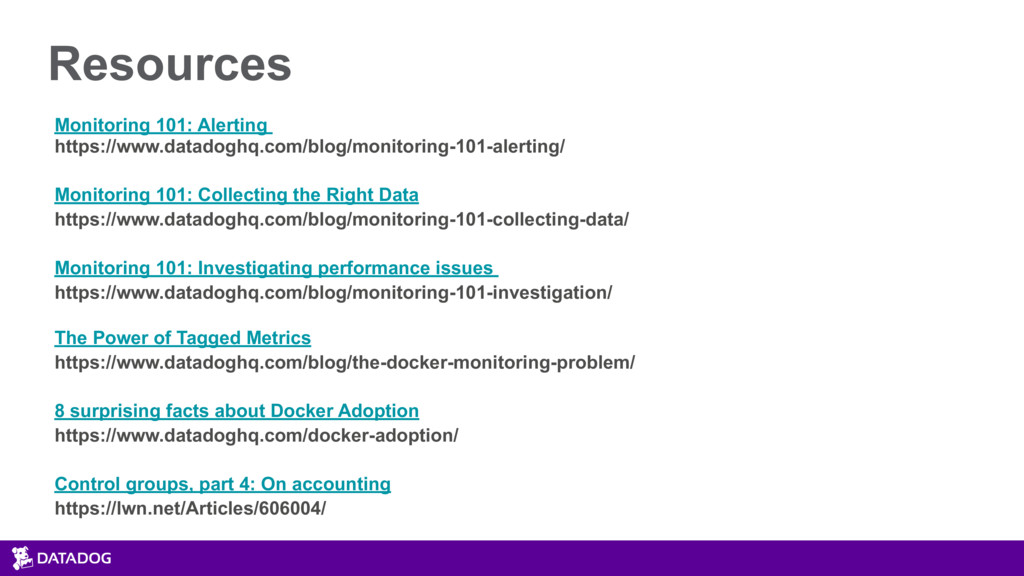
Right Data https://www.datadoghq.com/blog/monitoring-101-collecting-data/ Monitoring 101: Investigating performance issues https://www.datadoghq.com/blog/monitoring-101-investigation/ The Power of Tagged Metrics https://www.datadoghq.com/blog/the-docker-monitoring-problem/ 8 surprising facts about Docker Adoption https://www.datadoghq.com/docker-adoption/ Control groups, part 4: On accounting https://lwn.net/Articles/606004/
![Haïssam Kaj • [email protected] • @ha_kaj • Team lead, container](https://files.speakerdeck.com/presentations/8682692f258645a7993ab6704973f1a2/slide_1.jpg)
![STATS Command # Usage: docker stats CONTAINER [CONTAINER...] $ docker](https://files.speakerdeck.com/presentations/8682692f258645a7993ab6704973f1a2/slide_49.jpg)
![Q&A more questions? [email protected] @ha_kaj](https://files.speakerdeck.com/presentations/8682692f258645a7993ab6704973f1a2/slide_64.jpg)