biological function. Thus the abundance of fragments ought to correlate with the activity level of the function. There are ongoing debates on the range of validity of each approach. We "force" the biological function to produce DNA fragments that we can sequence.
SOMETHING-Seq Examples: ChIP-Seq, RNA-Seq, RAD-Seq Usually work by making an known biological mechanism to produce DNA fragments of some known properties.
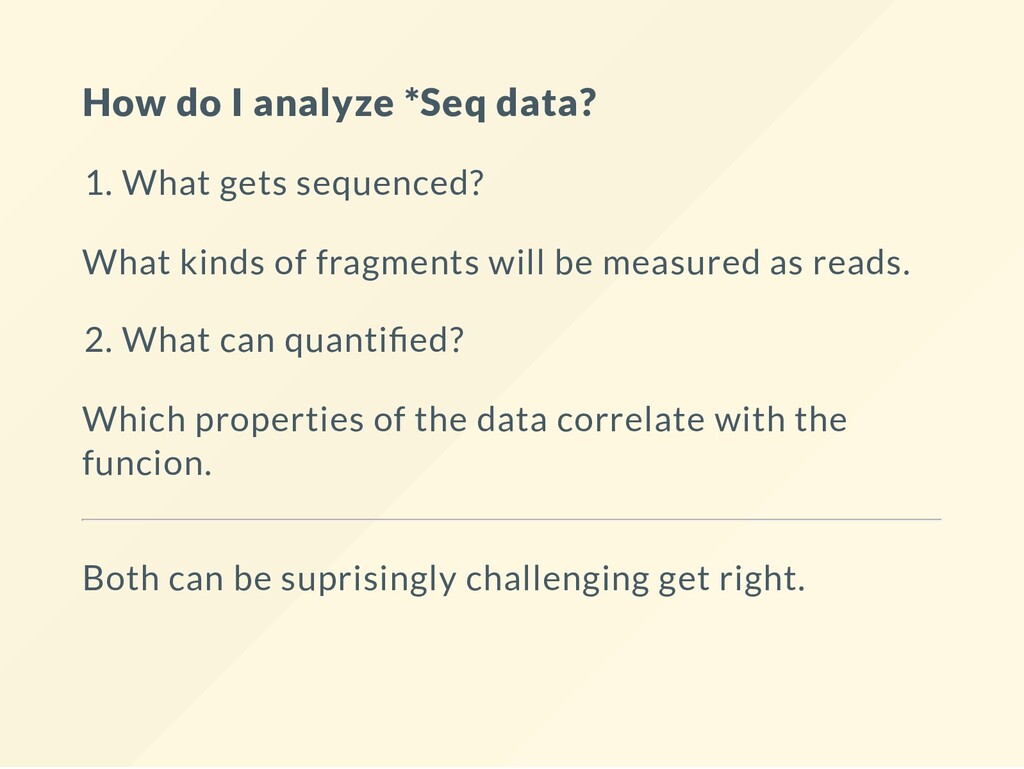
What kinds of fragments will be measured as reads. 2. What can quanti ed? Which properties of the data correlate with the funcion. Both can be suprisingly challenging get right.
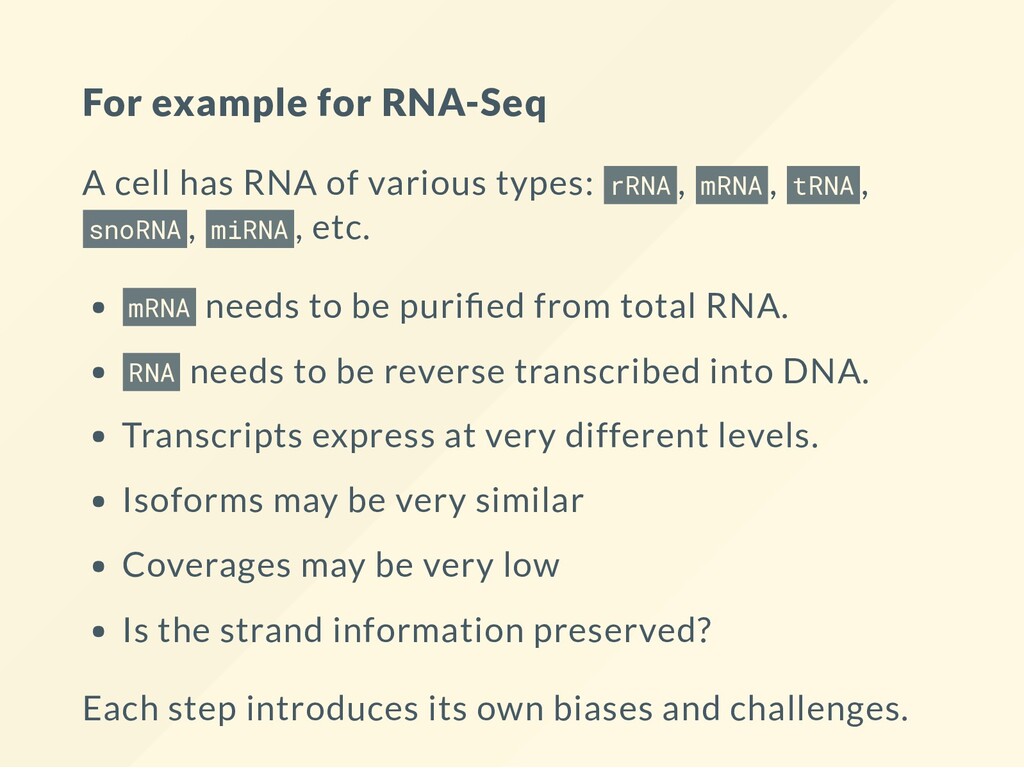
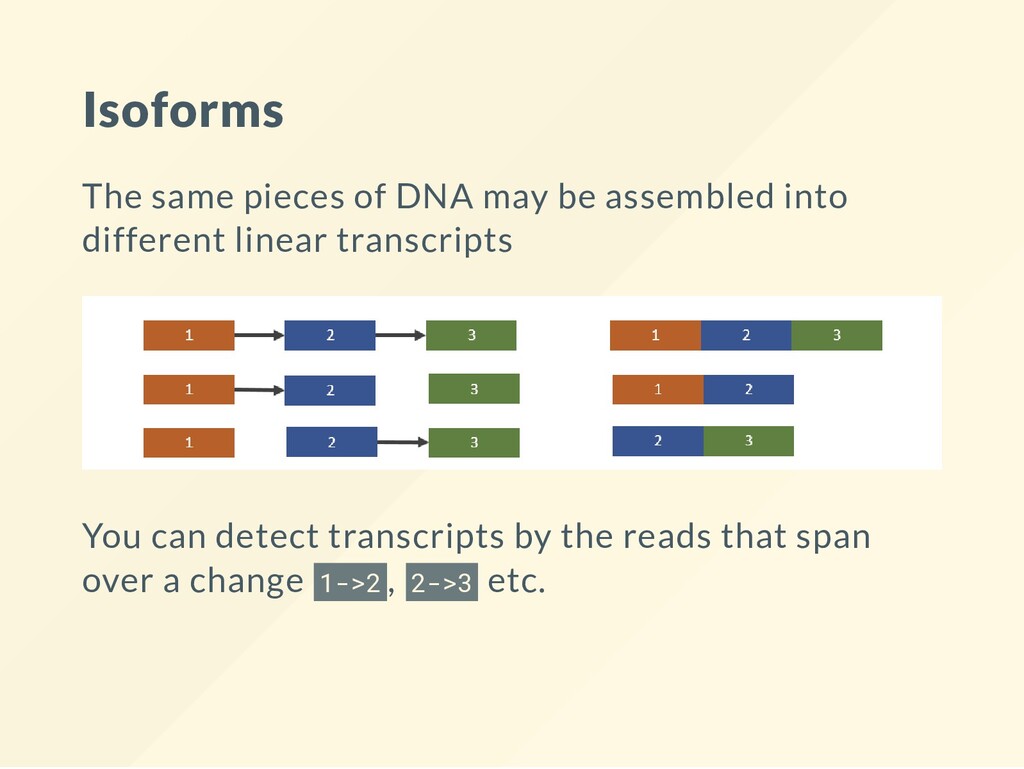
types: rRNA , mRNA , tRNA , snoRNA , miRNA , etc. mRNA needs to be puri ed from total RNA. RNA needs to be reverse transcribed into DNA. Transcripts express at very different levels. Isoforms may be very similar Coverages may be very low Is the strand information preserved? Each step introduces its own biases and challenges.
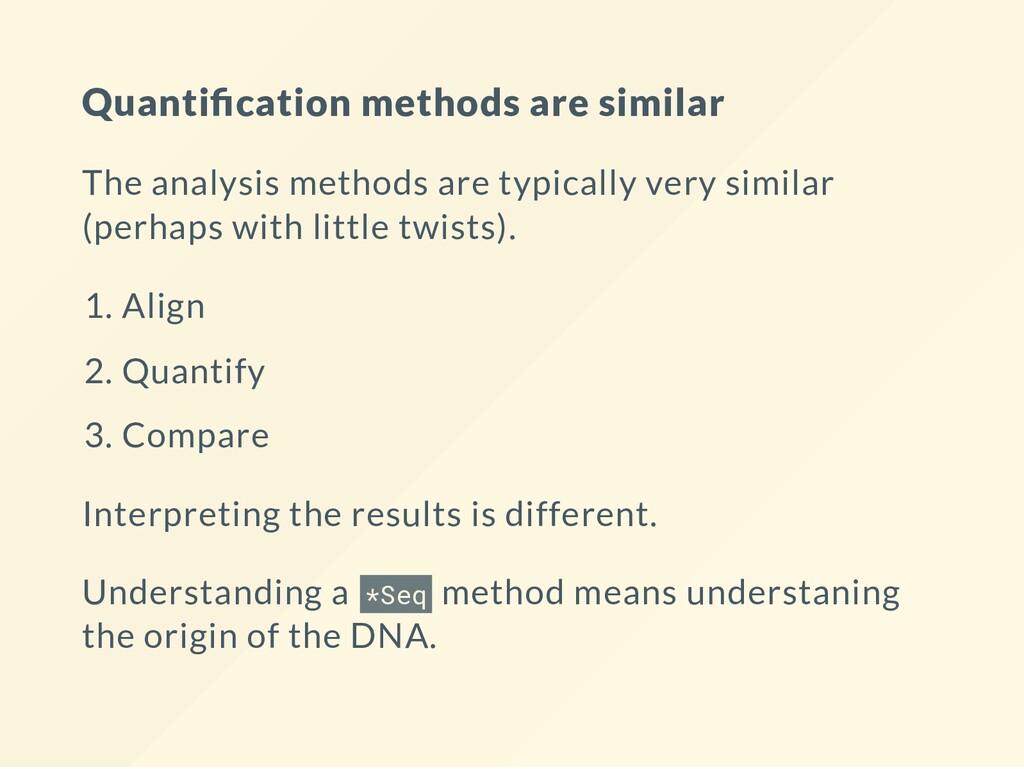
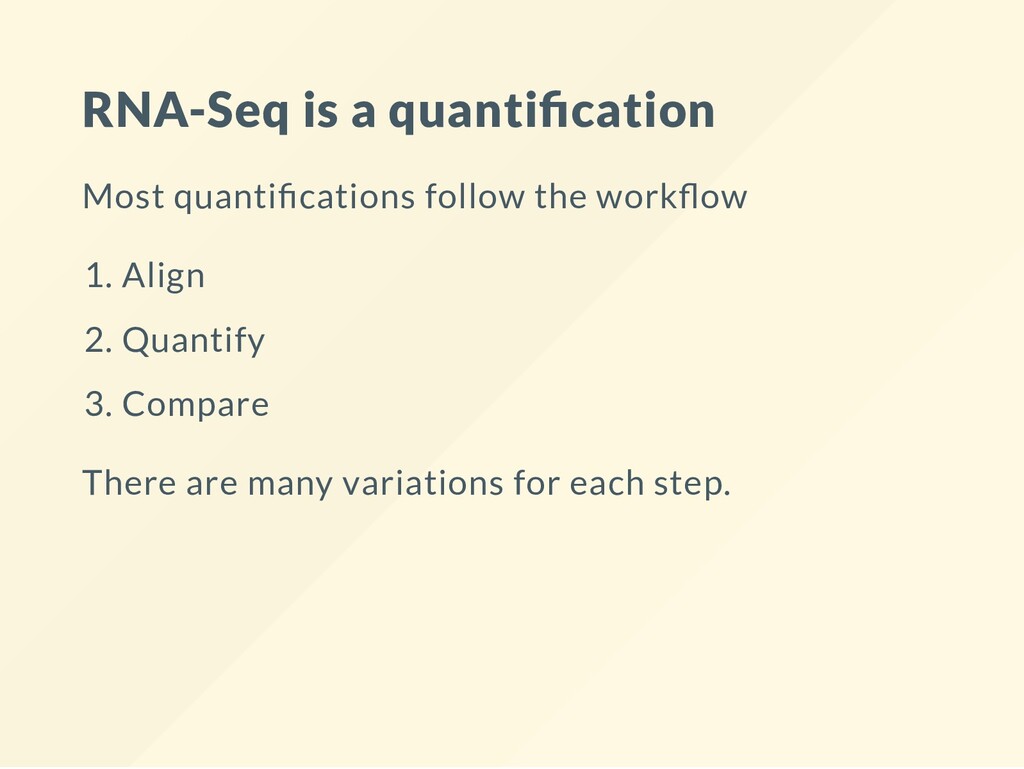
very similar (perhaps with little twists). 1. Align 2. Quantify 3. Compare Interpreting the results is different. Understanding a *Seq method means understaning the origin of the DNA.
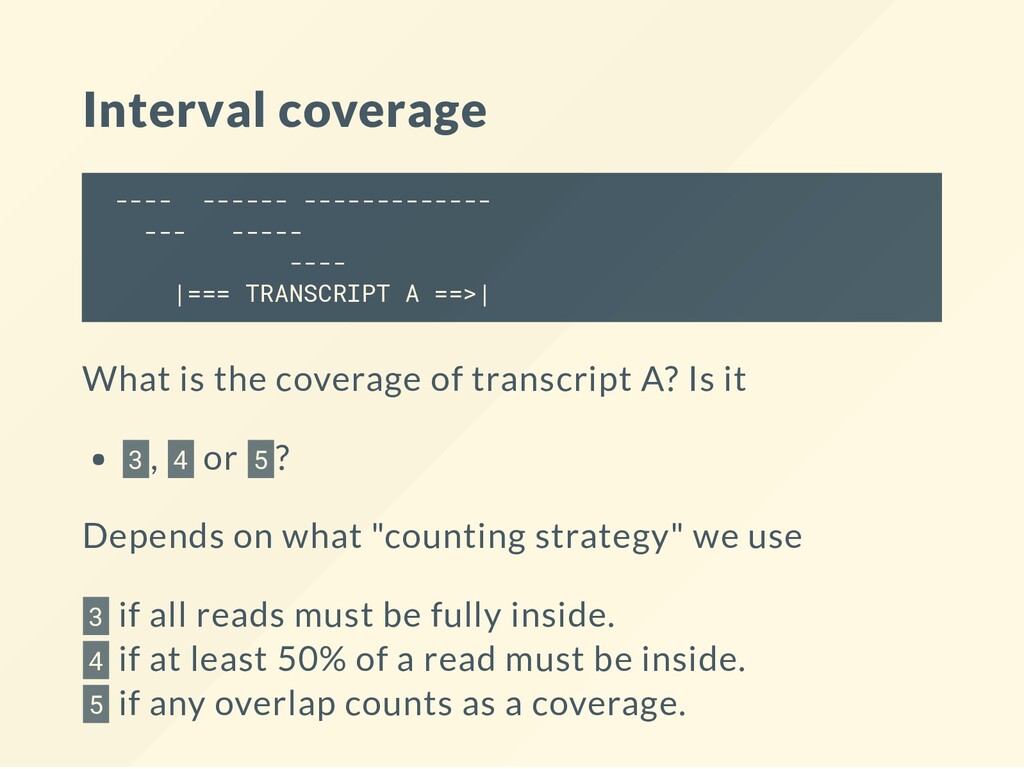
A ==>| What is the coverage of transcript A? Is it 3 , 4 or 5 ? Depends on what "counting strategy" we use 3 if all reads must be fully inside. 4 if at least 50% of a read must be inside. 5 if any overlap counts as a coverage.
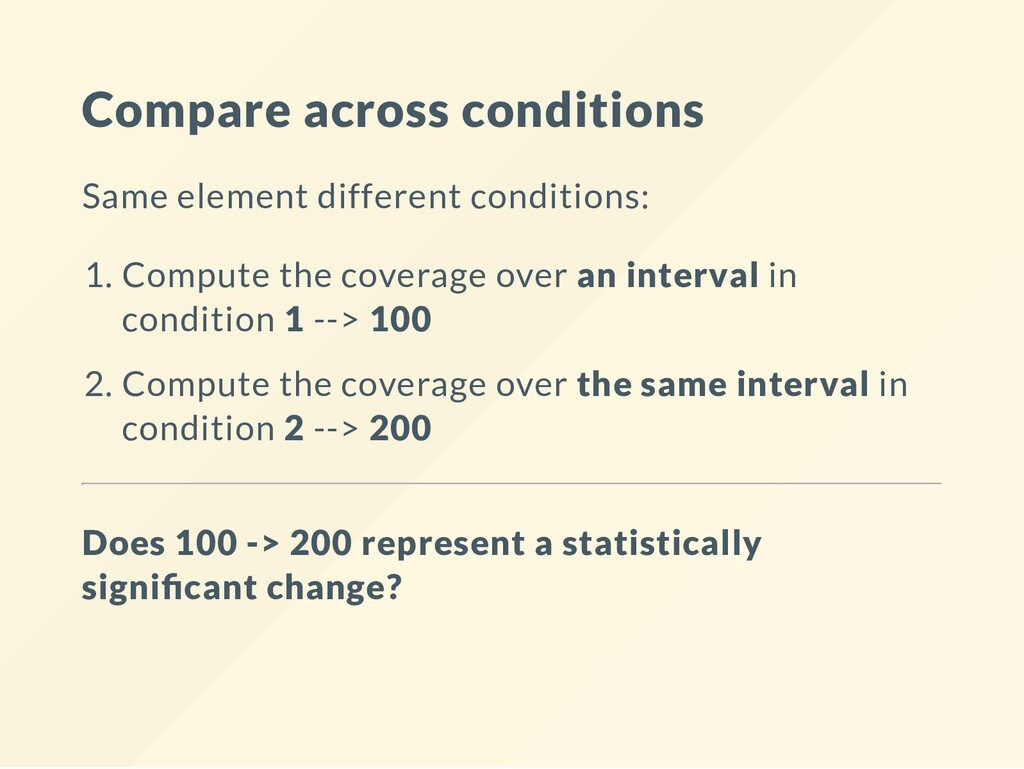
coverage over an interval in condition 1 --> 100 2. Compute the coverage over the same interval in condition 2 --> 200 Does 100 -> 200 represent a statistically signi cant change?
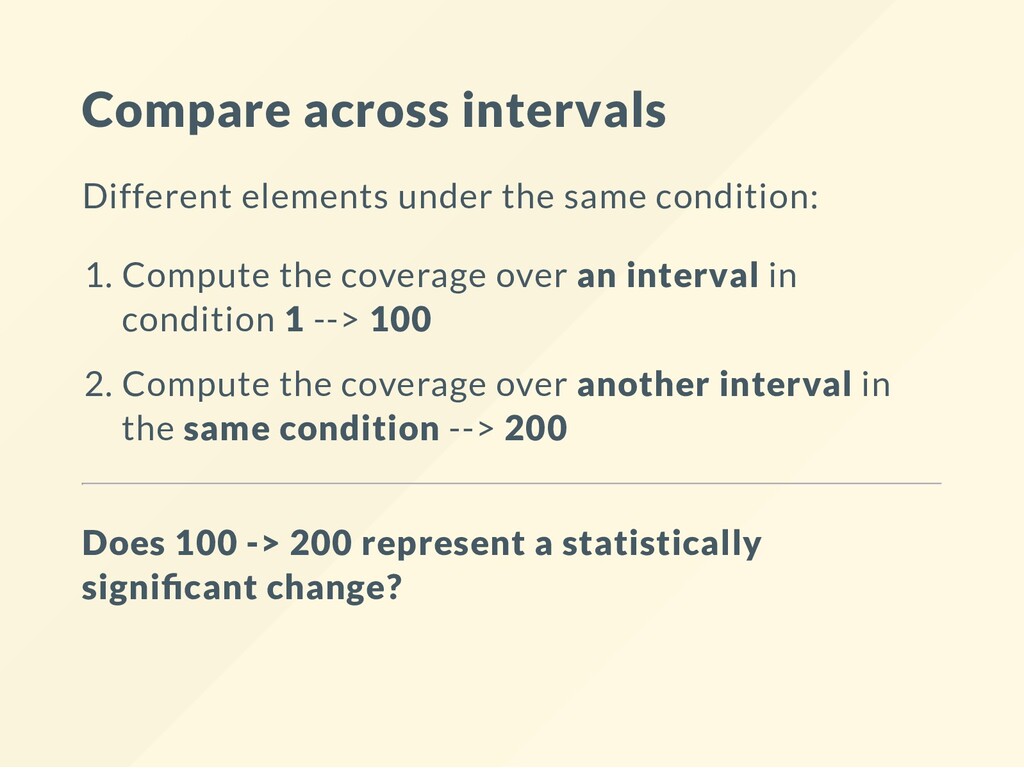
Compute the coverage over an interval in condition 1 --> 100 2. Compute the coverage over another interval in the same condition --> 200 Does 100 -> 200 represent a statistically signi cant change?
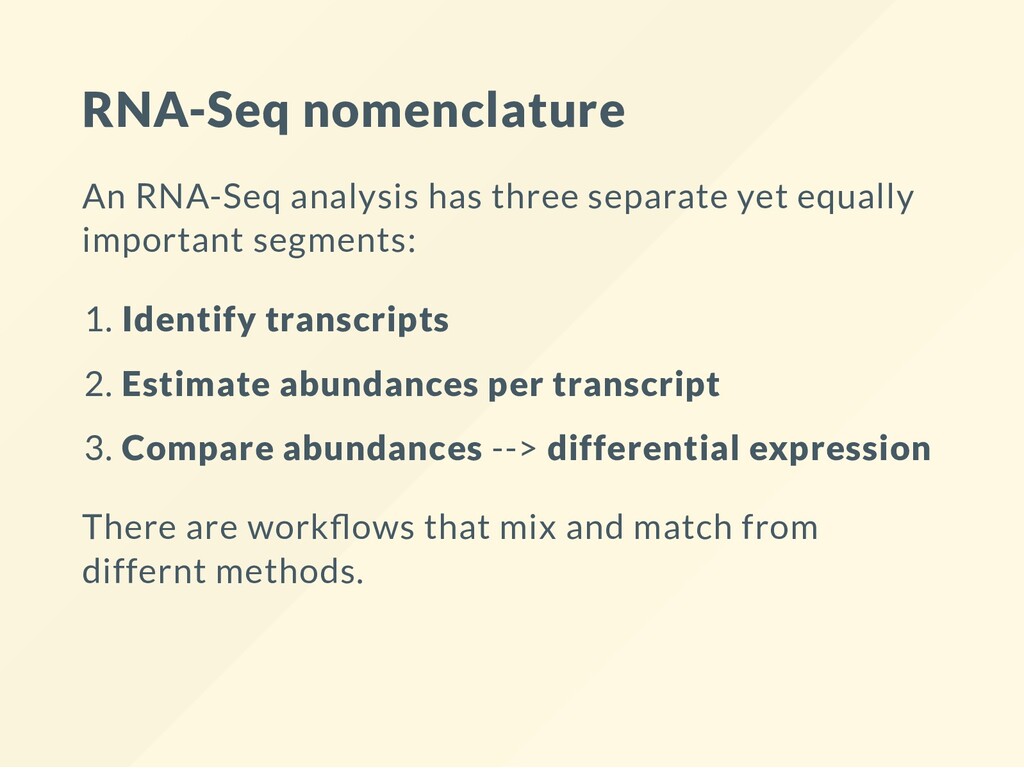
important segments: 1. Identify transcripts 2. Estimate abundances per transcript 3. Compare abundances --> differential expression There are work ows that mix and match from differnt methods.
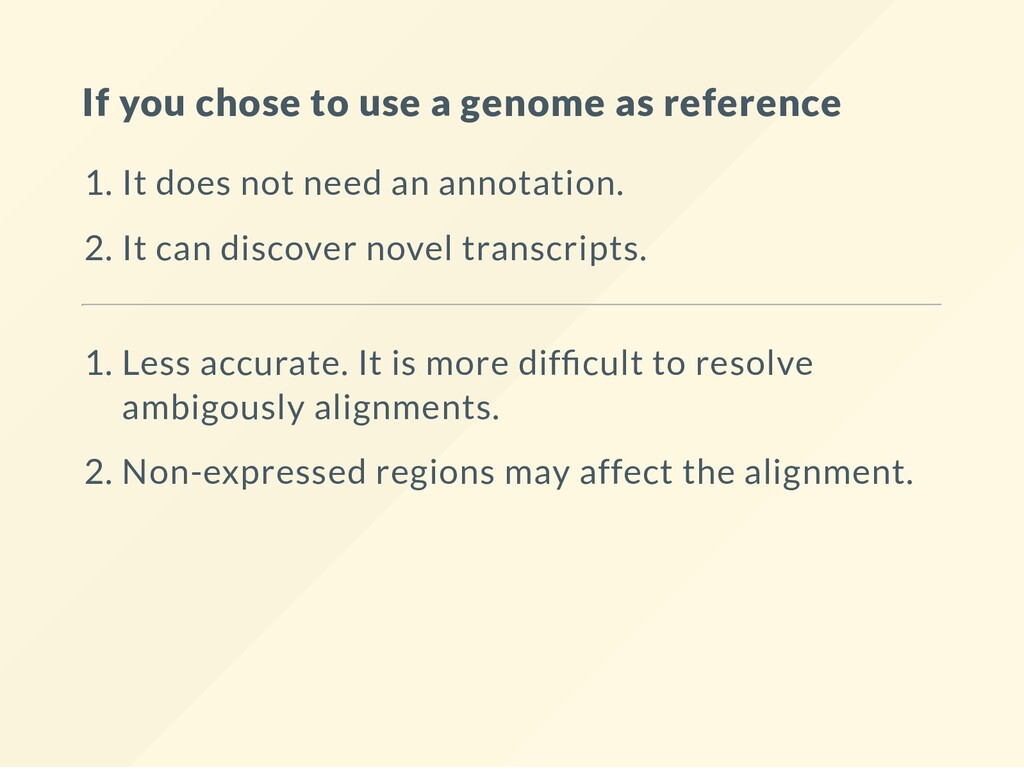
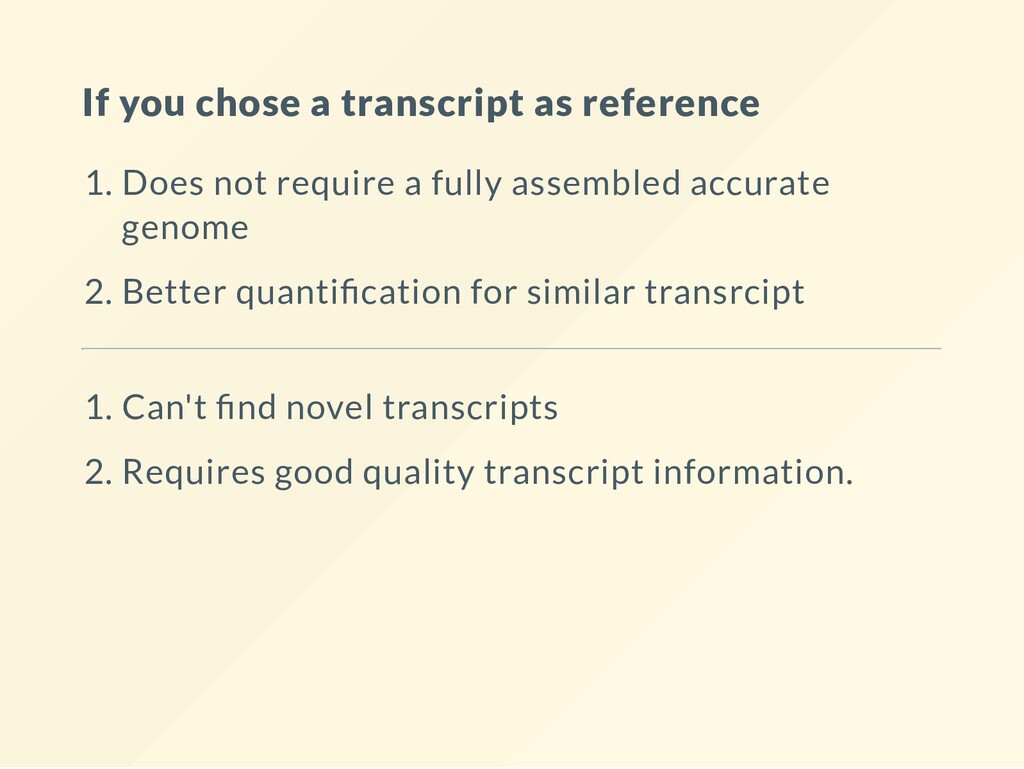
It does not need an annotation. 2. It can discover novel transcripts. 1. Less accurate. It is more dif cult to resolve ambigously alignments. 2. Non-expressed regions may affect the alignment.
require a fully assembled accurate genome 2. Better quanti cation for similar transrcipt 1. Can't nd novel transcripts 2. Requires good quality transcript information.
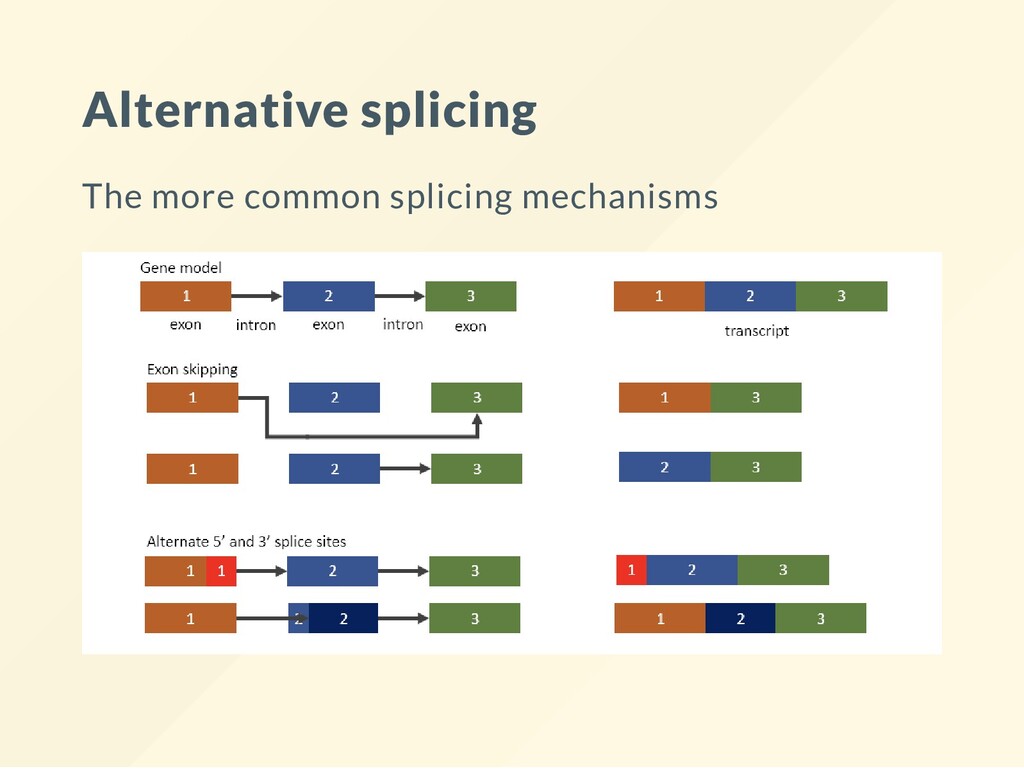
of all exons. We pretend that there is just one long transcript, built from all the exons and call that the gene. Sometimes it works - sometimes it does not. All depends on what is the origin of the phenomena under study.
the phenotype is such that relative abundance of alternative trascripts don't matter. When the phenotype is dominated by transcripts that belong to from different genes.
within a cell. We need to ensure that any change we measure is due to the condition change and not the normal variability. We need to make multiple measurements for the same condition. To detect a change the variation across replicates has to be smaller than the variation between conditions.
The more data we collect the more accurate an individual estimate. The more replicates we have the better we asses the natural variability. Current recommendation: More replicates are better: 4 or more.
only when aligning against a genome. You may ahve reads that 1. Are not fully contained in a transcript 2. May align in multiple locations Different counting (abundance estimation) strategies may produce different results.
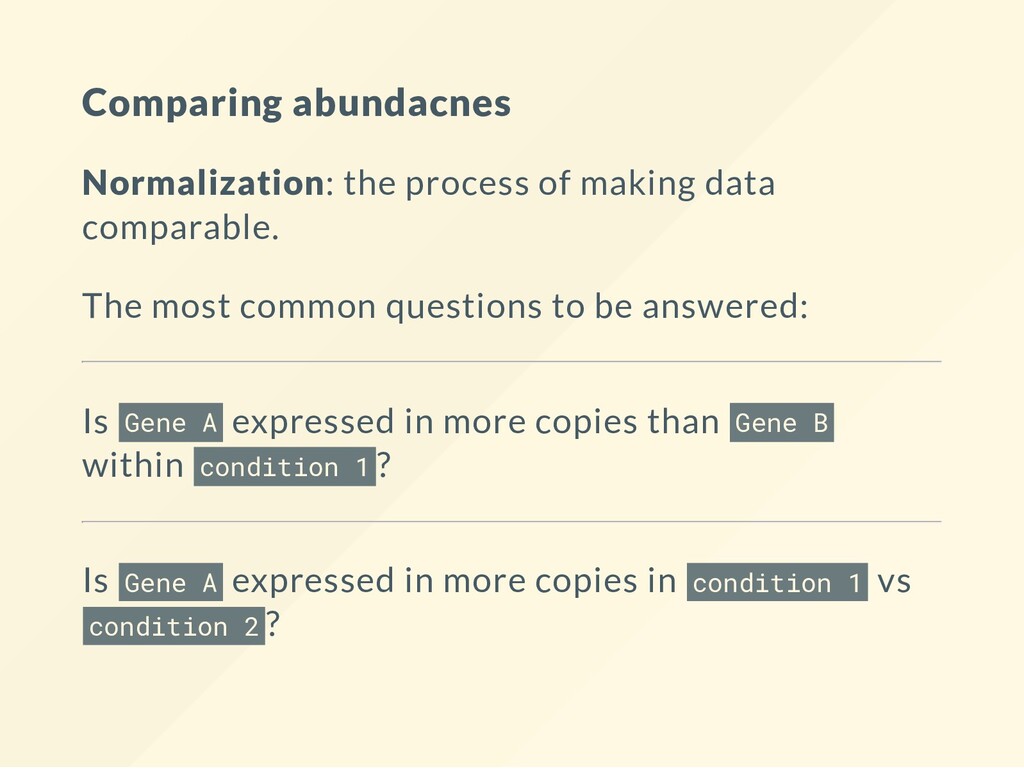
most common questions to be answered: Is Gene A expressed in more copies than Gene B within condition 1 ? Is Gene A expressed in more copies in condition 1 vs condition 2 ?
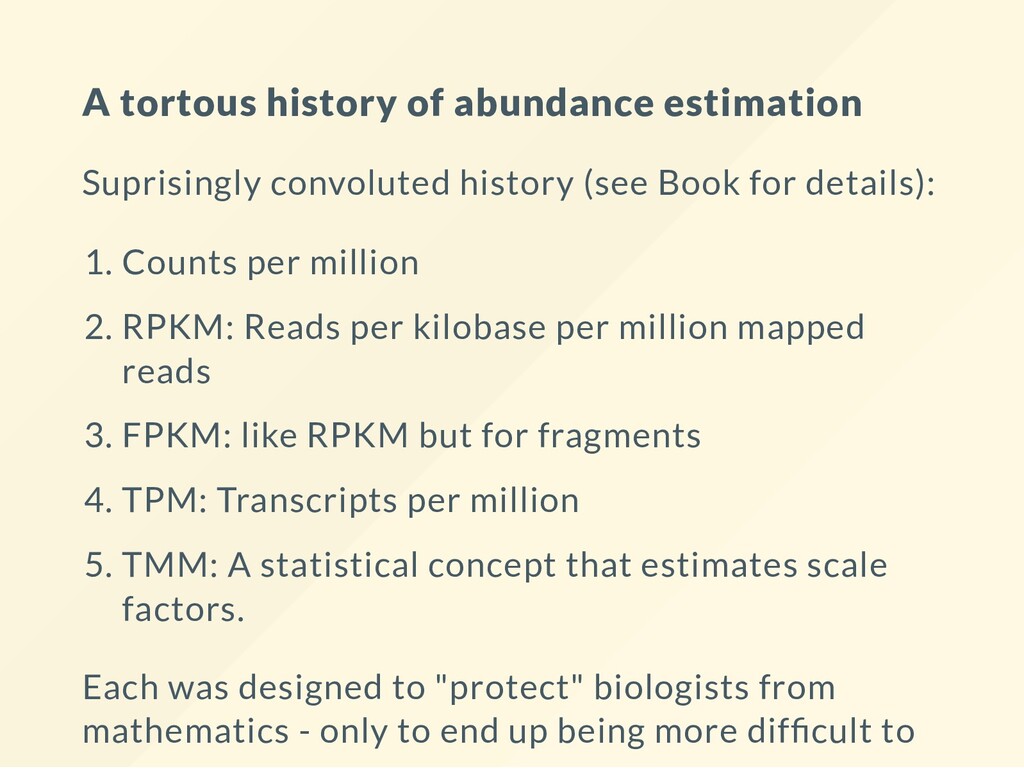
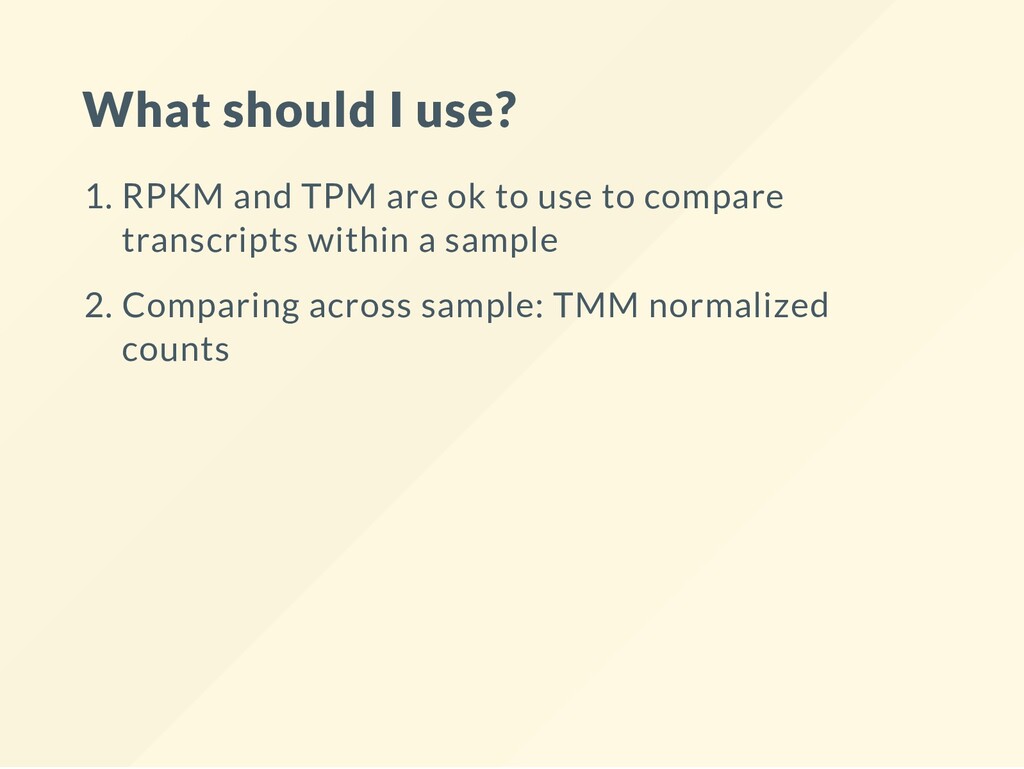
Book for details): 1. Counts per million 2. RPKM: Reads per kilobase per million mapped reads 3. FPKM: like RPKM but for fragments 4. TPM: Transcripts per million 5. TMM: A statistical concept that estimates scale factors. Each was designed to "protect" biologists from mathematics - only to end up being more dif cult to