information. No tool can describe and capture this variety. Algorithms are good at churning through and nding well de ned/expected features. The human eye is the best instrument to see unexpected properties.
bad. Some are even worse. There are probably hundreds of very similar applications with various features/applications – each one is the better as long as you de ne better in a speci c way Genomic data visualization is a surprisingly complex matter – users’ needs diverge dramatically and can be mutually exclusive
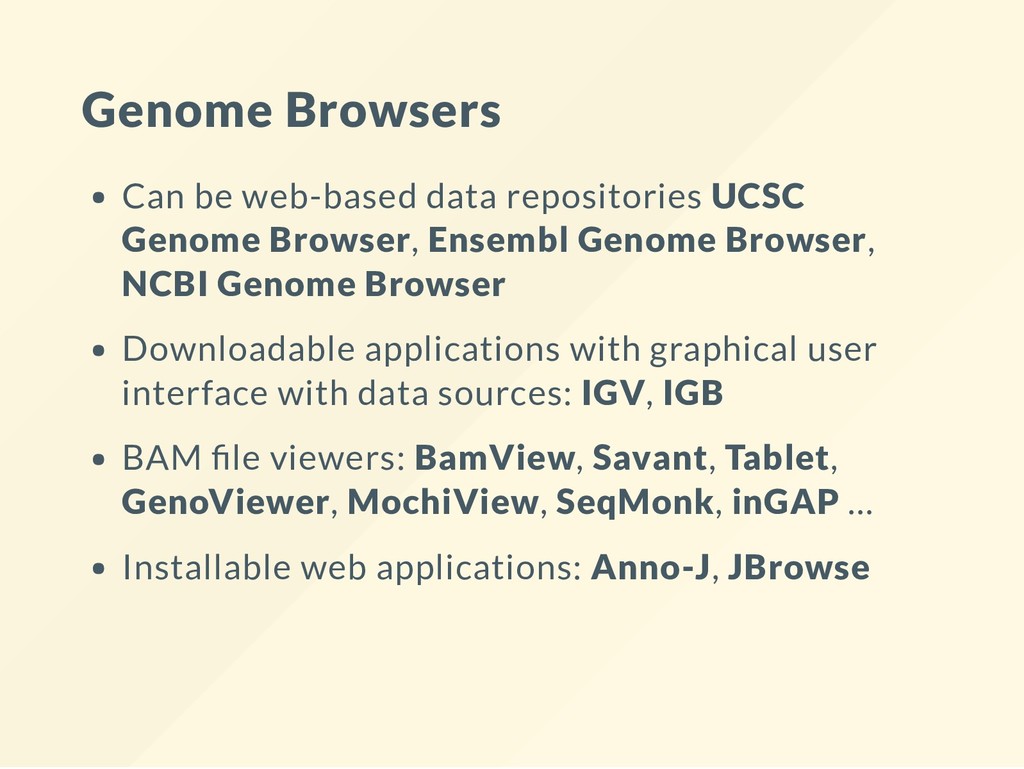
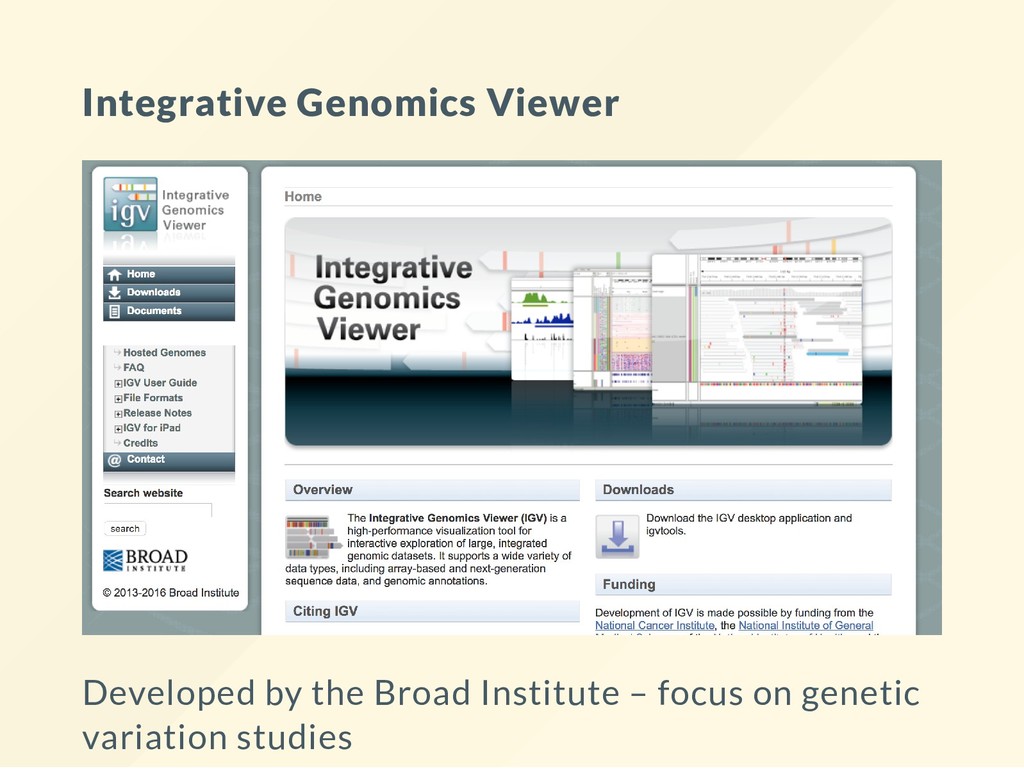
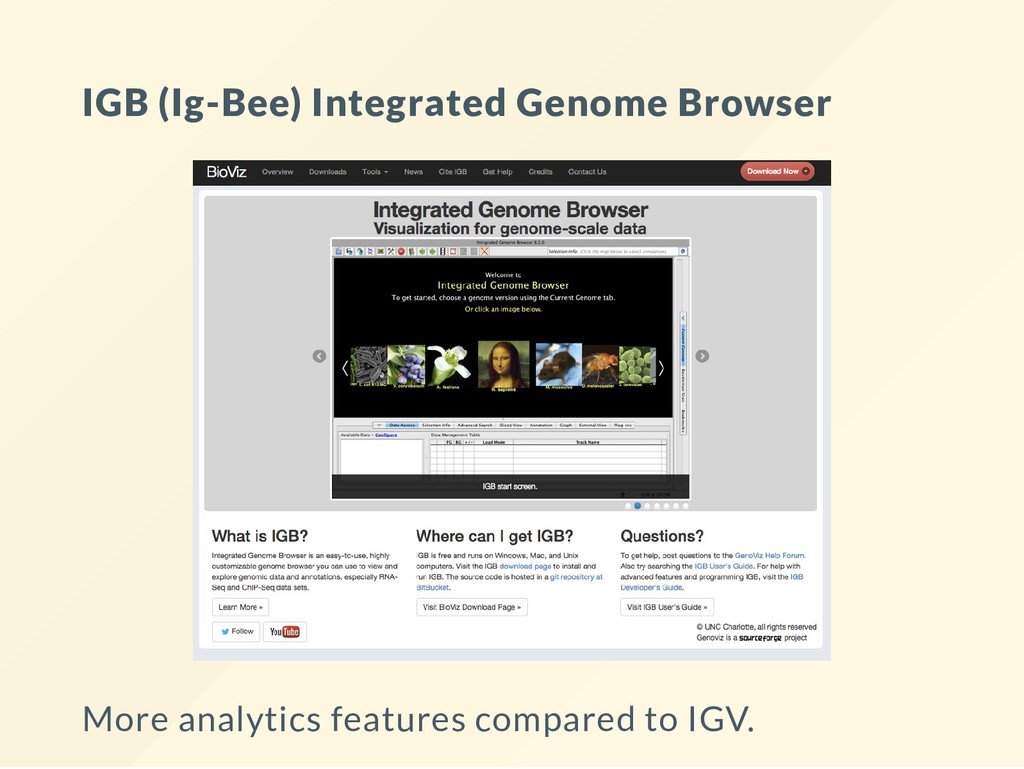
suit the tasks performed in that environment: Variation for high throughput data: IGV, IGB Generic visualizer for genome assembly: Artemis Targeted use cases: ChipSEQ -> MochiView DNA Methylation -> ChipMonk and SeqMonk
locations, alignments, etc. 2. Values over intervals (shown as vertical bars): coverages, probabilities, abundances, etc. 3. Attributes (shown as colors or "glyphs"): mutations, junctions, fusions etc.
is when running the les so that they are visible from Windows is important. You need to be able to access the BAM les from Windows. See the Windows Setup if you missed this so far
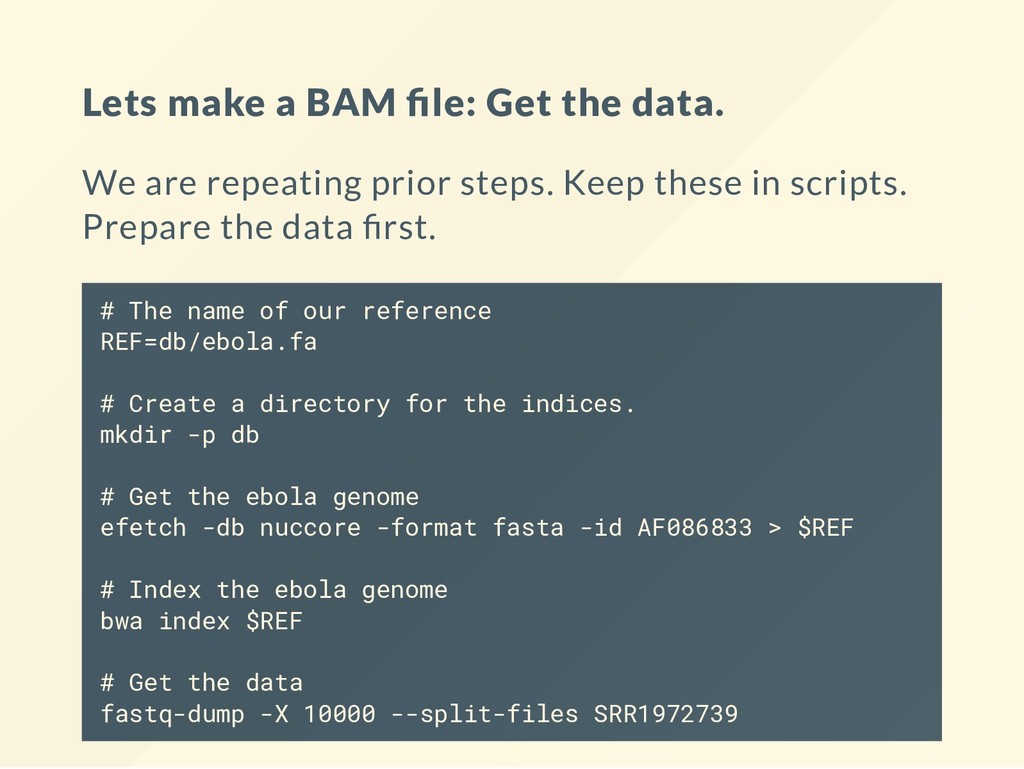
repeating prior steps. Keep these in scripts. Prepare the data rst. # The name of our reference REF=db/ebola.fa # Create a directory for the indices. mkdir -p db # Get the ebola genome efetch -db nuccore -format fasta -id AF086833 > $REF # Index the ebola genome bwa index $REF # Get the data fastq-dump -X 10000 --split-files SRR1972739
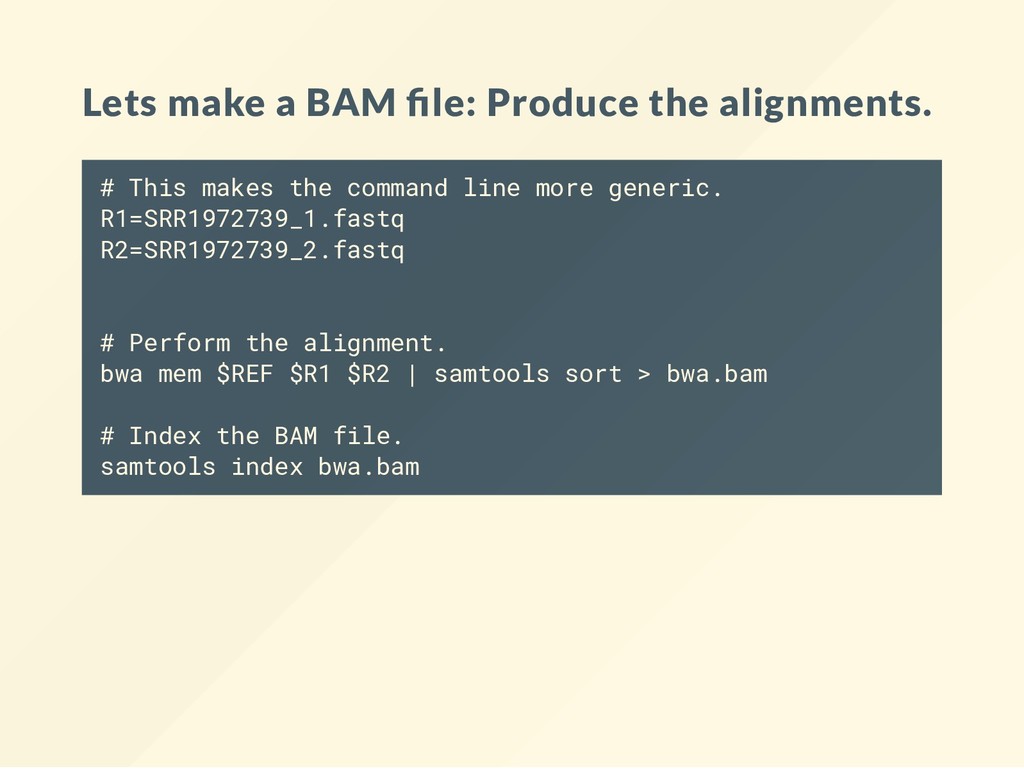
makes the command line more generic. R1=SRR1972739_1.fastq R2=SRR1972739_2.fastq # Perform the alignment. bwa mem $REF $R1 $R2 | samtools sort > bwa.bam # Index the BAM file. samtools index bwa.bam
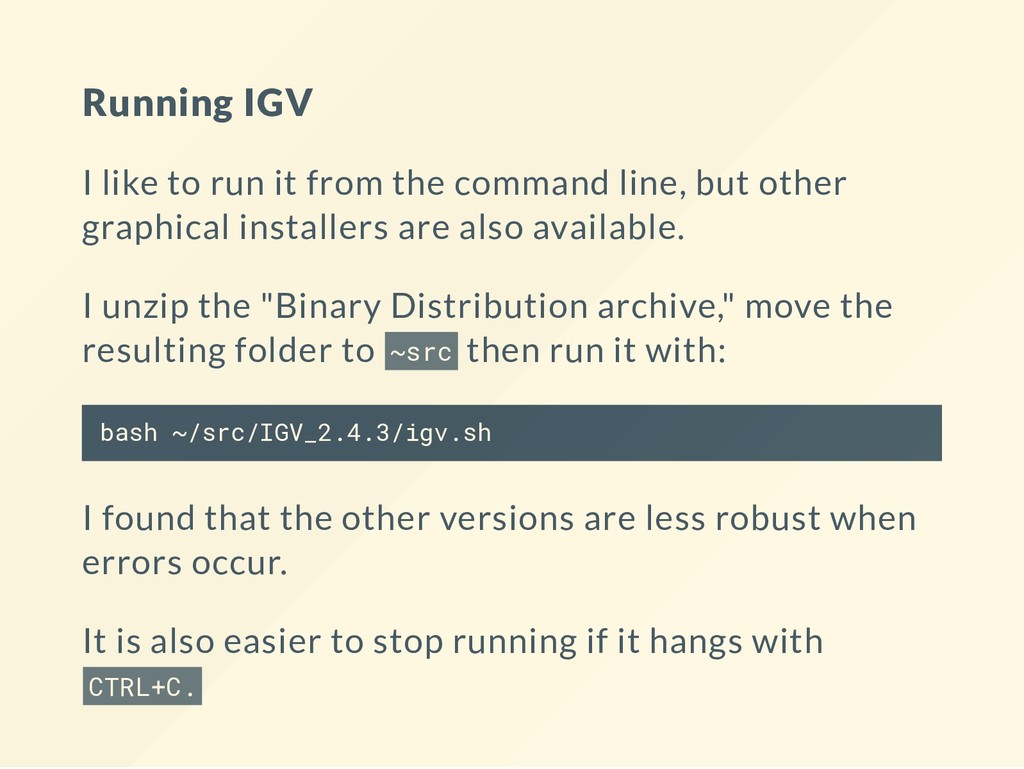
line, but other graphical installers are also available. I unzip the "Binary Distribution archive," move the resulting folder to ~src then run it with: bash ~/src/IGV_2.4.3/igv.sh I found that the other versions are less robust when errors occur. It is also easier to stop running if it hangs with CTRL+C.
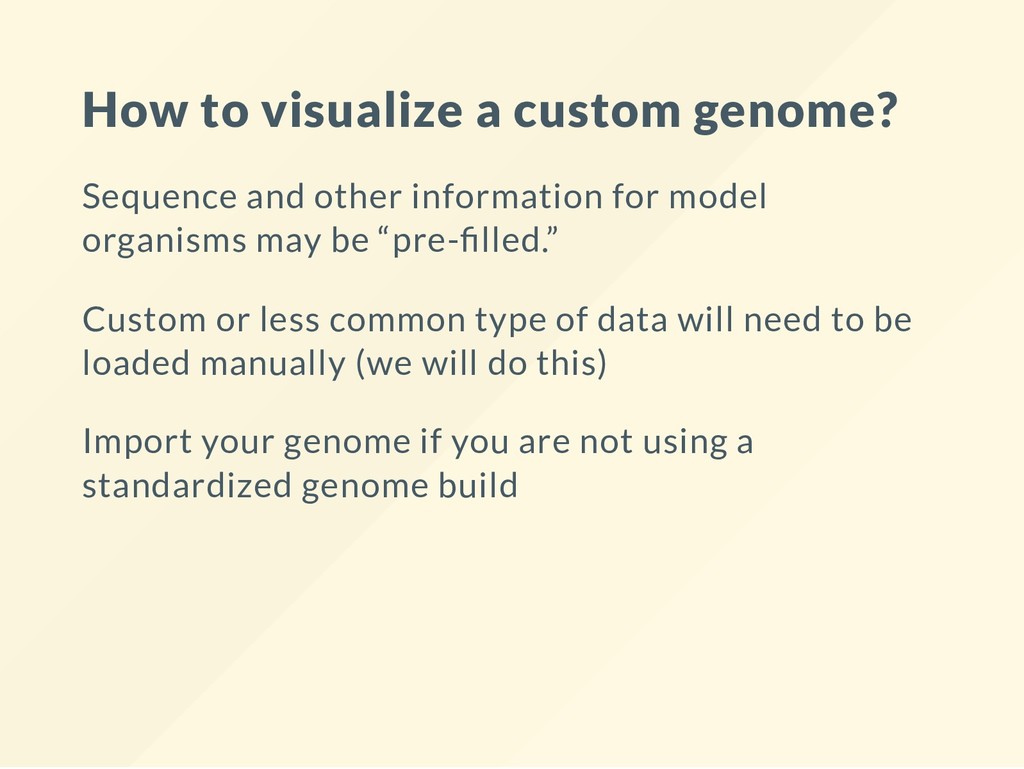
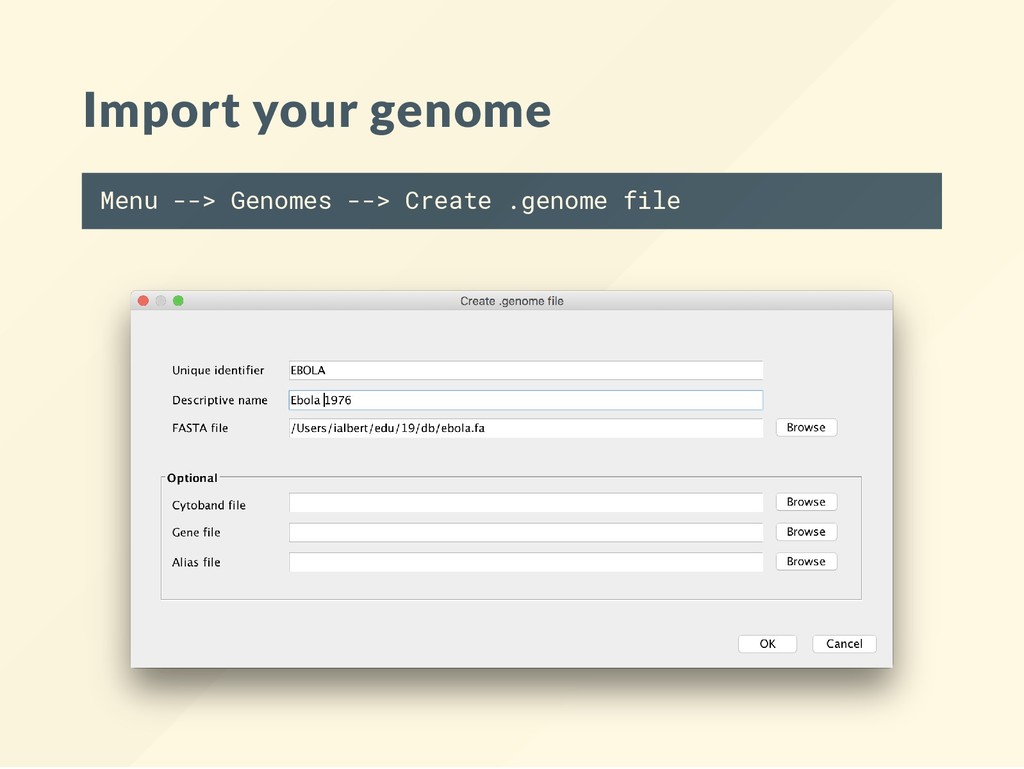
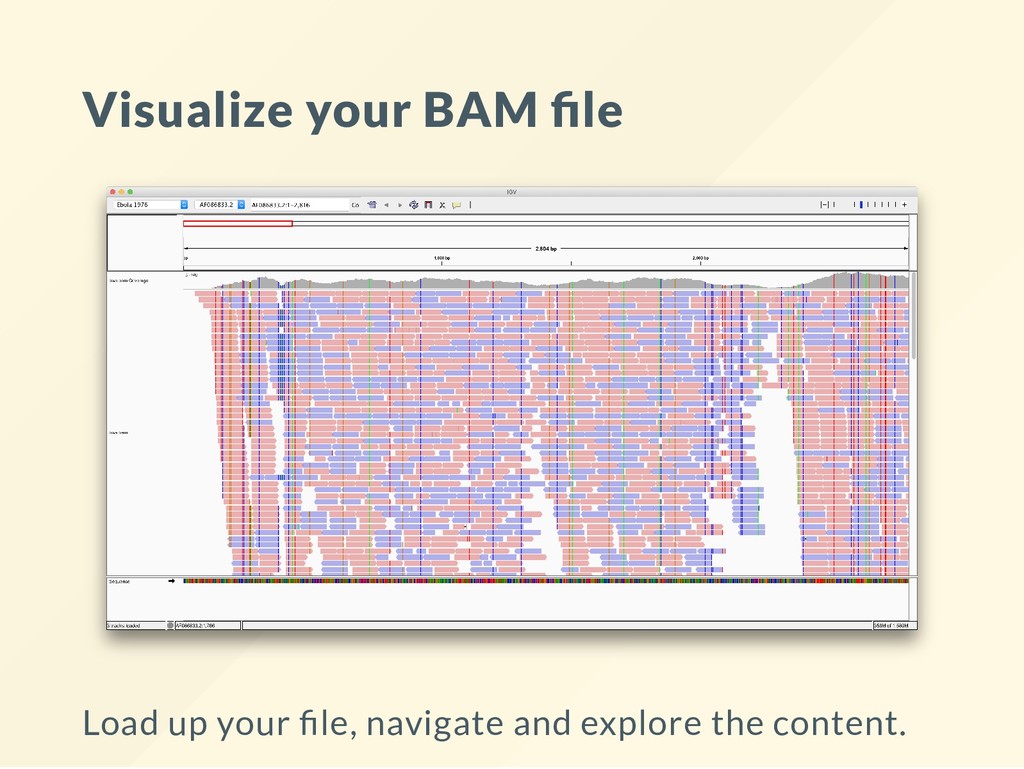
for model organisms may be “pre- lled.” Custom or less common type of data will need to be loaded manually (we will do this) Import your genome if you are not using a standardized genome build