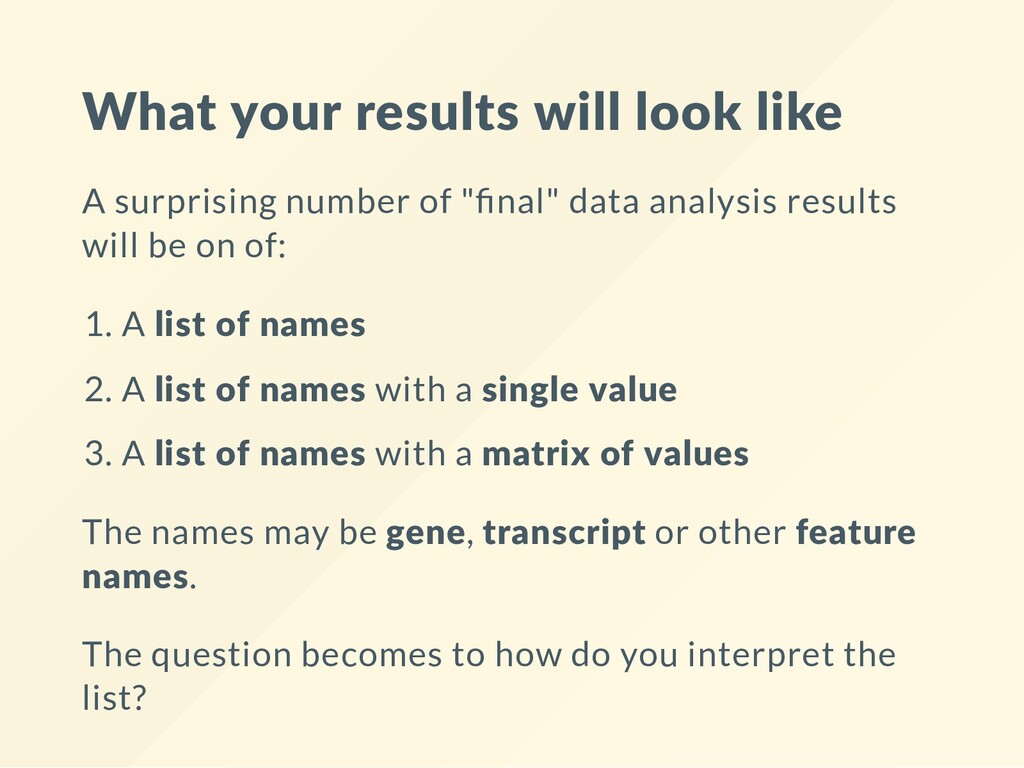
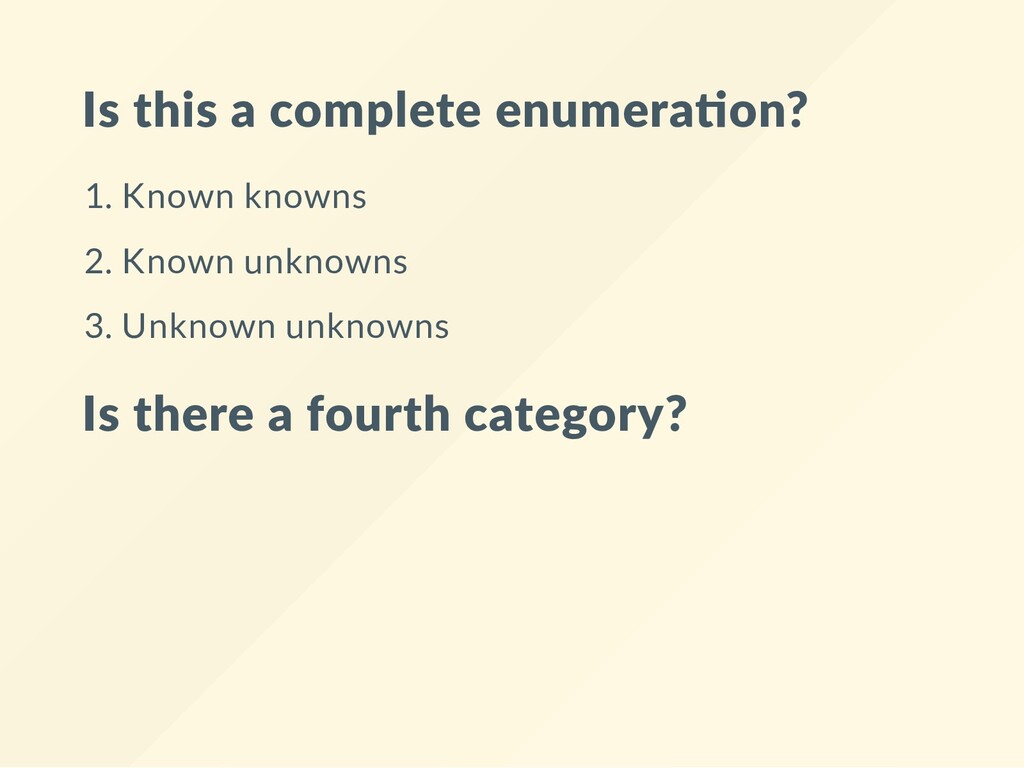
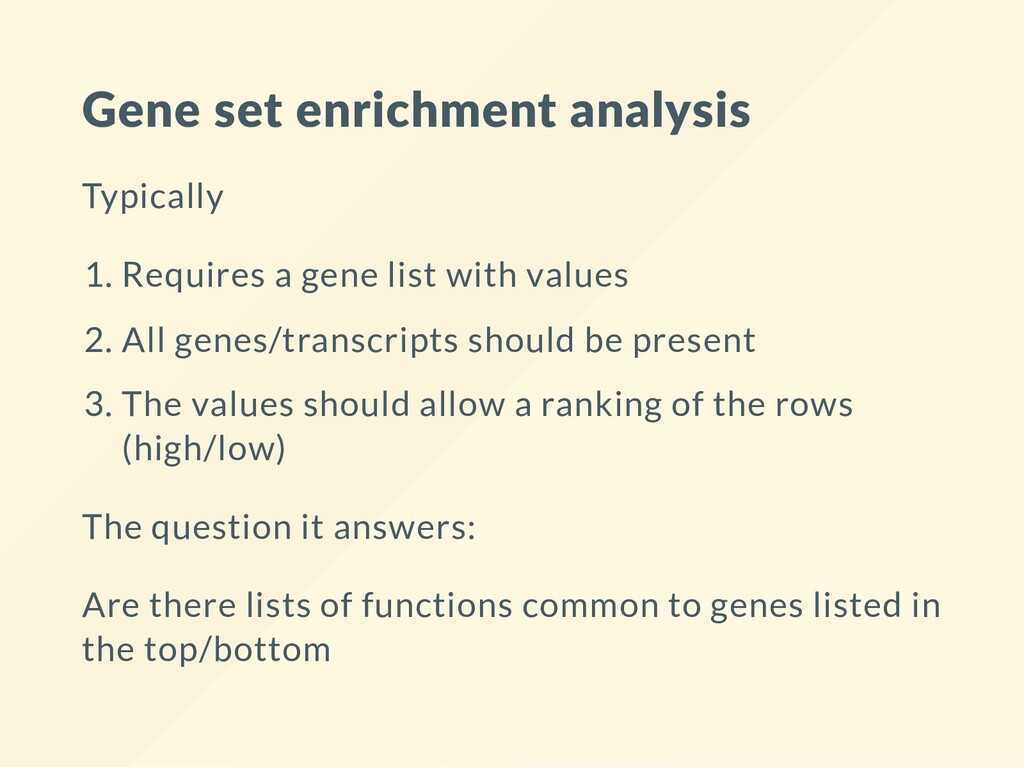
" nal" data analysis results will be on of: 1. A list of names 2. A list of names with a single value 3. A list of names with a matrix of values The names may be gene, transcript or other feature names. The question becomes to how do you interpret the list?
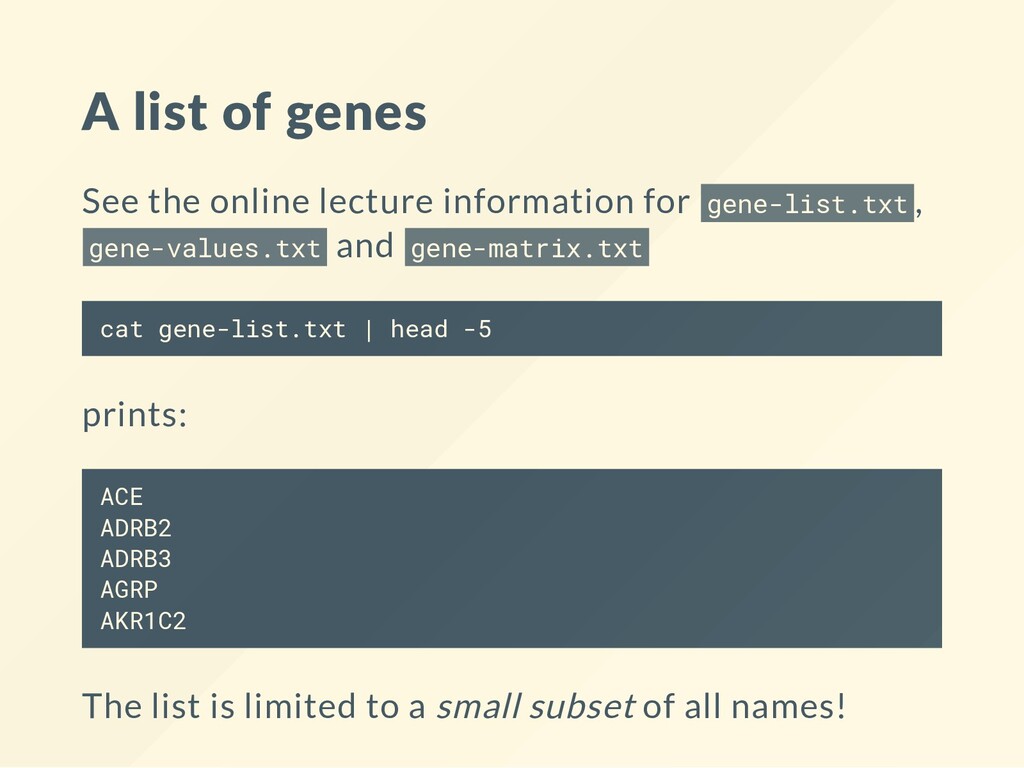
g e n e - l i s t . t x t, g e n e - v a l u e s . t x t and g e n e - m a t r i x . t x t c a t g e n e - l i s t . t x t | h e a d - 5 prints: A C E A D R B 2 A D R B 3 A G R P A K R 1 C 2 The list is limited to a small subset of all names!
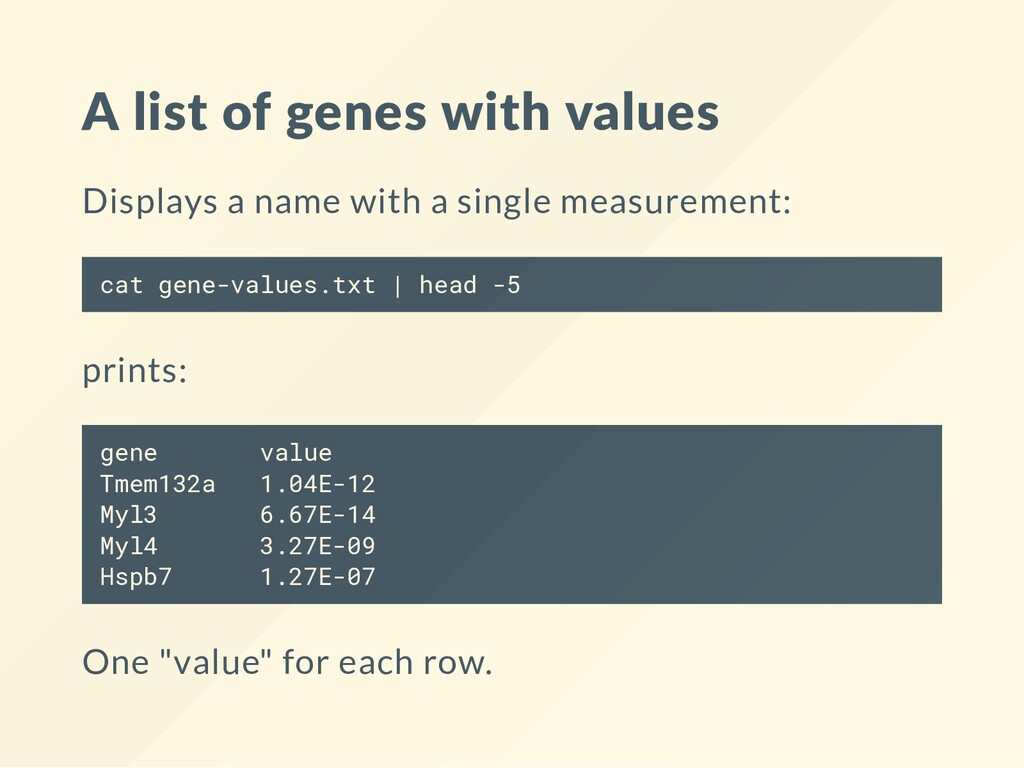
a single measurement: c a t g e n e - v a l u e s . t x t | h e a d - 5 prints: g e n e v a l u e T m e m 1 3 2 a 1 . 0 4 E - 1 2 M y l 3 6 . 6 7 E - 1 4 M y l 4 3 . 2 7 E - 0 9 H s p b 7 1 . 2 7 E - 0 7 One "value" for each row.
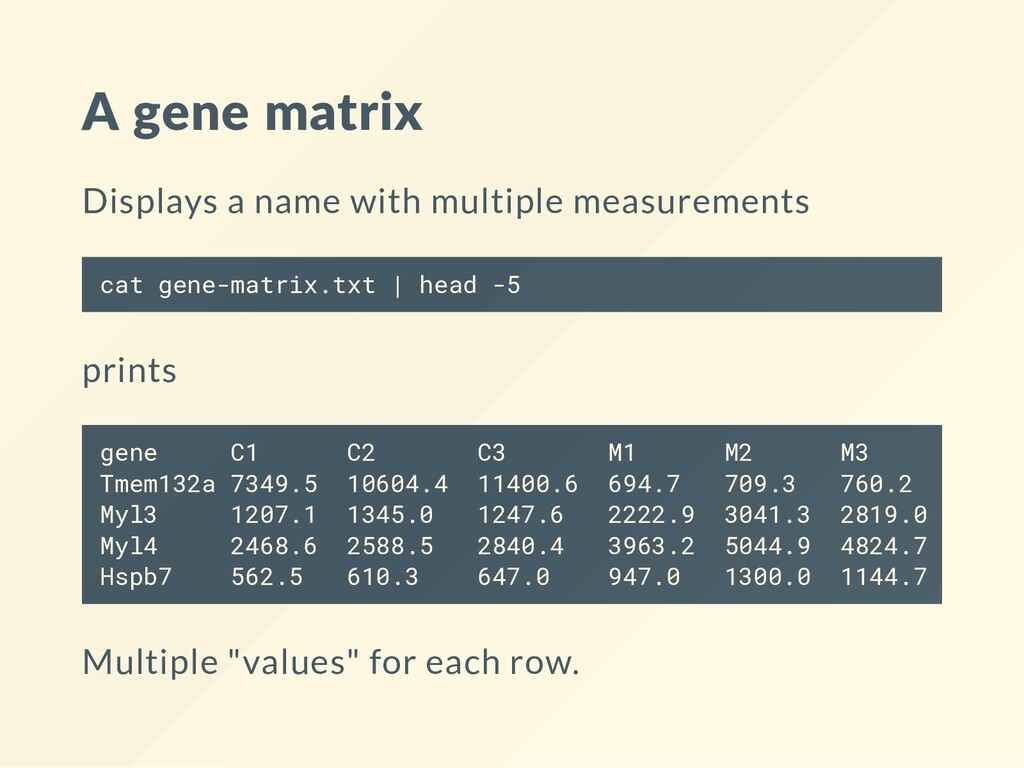
a t g e n e - m a t r i x . t x t | h e a d - 5 prints g e n e C 1 C 2 C 3 M 1 M 2 M 3 T m e m 1 3 2 a 7 3 4 9 . 5 1 0 6 0 4 . 4 1 1 4 0 0 . 6 6 9 4 . 7 7 0 9 . 3 7 6 0 . 2 M y l 3 1 2 0 7 . 1 1 3 4 5 . 0 1 2 4 7 . 6 2 2 2 2 . 9 3 0 4 1 . 3 2 8 1 9 . 0 M y l 4 2 4 6 8 . 6 2 5 8 8 . 5 2 8 4 0 . 4 3 9 6 3 . 2 5 0 4 4 . 9 4 8 2 4 . 7 H s p b 7 5 6 2 . 5 6 1 0 . 3 6 4 7 . 0 9 4 7 . 0 1 3 0 0 . 0 1 1 4 4 . 7 Multiple "values" for each row.
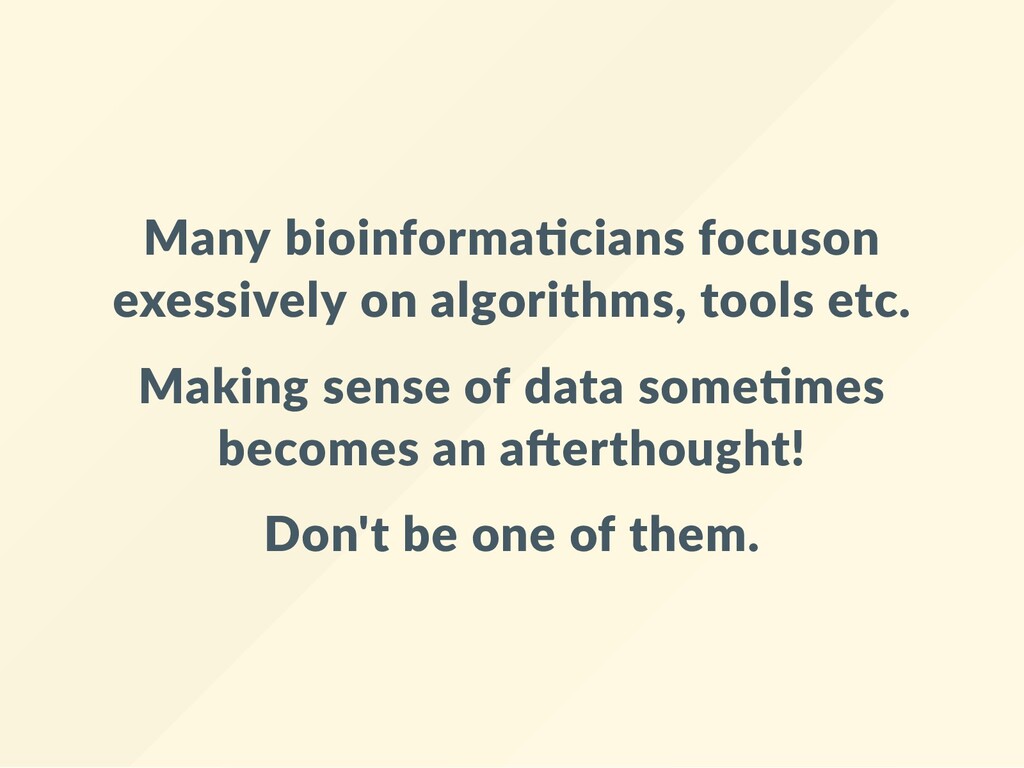
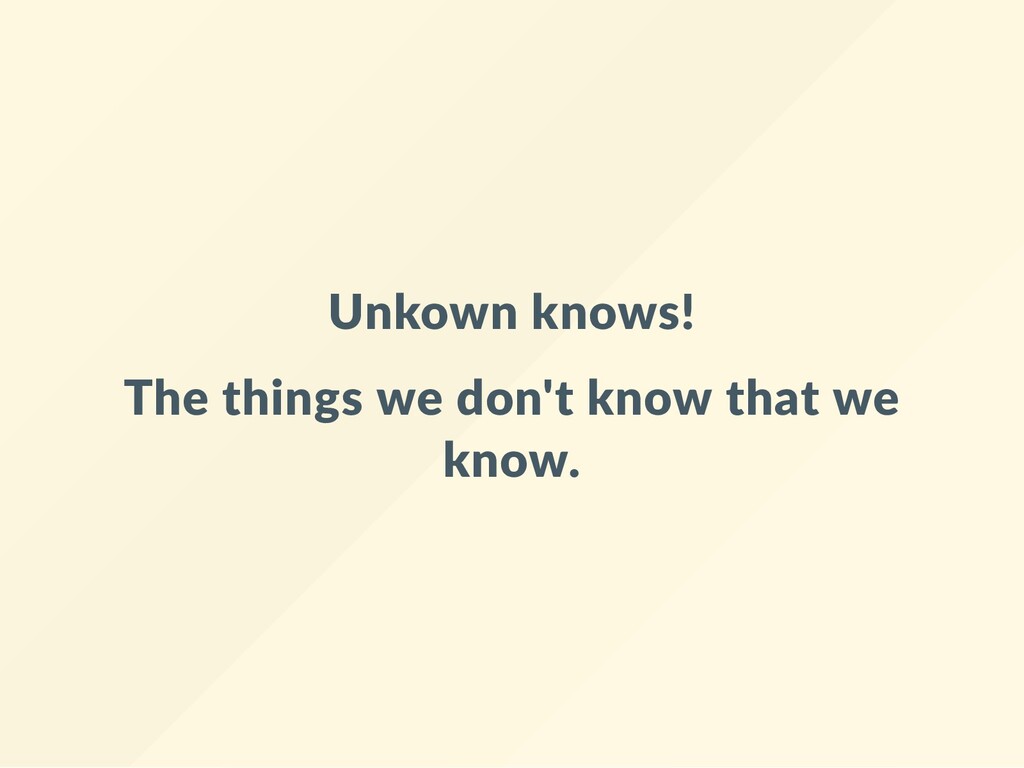
There are known knowns. There are things we know that we know. There are known unknowns. That is to say, there are things that we now know we don't know. But there are also unknown unknowns. There are things we do not know we don't know Much ridiculed back then - yet quite deep and thoughtful - especially regarding scienti c inquiry
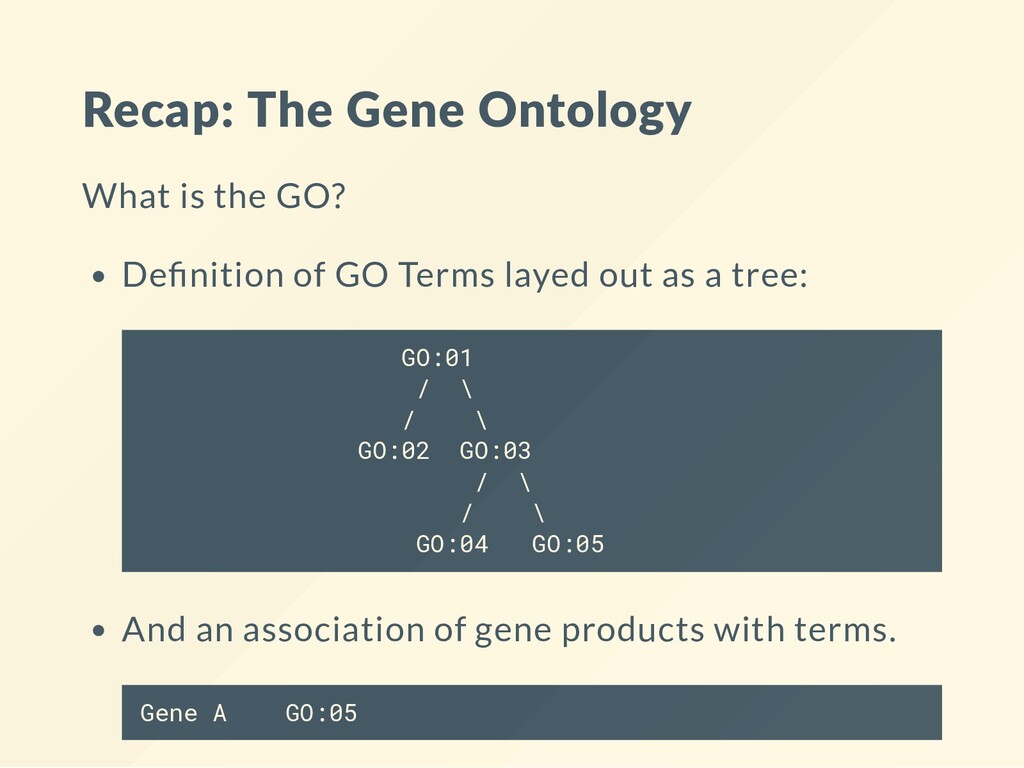
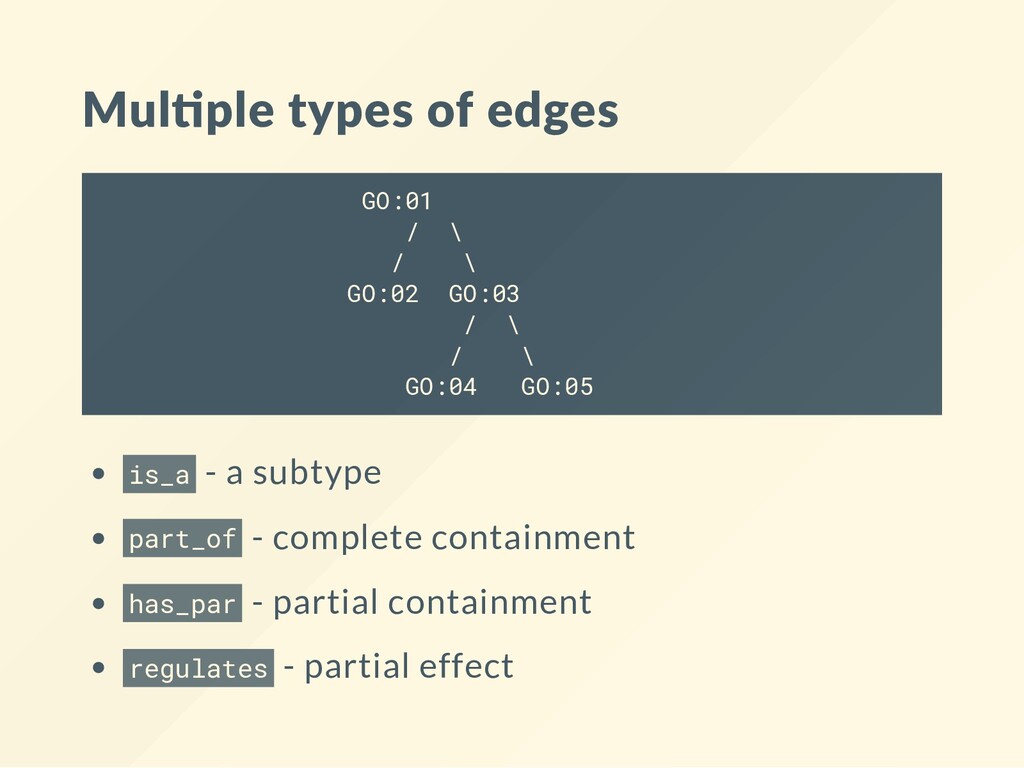
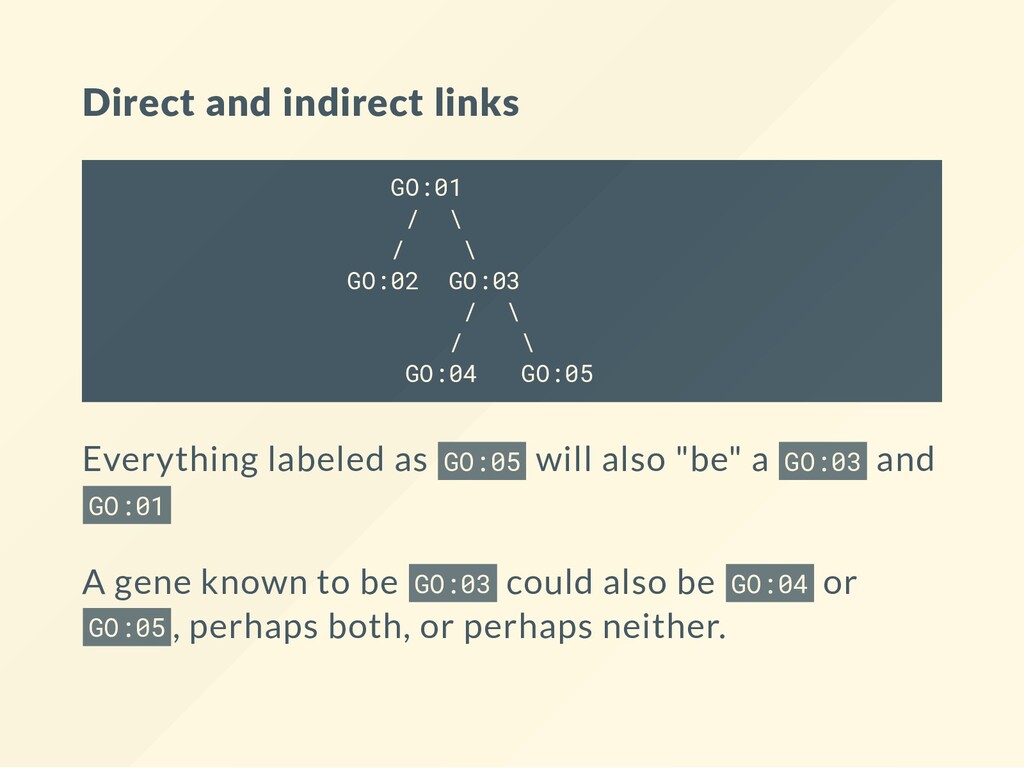
of GO Terms layed out as a tree: G O : 0 1 ∕ \ ∕ \ G O : 0 2 G O : 0 3 ∕ \ ∕ \ G O : 0 4 G O : 0 5 And an association of gene products with terms. G e n e A G O : 0 5
∕ \ ∕ \ G O : 0 2 G O : 0 3 ∕ \ ∕ \ G O : 0 4 G O : 0 5 i s _ a - a subtype p a r t _ o f - complete containment h a s _ p a r - partial containment r e g u l a t e s - partial effect
\ ∕ \ G O : 0 2 G O : 0 3 ∕ \ ∕ \ G O : 0 4 G O : 0 5 Everything labeled as G O : 0 5 will also "be" a G O : 0 3 and G O : 0 1 A gene known to be G O : 0 3 could also be G O : 0 4 or G O : 0 5, perhaps both, or perhaps neither.
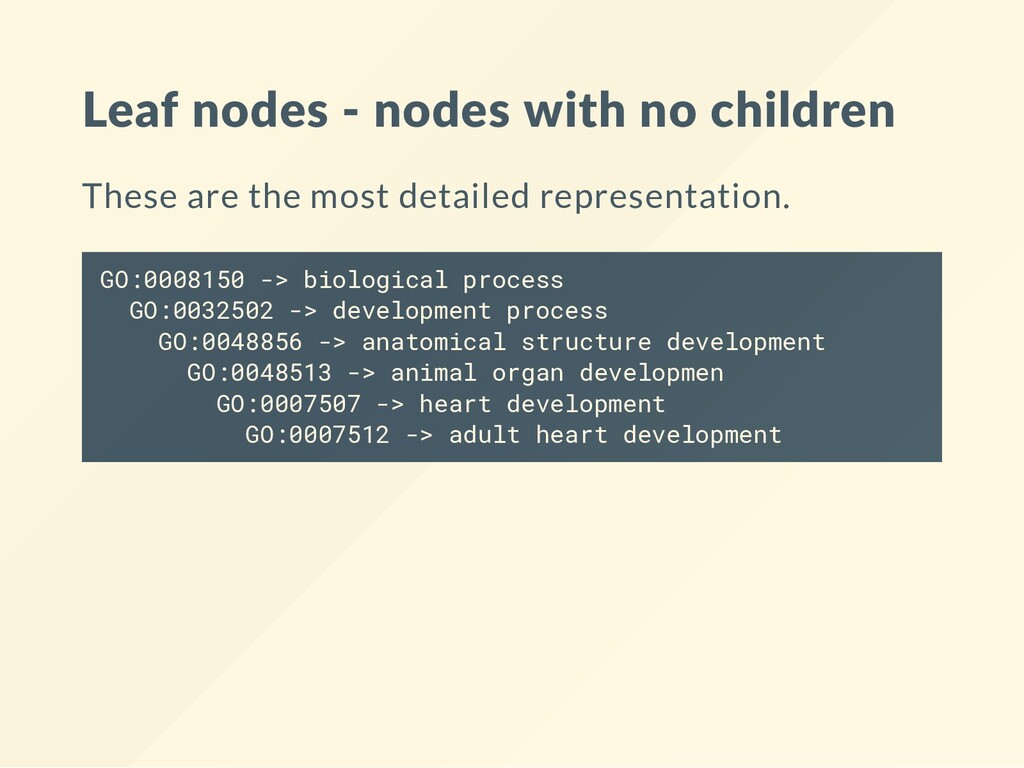
most detailed representation. G O : 0 0 0 8 1 5 0 - > b i o l o g i c a l p r o c e s s G O : 0 0 3 2 5 0 2 - > d e v e l o p m e n t p r o c e s s G O : 0 0 4 8 8 5 6 - > a n a t o m i c a l s t r u c t u r e d e v e l o p m e n t G O : 0 0 4 8 5 1 3 - > a n i m a l o r g a n d e v e l o p m e n G O : 0 0 0 7 5 0 7 - > h e a r t d e v e l o p m e n t G O : 0 0 0 7 5 1 2 - > a d u l t h e a r t d e v e l o p m e n t
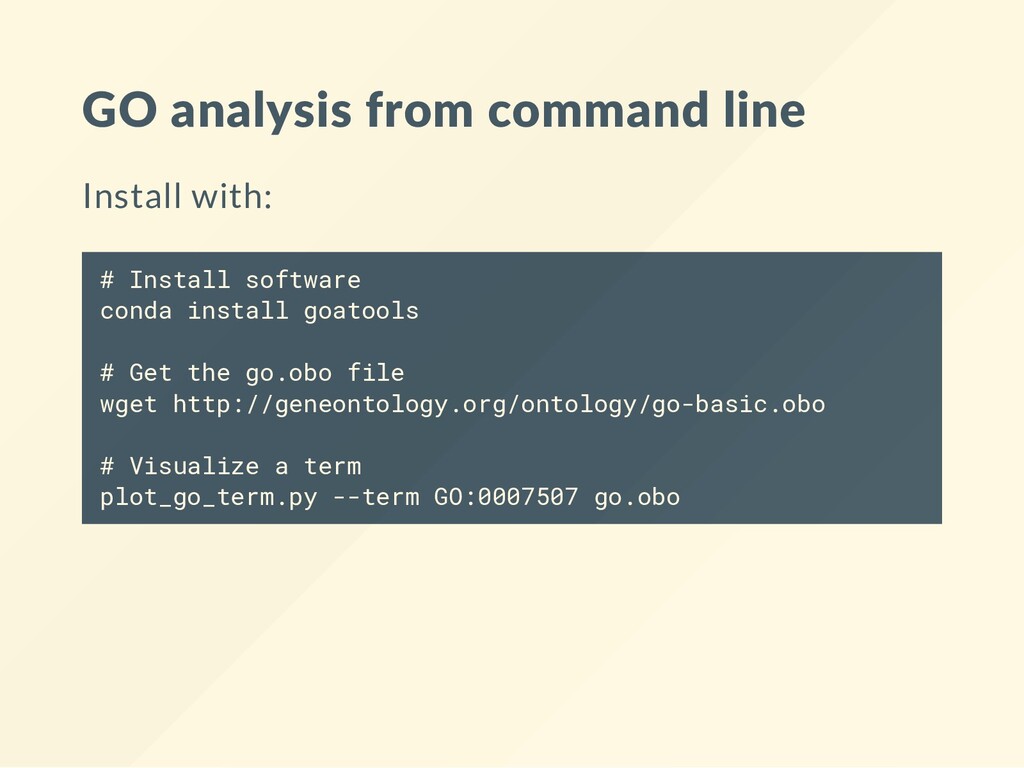
s t a l l s o f t w a r e c o n d a i n s t a l l g o a t o o l s # G e t t h e g o . o b o f i l e w g e t h t t p : ∕ ∕ g e n e o n t o l o g y . o r g ∕ o n t o l o g y ∕ g o - b a s i c . o b o # V i s u a l i z e a t e r m p l o t _ g o _ t e r m . p y - - t e r m G O : 0 0 0 7 5 0 7 g o . o b o
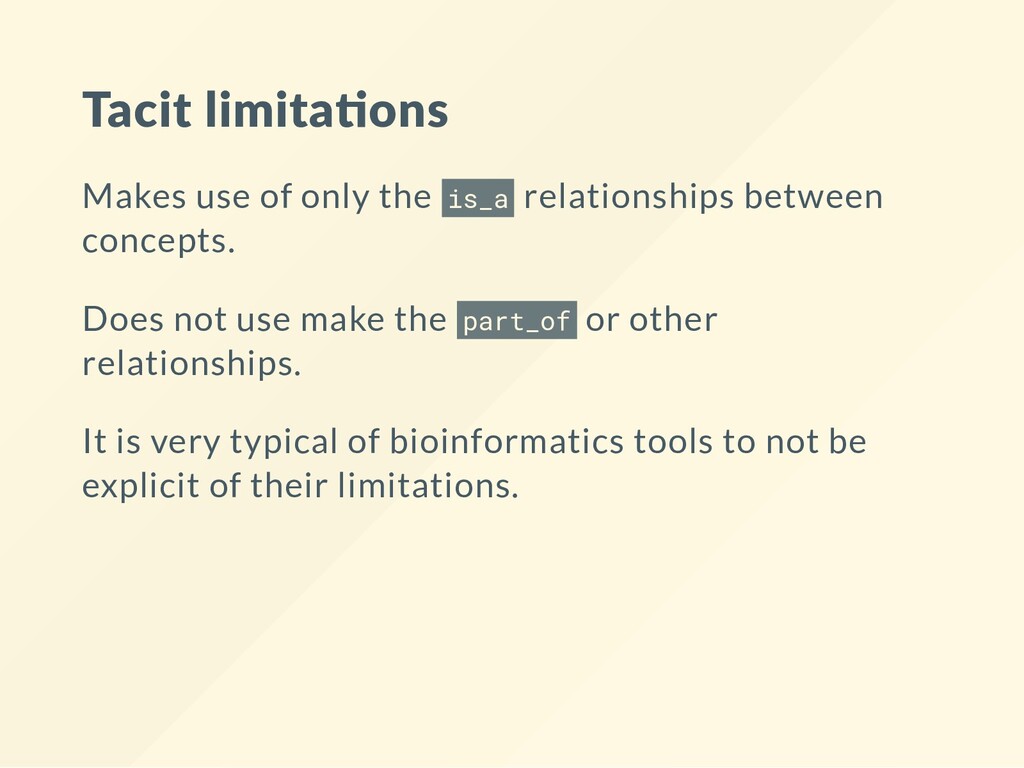
_ a relationships between concepts. Does not use make the p a r t _ o f or other relationships. It is very typical of bioinformatics tools to not be explicit of their limitations.
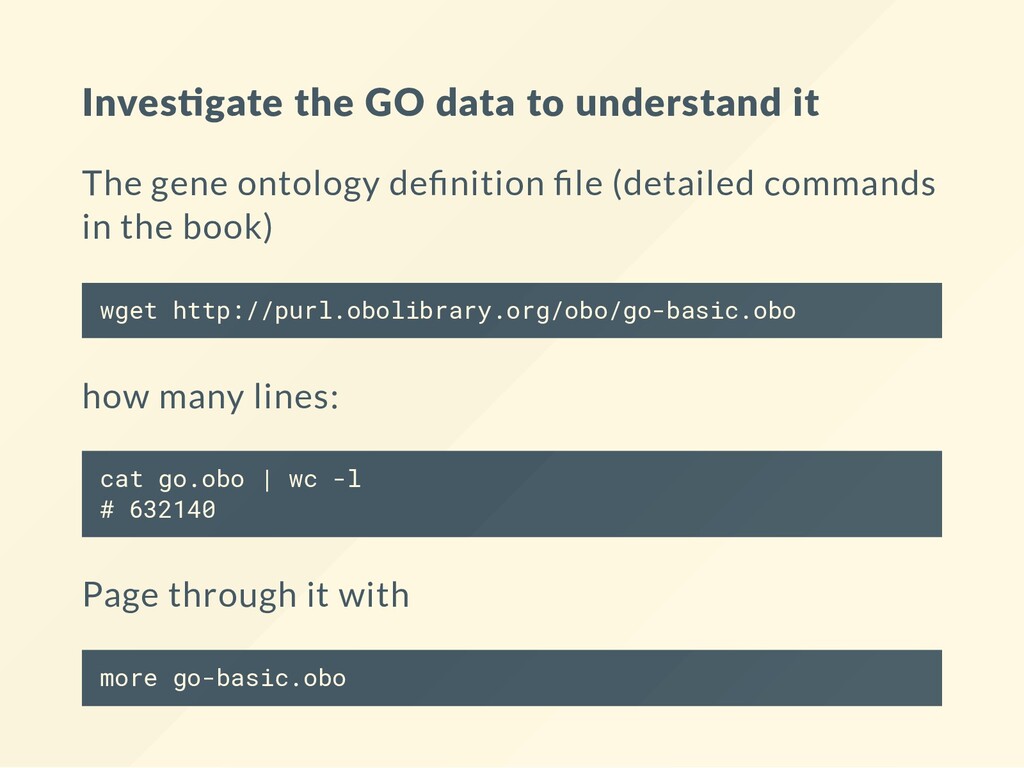
ontology de nition le (detailed commands in the book) w g e t h t t p : ∕ ∕ p u r l . o b o l i b r a r y . o r g ∕ o b o ∕ g o - b a s i c . o b o how many lines: c a t g o . o b o | w c - l # 6 3 2 1 4 0 Page through it with m o r e g o - b a s i c . o b o
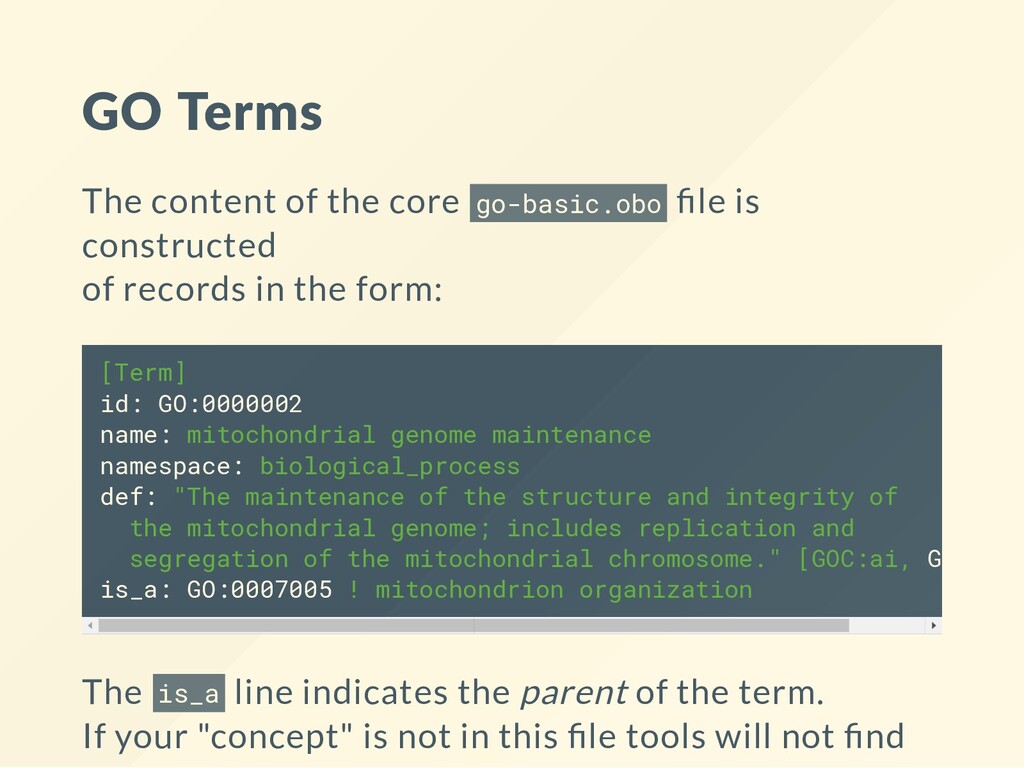
b a s i c . o b o le is constructed of records in the form: [ T e r m ] i d : G O : 0 0 0 0 0 0 2 n a m e : m i t o c h o n d r i a l g e n o m e m a i n t e n a n c e n a m e s p a c e : b i o l o g i c a l _ p r o c e s s d e f : " T h e m a i n t e n a n c e o f t h e s t r u c t u r e a n d i n t e g r i t y o f t h e m i t o c h o n d r i a l g e n o m e ; i n c l u d e s r e p l i c a t i o n a n d s e g r e g a t i o n o f t h e m i t o c h o n d r i a l c h r o m o s o m e . " [ G O C : a i , G O C : v w ] i s _ a : G O : 0 0 0 7 0 0 5 ! m i t o c h o n d r i o n o r g a n i z a t i o n The i s _ a line indicates the parent of the term. If your "concept" is not in this le tools will not nd
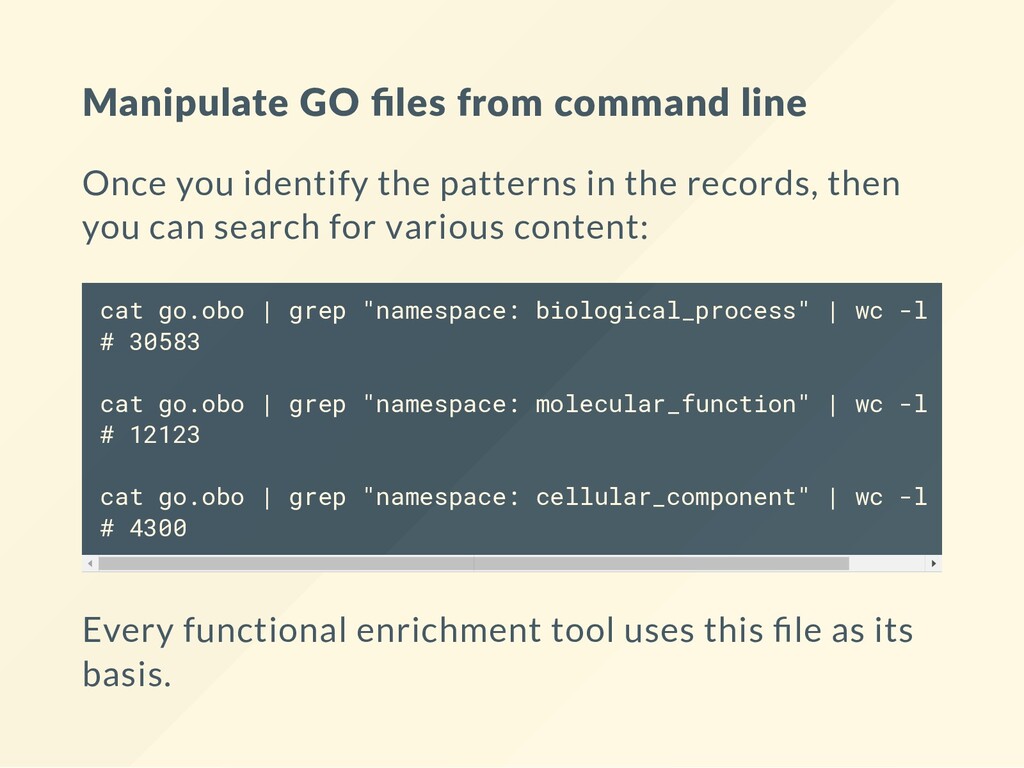
patterns in the records, then you can search for various content: c a t g o . o b o | g r e p " n a m e s p a c e : b i o l o g i c a l _ p r o c e s s " | w c - l # 3 0 5 8 3 c a t g o . o b o | g r e p " n a m e s p a c e : m o l e c u l a r _ f u n c t i o n " | w c - l # 1 2 1 2 3 c a t g o . o b o | g r e p " n a m e s p a c e : c e l l u l a r _ c o m p o n e n t " | w c - l # 4 3 0 0 Every functional enrichment tool uses this le as its basis.
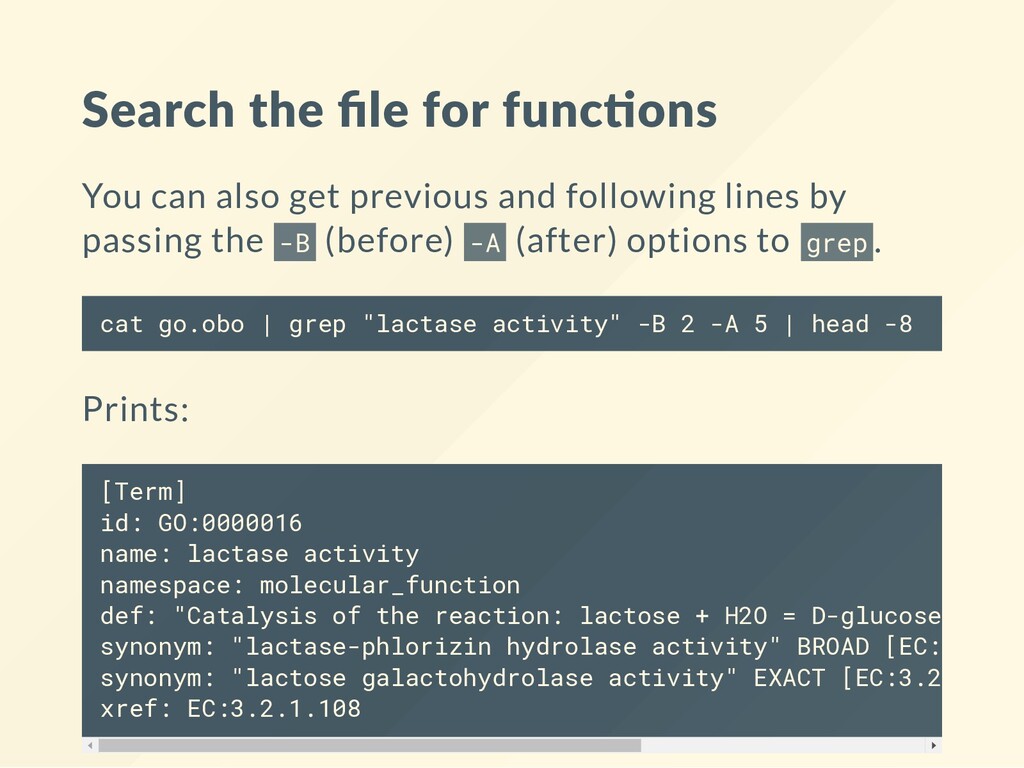
previous and following lines by passing the - B (before) - A (after) options to g r e p. c a t g o . o b o | g r e p " l a c t a s e a c t i v i t y " - B 2 - A 5 | h e a d - 8 Prints: [ T e r m ] i d : G O : 0 0 0 0 0 1 6 n a m e : l a c t a s e a c t i v i t y n a m e s p a c e : m o l e c u l a r _ f u n c t i o n d e f : " C a t a l y s i s o f t h e r e a c t i o n : l a c t o s e + H 2 O = D - g l u c o s e + D - g s y n o n y m : " l a c t a s e - p h l o r i z i n h y d r o l a s e a c t i v i t y " B R O A D [ E C : 3 . 2 . 1 . s y n o n y m : " l a c t o s e g a l a c t o h y d r o l a s e a c t i v i t y " E X A C T [ E C : 3 . 2 . 1 . 1 0 8 x r e f : E C : 3 . 2 . 1 . 1 0 8
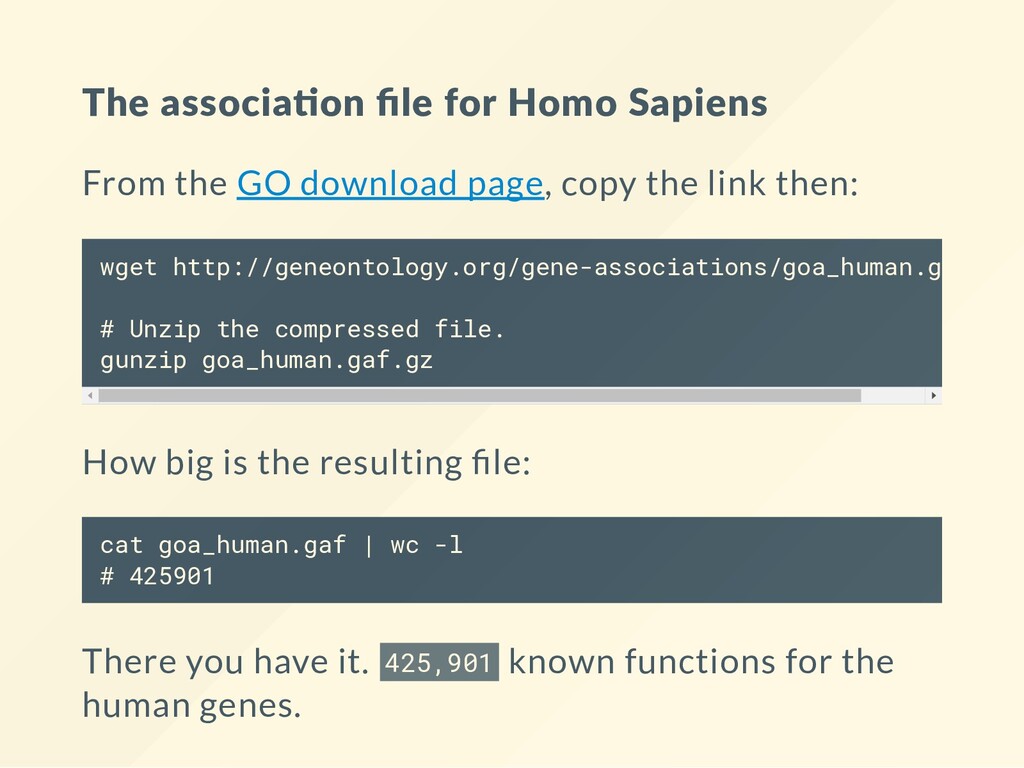
download page, copy the link then: w g e t h t t p : ∕ ∕ g e n e o n t o l o g y . o r g ∕ g e n e - a s s o c i a t i o n s ∕ g o a _ h u m a n . g a f . g z # U n z i p t h e c o m p r e s s e d f i l e . g u n z i p g o a _ h u m a n . g a f . g z How big is the resulting le: c a t g o a _ h u m a n . g a f | w c - l # 4 2 5 9 0 1 There you have it. 4 2 5 , 9 0 1 known functions for the human genes.
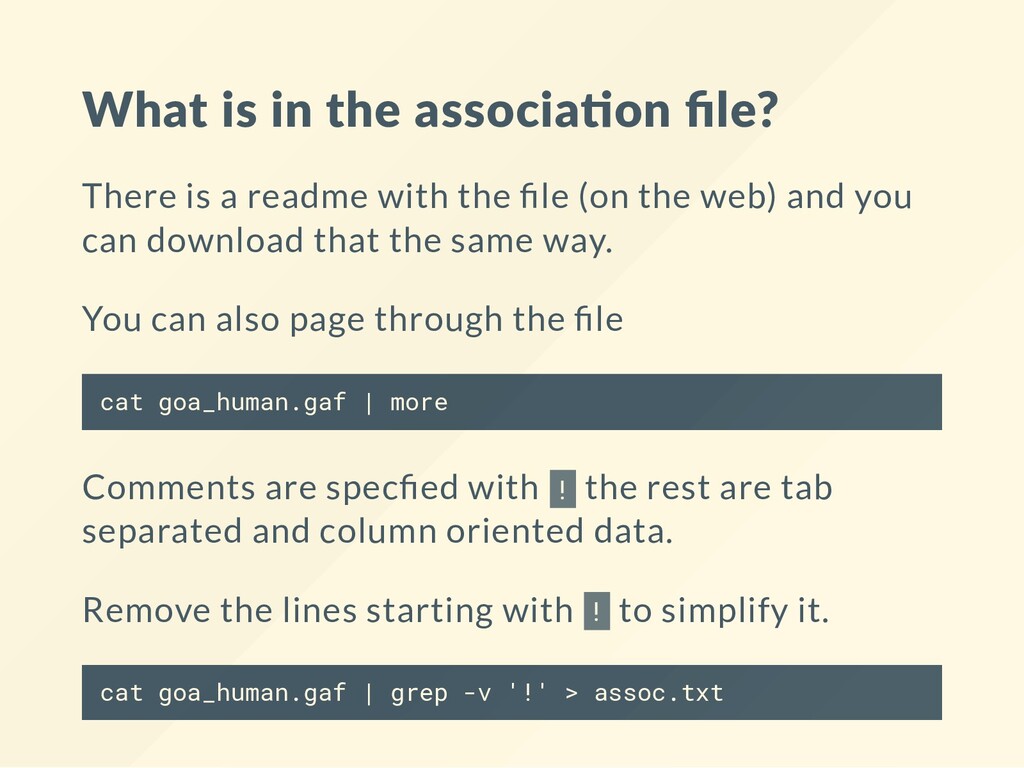
readme with the le (on the web) and you can download that the same way. You can also page through the le c a t g o a _ h u m a n . g a f | m o r e Comments are spec ed with ! the rest are tab separated and column oriented data. Remove the lines starting with ! to simplify it. c a t g o a _ h u m a n . g a f | g r e p - v ' ! ' > a s s o c . t x t
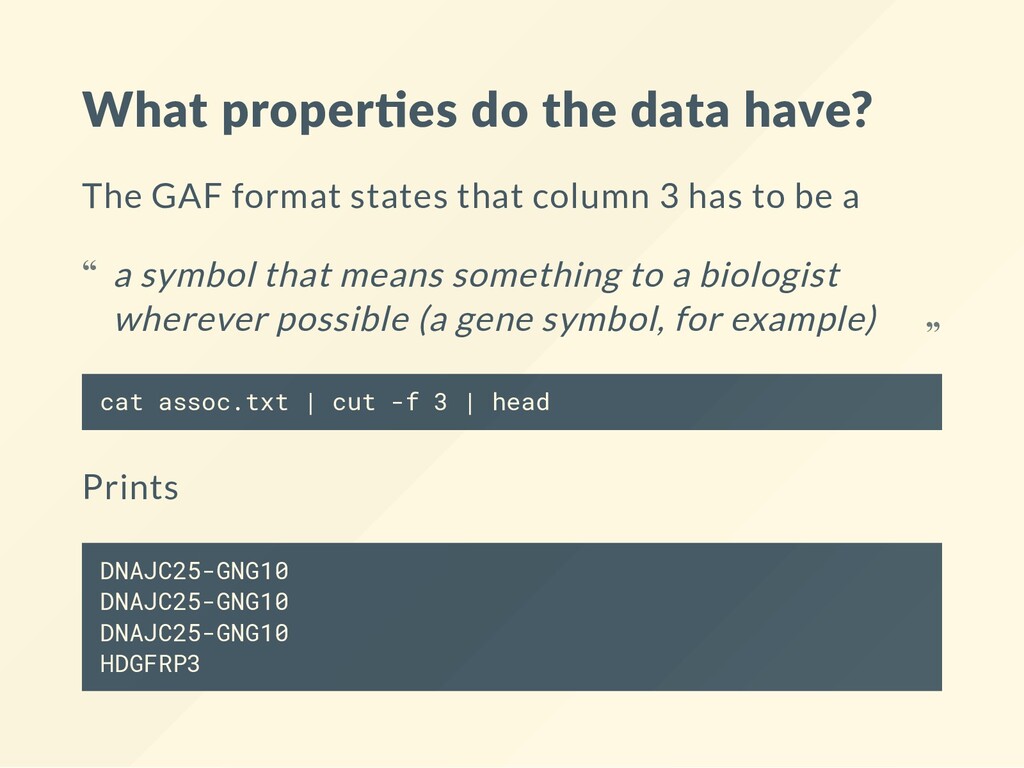
states that column 3 has to be a c a t a s s o c . t x t | c u t - f 3 | h e a d Prints D N A J C 2 5 - G N G 1 0 D N A J C 2 5 - G N G 1 0 D N A J C 2 5 - G N G 1 0 H D G F R P 3 a symbol that means something to a biologist wherever possible (a gene symbol, for example) “ “
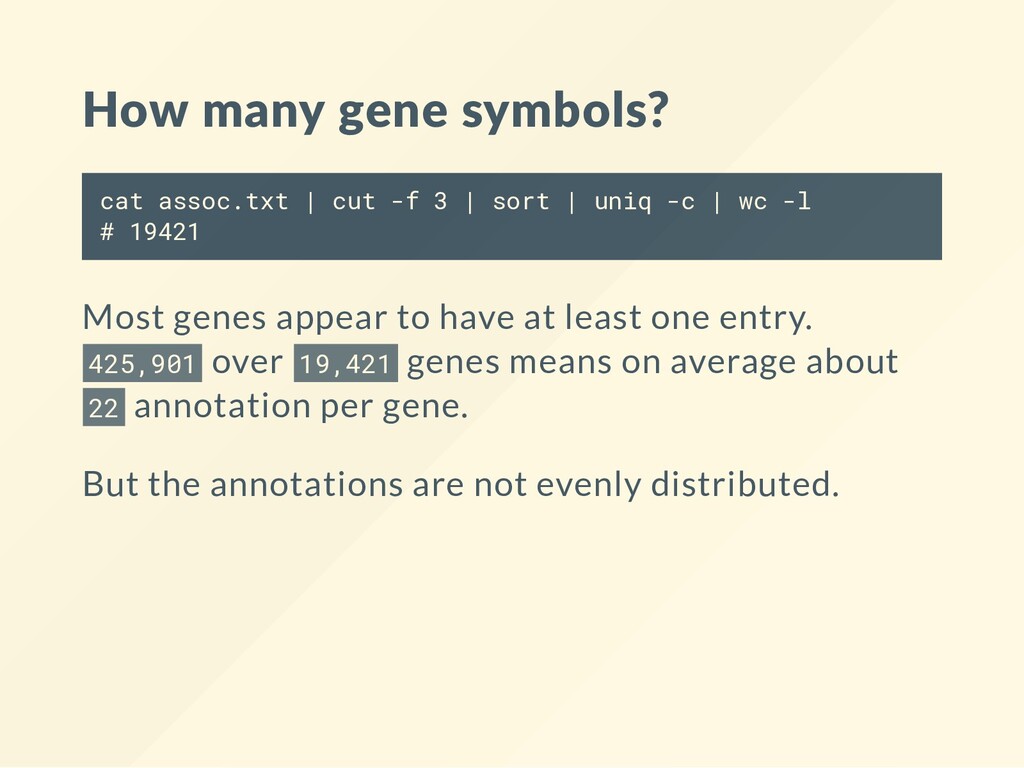
o c . t x t | c u t - f 3 | s o r t | u n i q - c | w c - l # 1 9 4 2 1 Most genes appear to have at least one entry. 4 2 5 , 9 0 1 over 1 9 , 4 2 1 genes means on average about 2 2 annotation per gene. But the annotations are not evenly distributed.
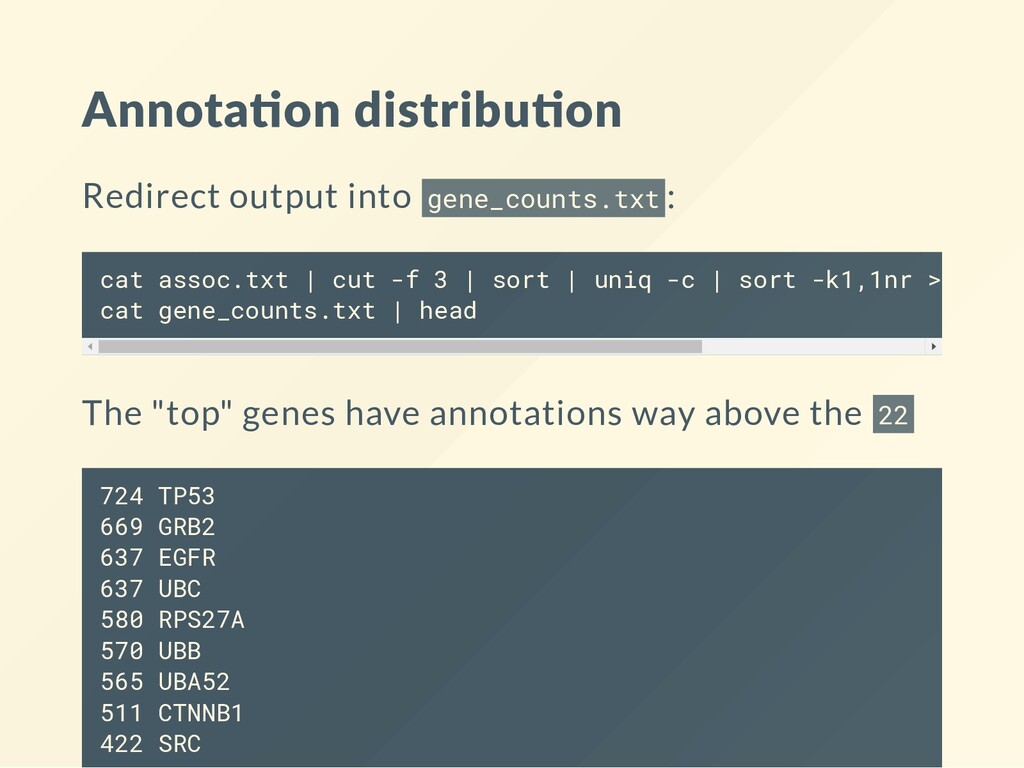
e _ c o u n t s . t x t: c a t a s s o c . t x t | c u t - f 3 | s o r t | u n i q - c | s o r t - k 1 , 1 n r > g e n e _ c a t g e n e _ c o u n t s . t x t | h e a d The "top" genes have annotations way above the 2 2 7 2 4 T P 5 3 6 6 9 G R B 2 6 3 7 E G F R 6 3 7 U B C 5 8 0 R P S 2 7 A 5 7 0 U B B 5 6 5 U B A 5 2 5 1 1 C T N N B 1 4 2 2 S R C
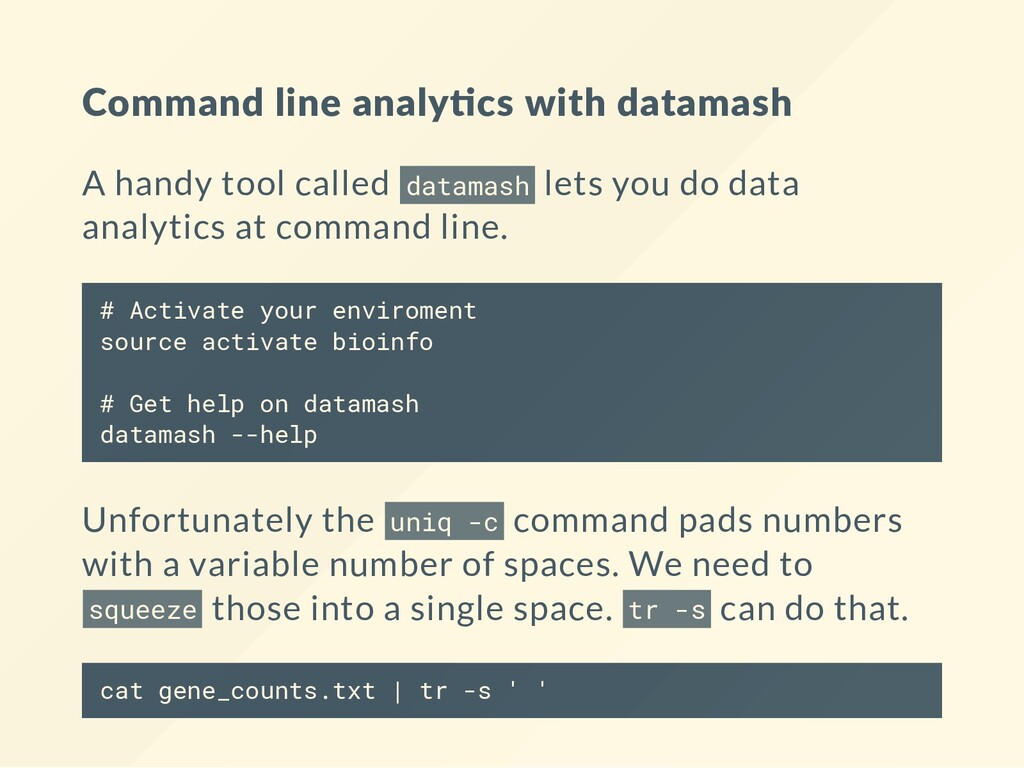
d a t a m a s h lets you do data analytics at command line. # A c t i v a t e y o u r e n v i r o m e n t s o u r c e a c t i v a t e b i o i n f o # G e t h e l p o n d a t a m a s h d a t a m a s h - - h e l p Unfortunately the u n i q - c command pads numbers with a variable number of spaces. We need to s q u e e z e those into a single space. t r - s can do that. c a t g e n e _ c o u n t s . t x t | t r - s ' '
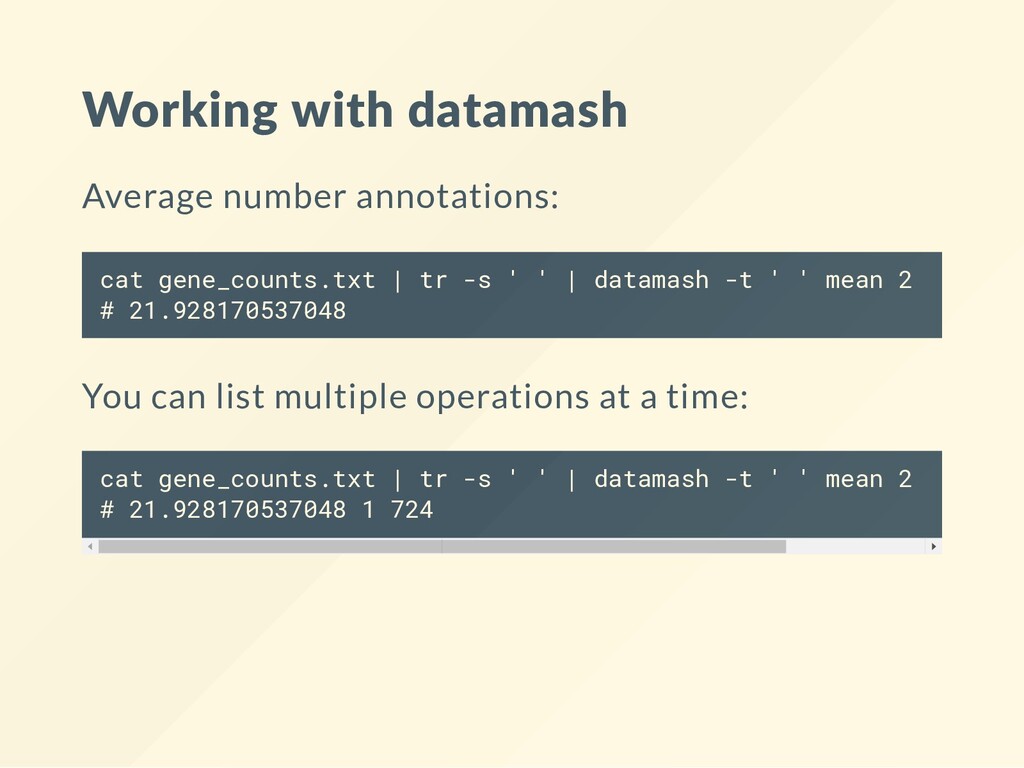
e n e _ c o u n t s . t x t | t r - s ' ' | d a t a m a s h - t ' ' m e a n 2 # 2 1 . 9 2 8 1 7 0 5 3 7 0 4 8 You can list multiple operations at a time: c a t g e n e _ c o u n t s . t x t | t r - s ' ' | d a t a m a s h - t ' ' m e a n 2 m i n 2 # 2 1 . 9 2 8 1 7 0 5 3 7 0 4 8 1 7 2 4
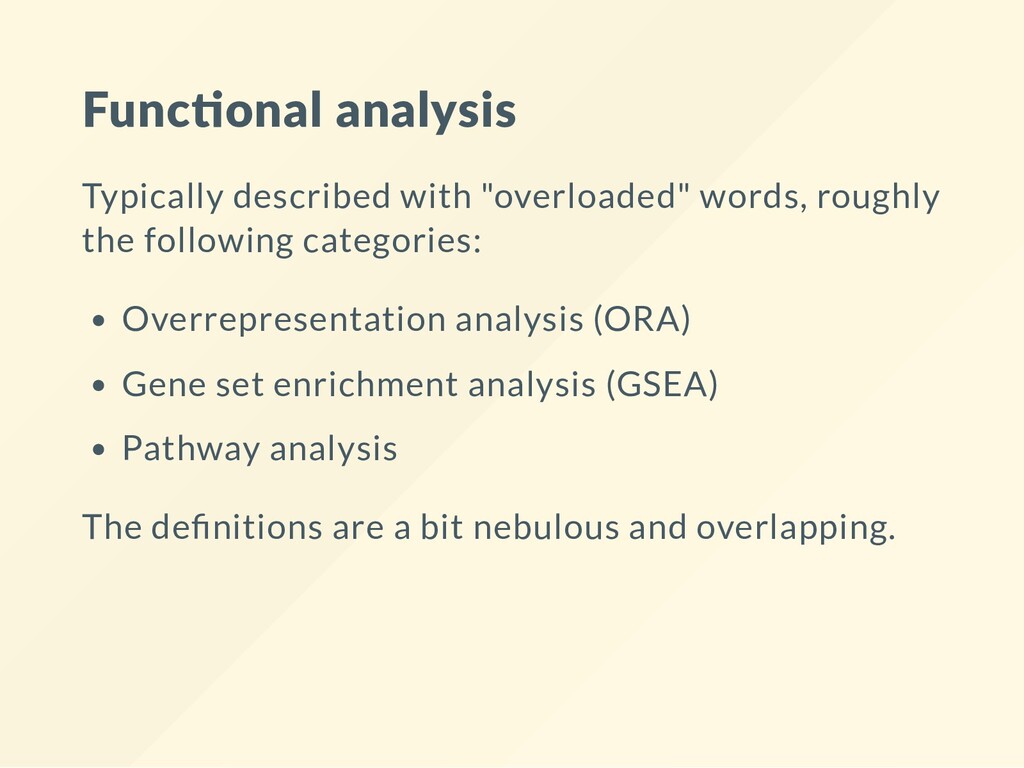
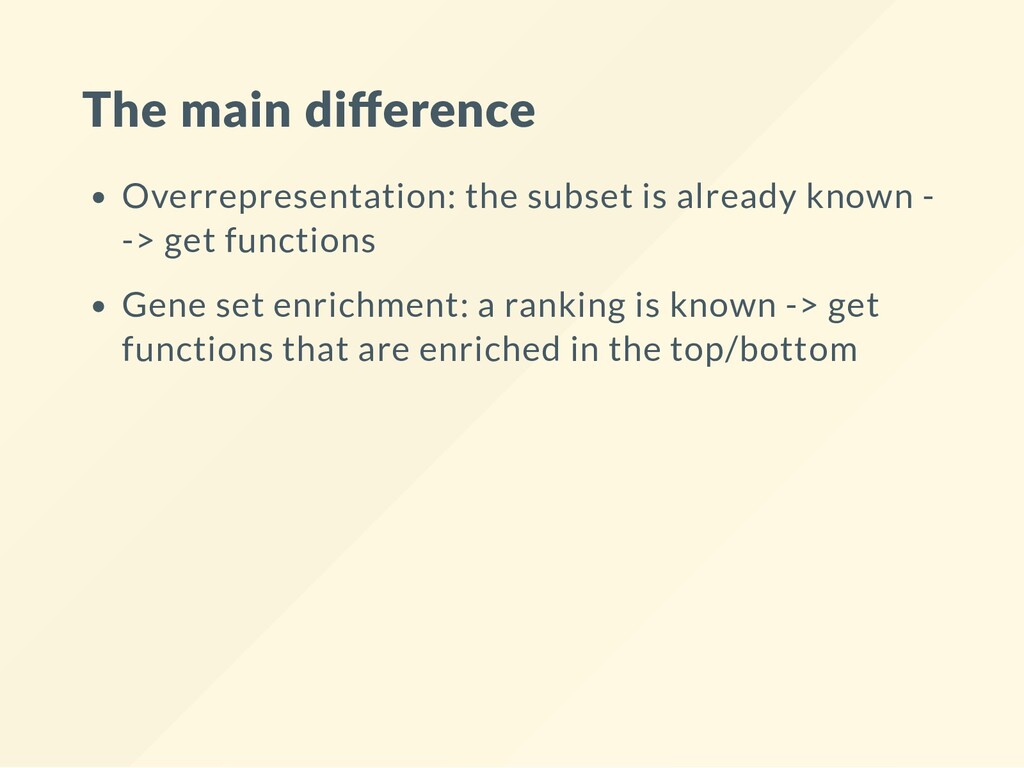
following categories: Overrepresentation analysis (ORA) Gene set enrichment analysis (GSEA) Pathway analysis The de nitions are a bit nebulous and overlapping.
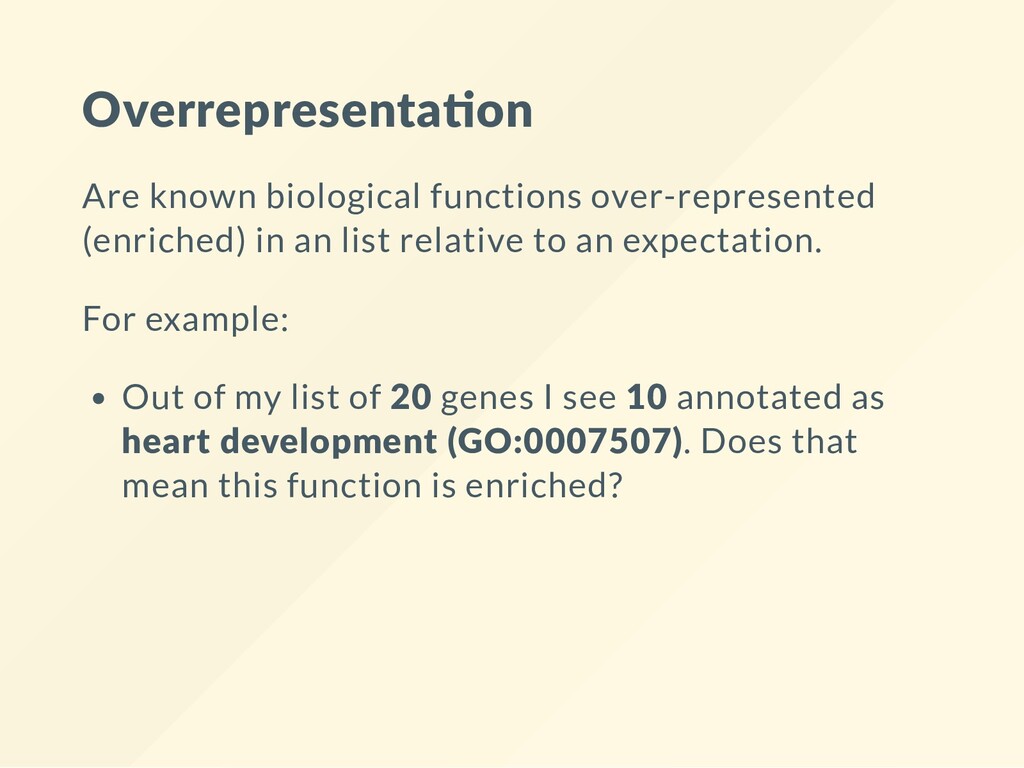
list relative to an expectation. For example: Out of my list of 20 genes I see 10 annotated as heart development (GO:0007507). Does that mean this function is enriched?
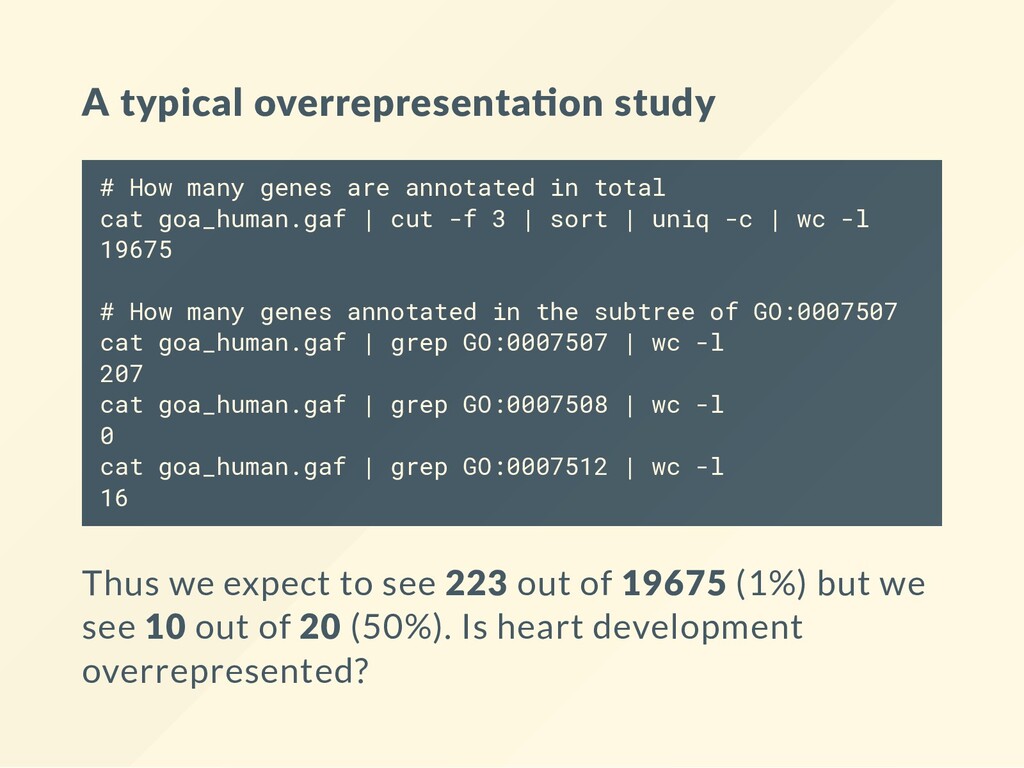
a n y g e n e s a r e a n n o t a t e d i n t o t a l c a t g o a _ h u m a n . g a f | c u t - f 3 | s o r t | u n i q - c | w c - l 1 9 6 7 5 # H o w m a n y g e n e s a n n o t a t e d i n t h e s u b t r e e o f G O : 0 0 0 7 5 0 7 c a t g o a _ h u m a n . g a f | g r e p G O : 0 0 0 7 5 0 7 | w c - l 2 0 7 c a t g o a _ h u m a n . g a f | g r e p G O : 0 0 0 7 5 0 8 | w c - l 0 c a t g o a _ h u m a n . g a f | g r e p G O : 0 0 0 7 5 1 2 | w c - l 1 6 Thus we expect to see 223 out of 19675 (1%) but we see 10 out of 20 (50%). Is heart development overrepresented?
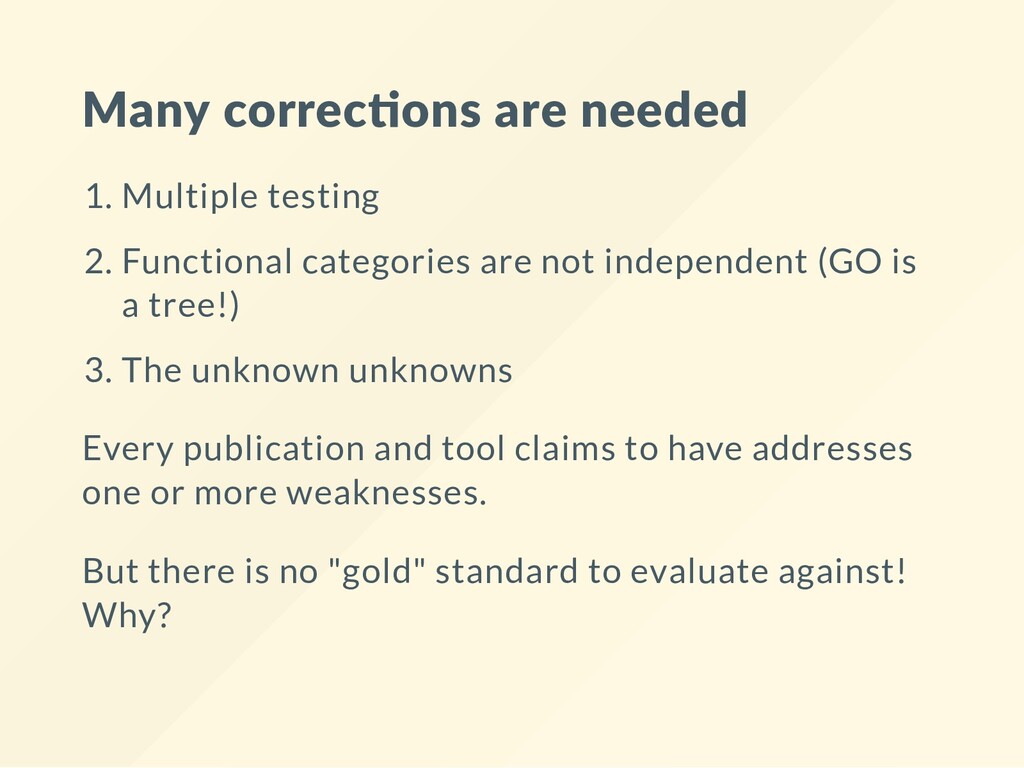
categories are not independent (GO is a tree!) 3. The unknown unknowns Every publication and tool claims to have addresses one or more weaknesses. But there is no "gold" standard to evaluate against! Why?
with values 2. All genes/transcripts should be present 3. The values should allow a ranking of the rows (high/low) The question it answers: Are there lists of functions common to genes listed in the top/bottom
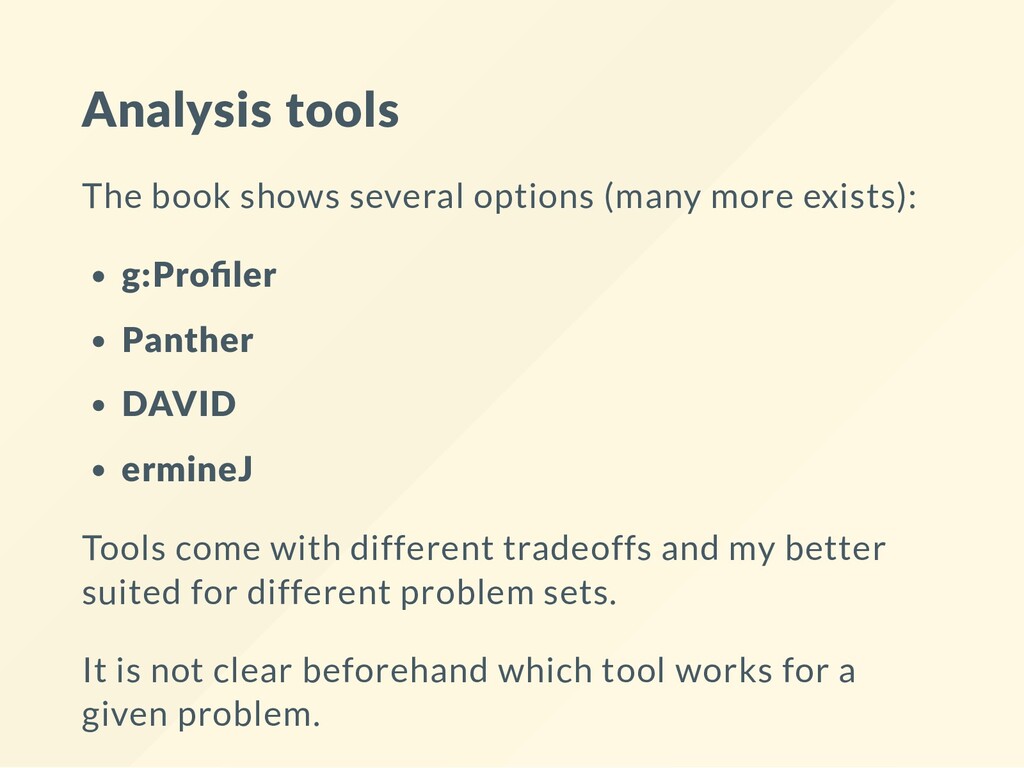
g:Profiler Panther DAVID ermineJ Tools come with different tradeoffs and my better suited for different problem sets. It is not clear beforehand which tool works for a given problem.
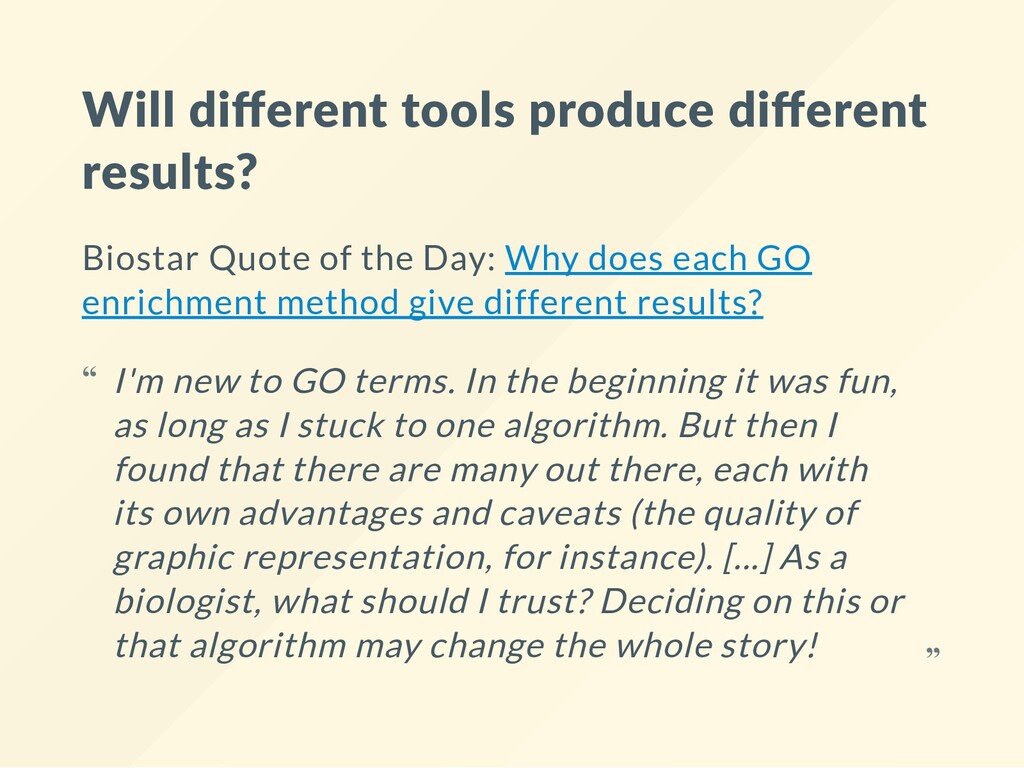
Day: Why does each GO enrichment method give different results? I'm new to GO terms. In the beginning it was fun, as long as I stuck to one algorithm. But then I found that there are many out there, each with its own advantages and caveats (the quality of graphic representation, for instance). [...] As a biologist, what should I trust? Deciding on this or that algorithm may change the whole story! “ “
a research project already you may have your own data available. Use that when you follow the examples in the book. You can also make your own data. Example: take the top 20 most annotated genes from GO and see what is common about them. You may also download the g e n e - l i s t . t x t from the lecture website. The same applies to the homework.