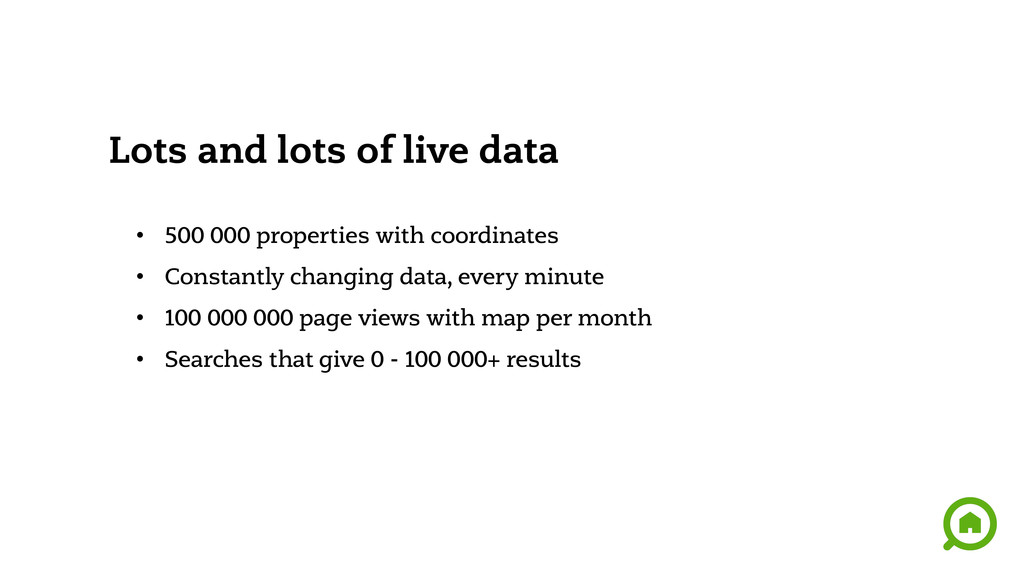
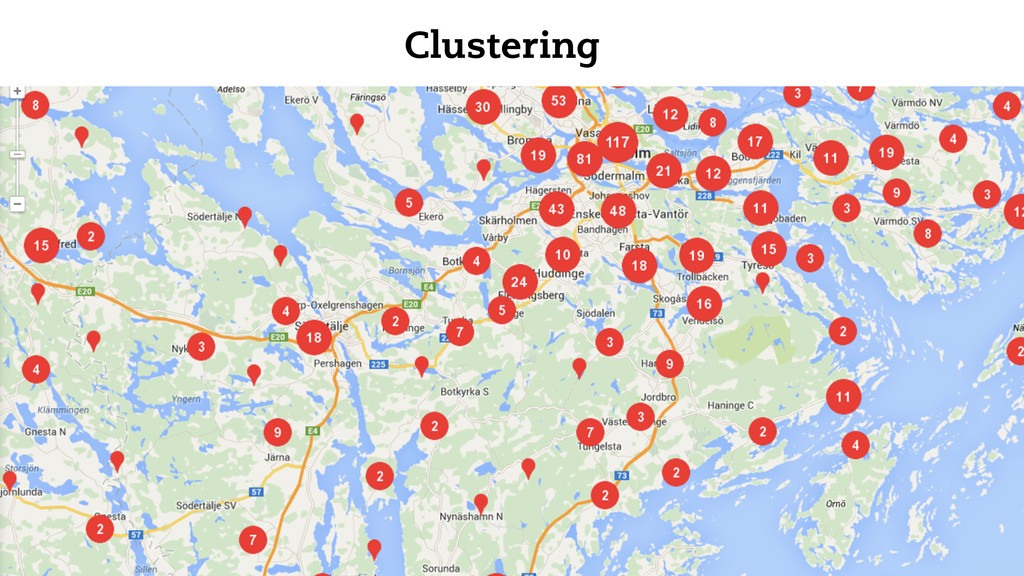
Imagine you were to present large amounts of constantly changing, live data to the users on a web map. Imagine it was on a website with high traffic volume(83 millon page views per month) and high requirement on quick response time. What software would you use to solve this challenge?
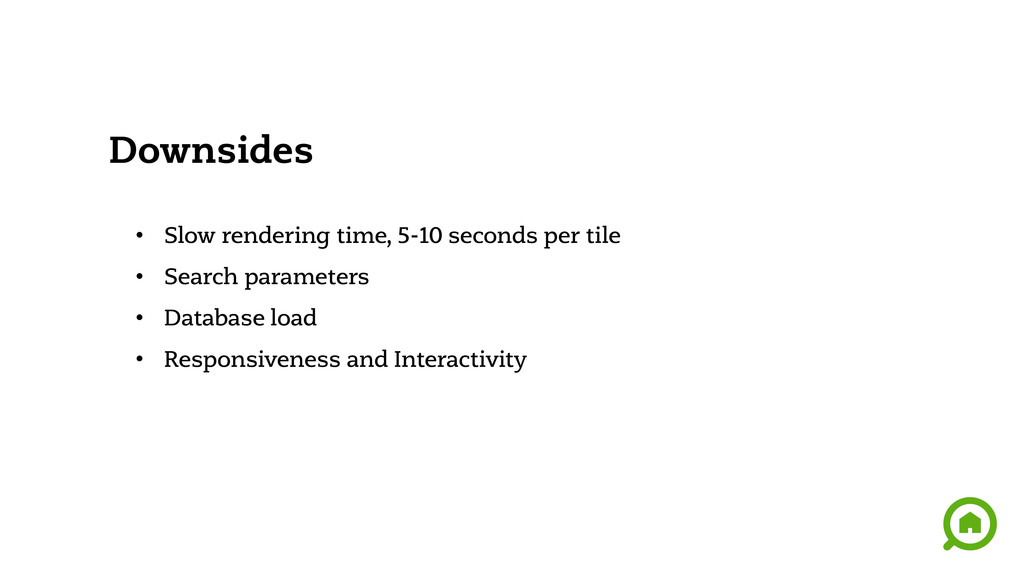
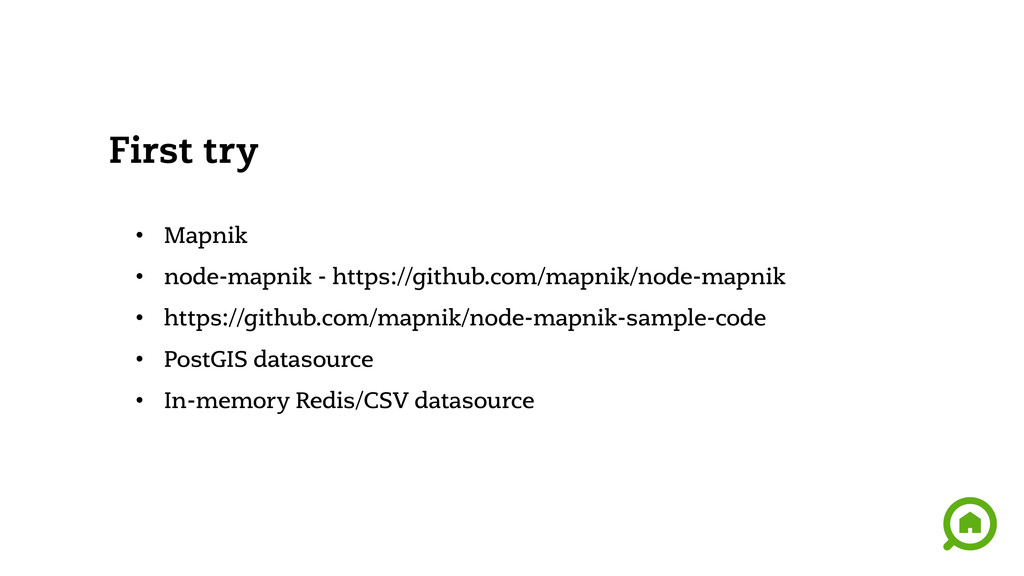
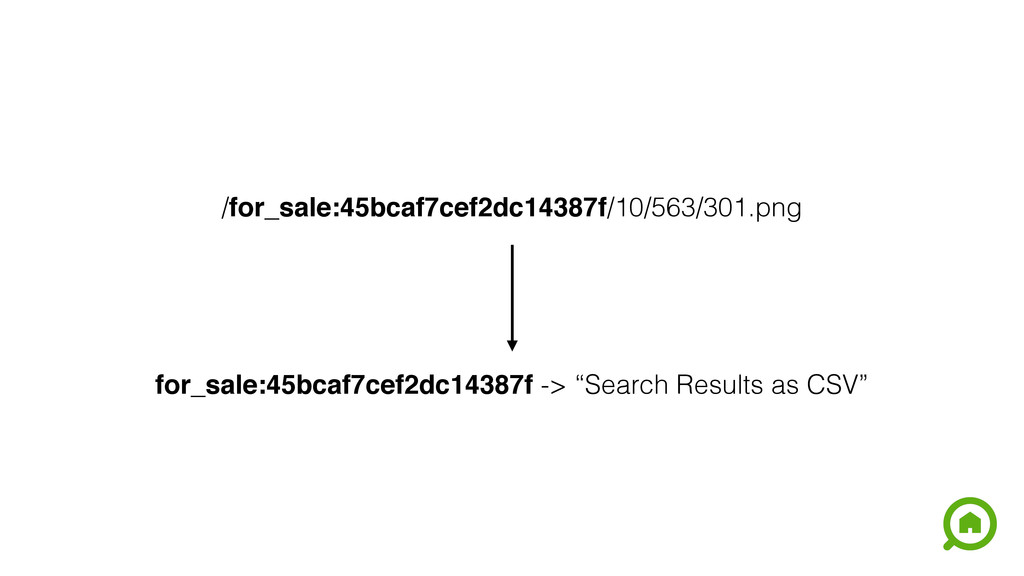
This presentation will cover the journey that Hemnet, a leading real estate property portal in Sweden, took while remaking a vital part of the website. A journey, during which a number of existing map servers, such as Geoserver, were put on test, but were not fast and flexible enough. A journey, that ended with creating a custom tileserver with technologies like Mapnik to make it as fast and efficient as possible.
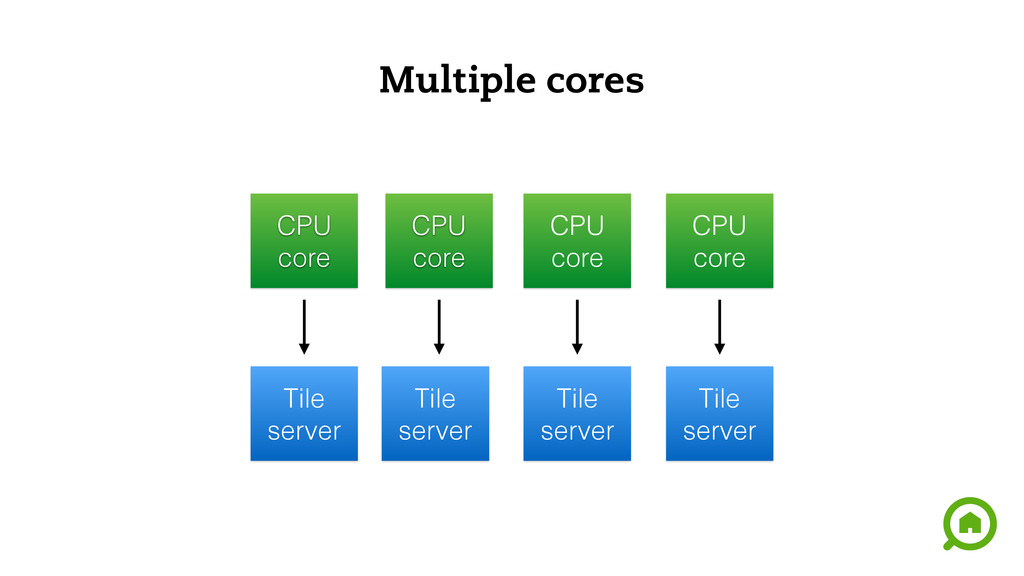
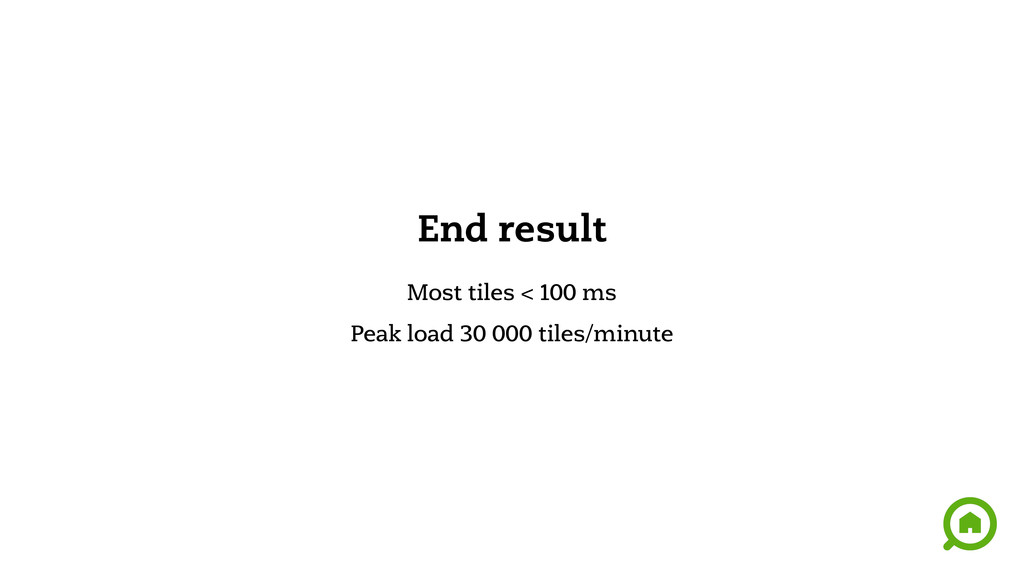
During the presentation we will cover the challenges we had and how we faced them with different technologies available. We’ll take a look at how we did performance tests and how we rolled everything out to the masses.


 kaminashi
 ludicmind
 yamanoku
 rfdnxbro
 occhi
 prog893
 genda
 teamlab
 syuchimu
 codmoninc
 codatum
 nttcom
 lauravandoore
 shpigford
 jacobian
 speakerdeck
 sferik
 ivargrimstad
 uxyall
 csswizardry
 jcasabona
 jmmastey
 skipperchong
 addyosmani