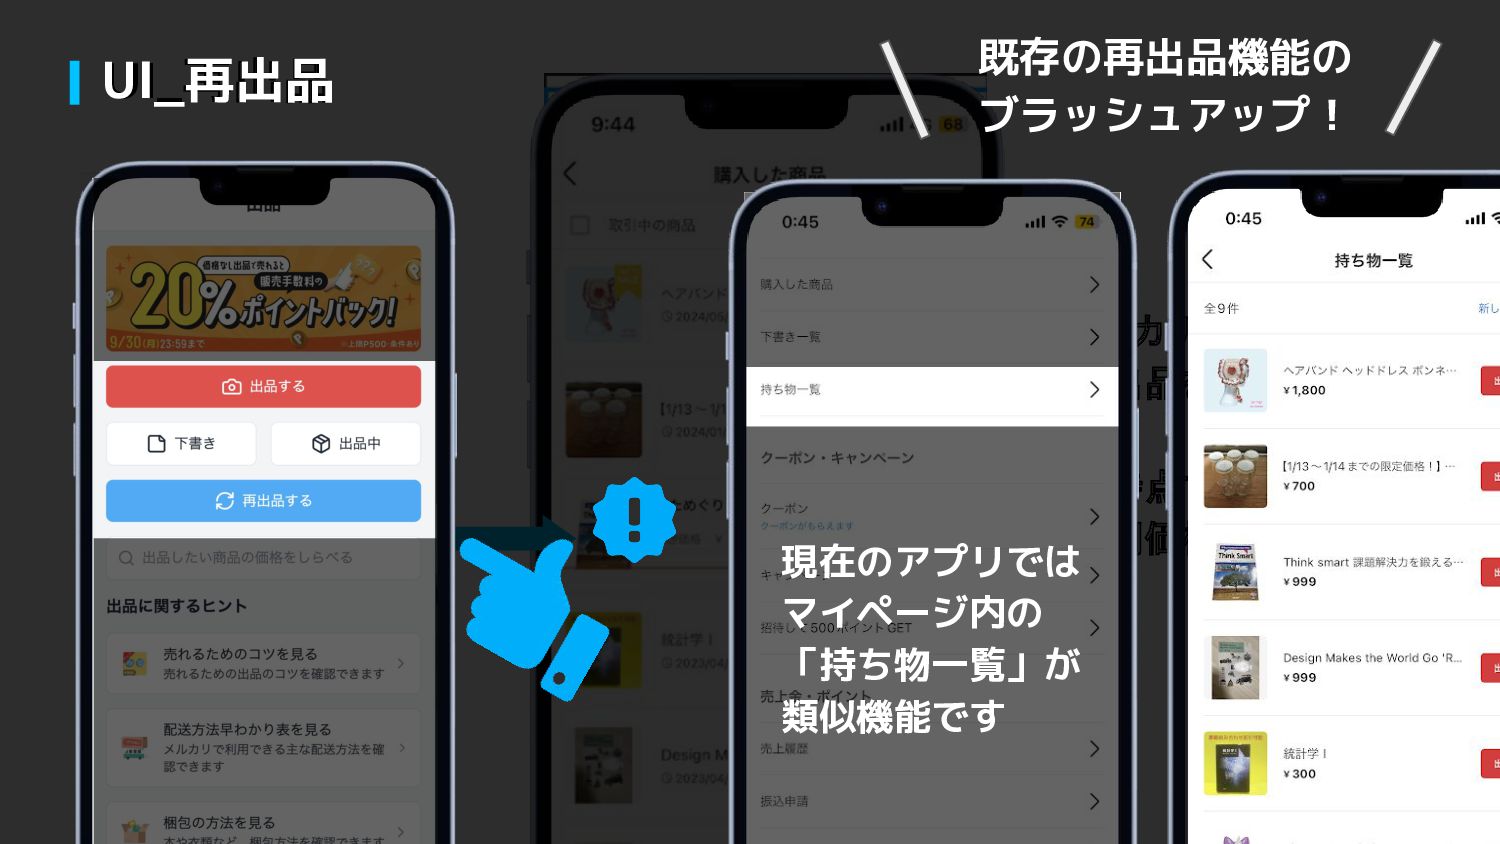
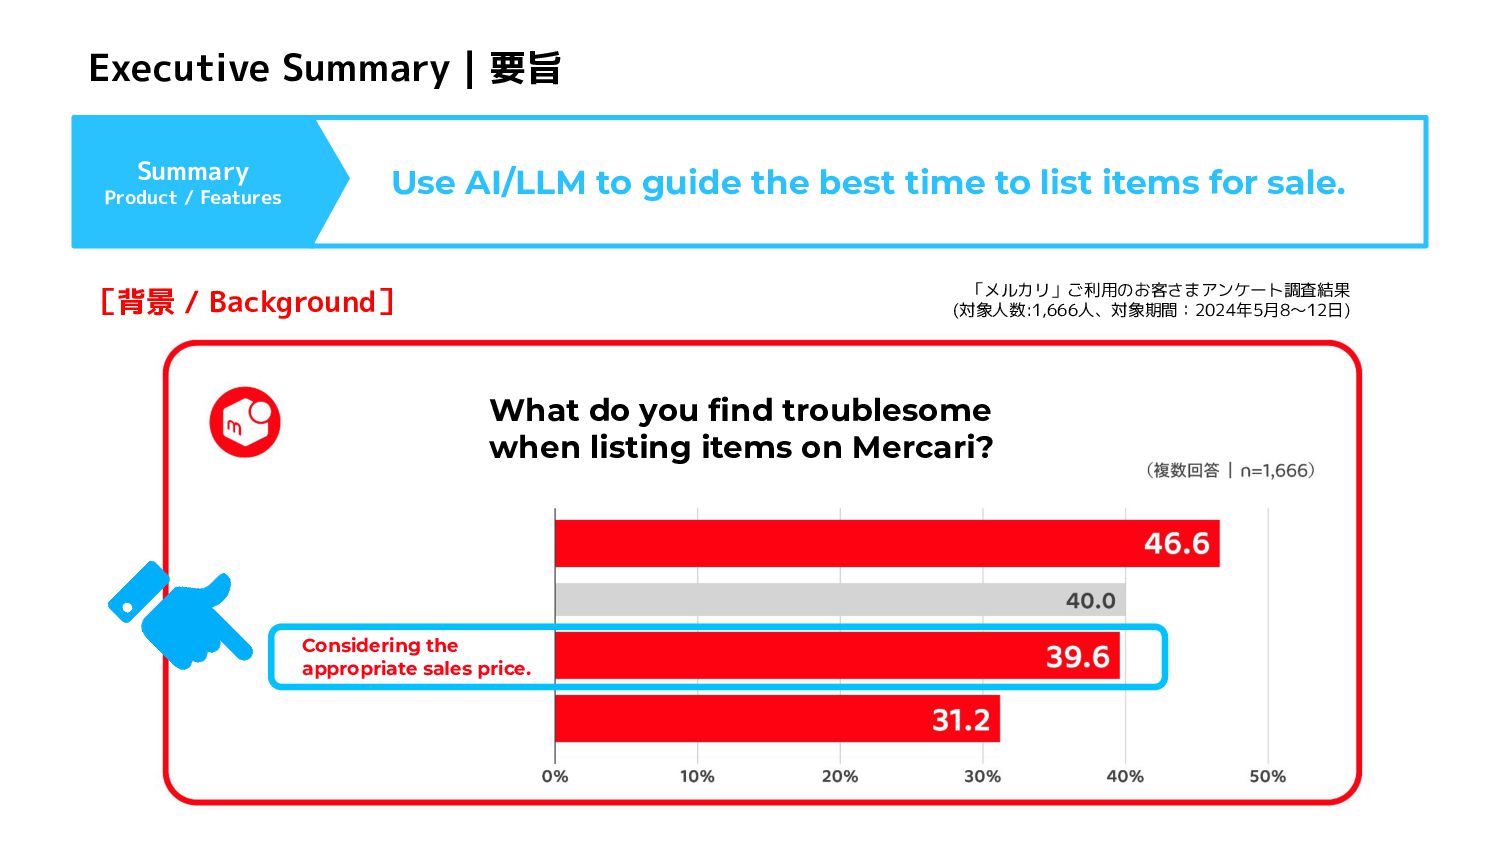
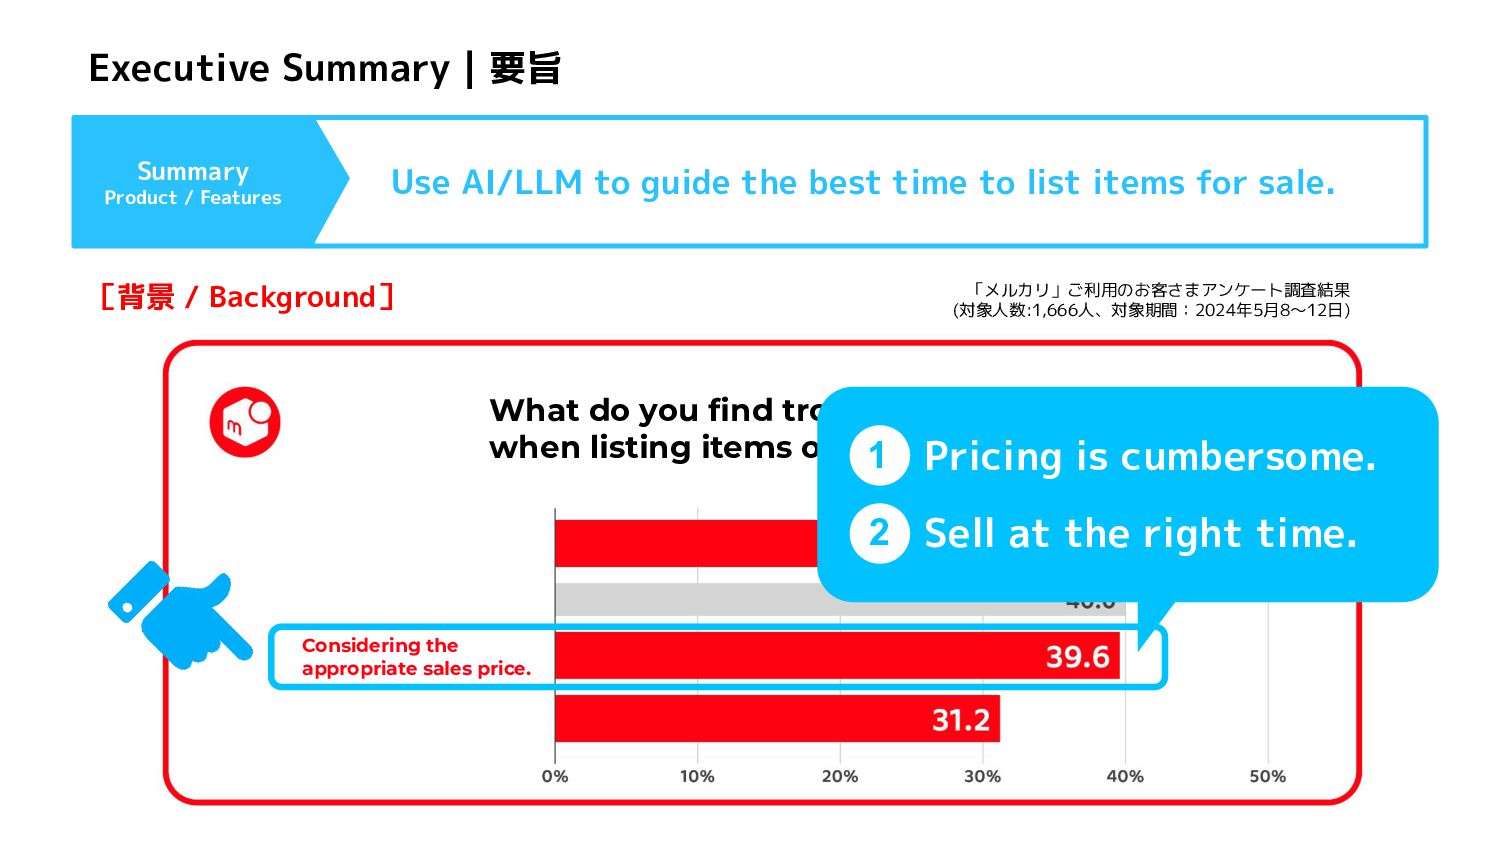
time to list items for sale. Executive Summary|要旨 [背景 / Background] 「メルカリ」ご利用のお客さまアンケート調査結果 (対象人数:1,666人、対象期間:2024年5月8〜12日) What do you find troublesome when listing items on Mercari? Considering the appropriate sales price.
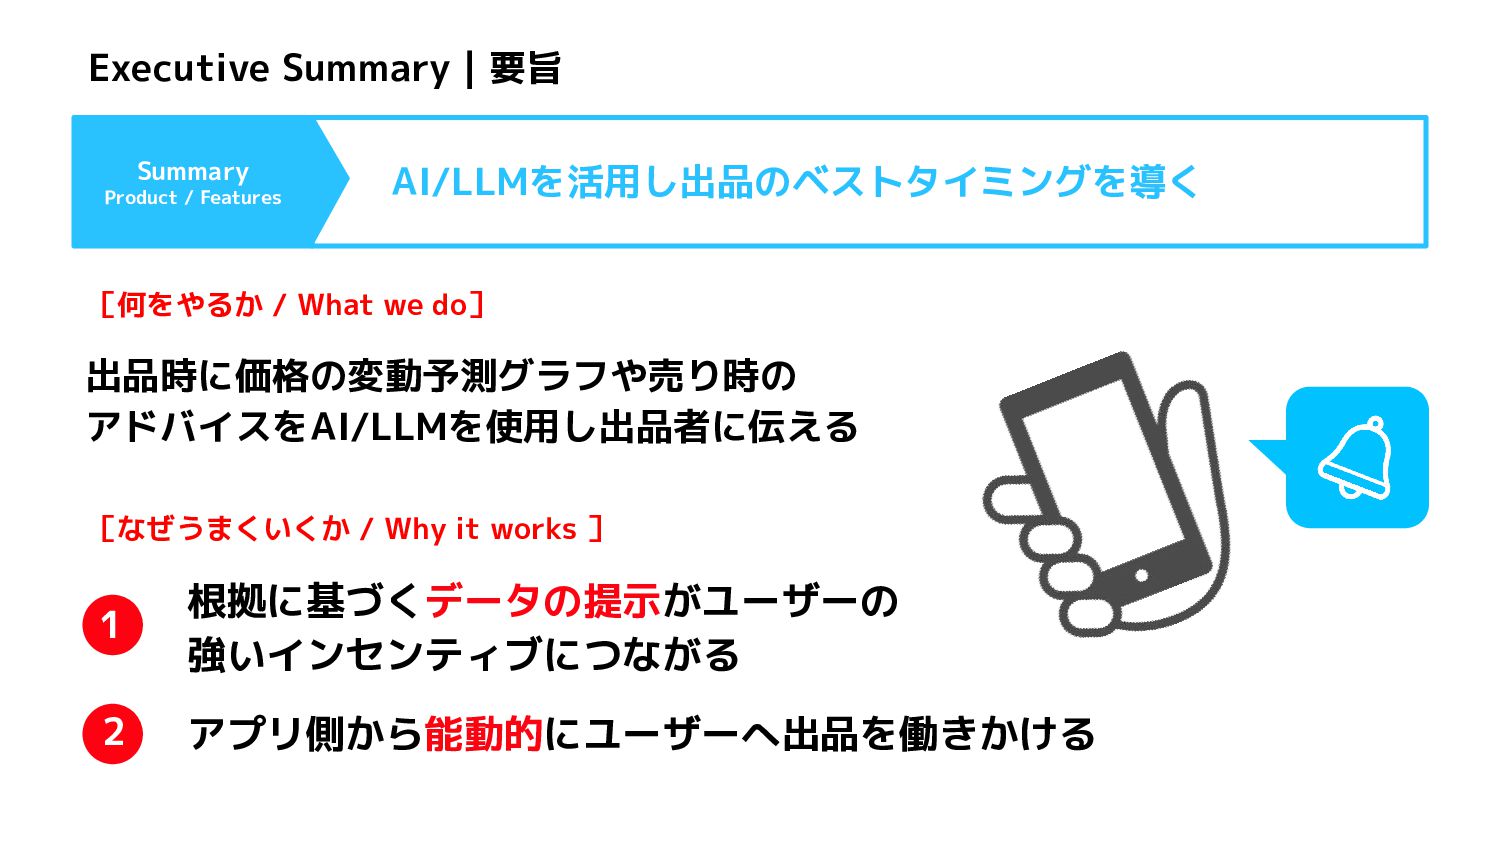
troublesome when listing items on Mercari? [背景 / Background] Pricing is cumbersome. 1 2 「メルカリ」ご利用のお客さまアンケート調査結果 (対象人数:1,666人、対象期間:2024年5月8〜12日) Sell at the right time. Considering the appropriate sales price. Use AI/LLM to guide the best time to list items for sale.
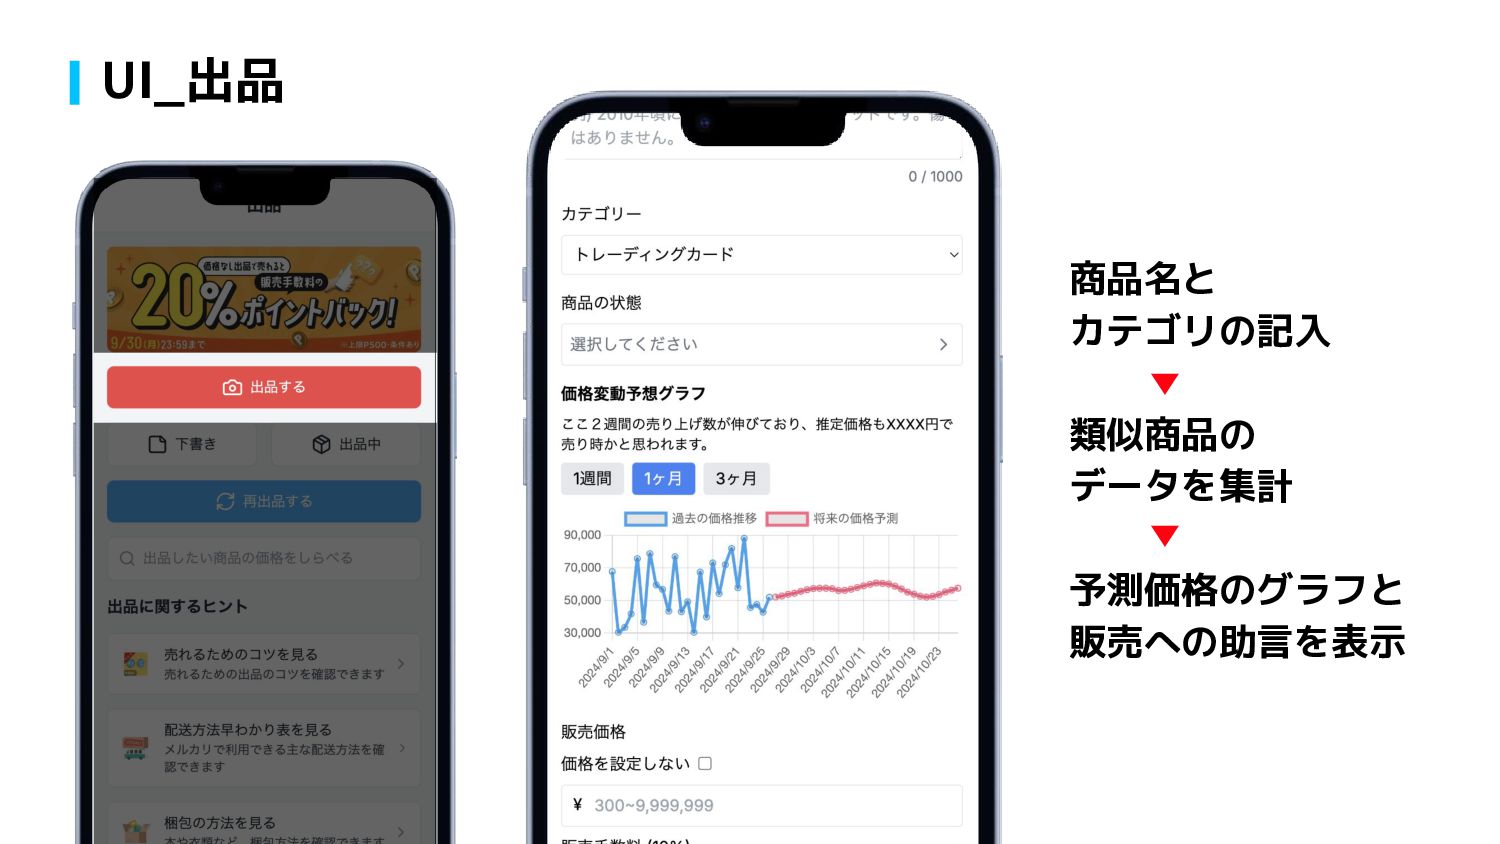
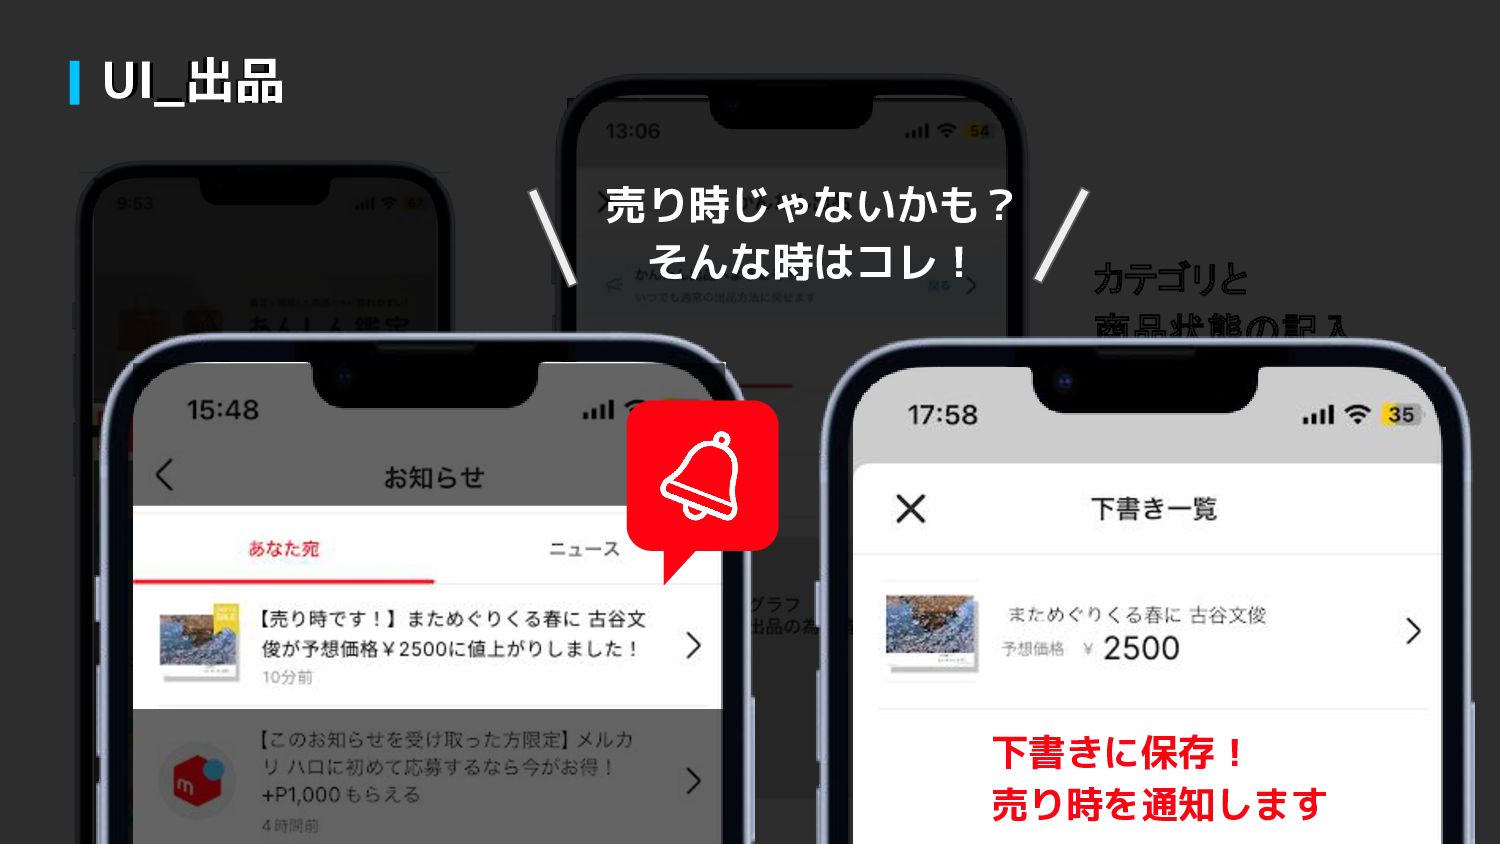
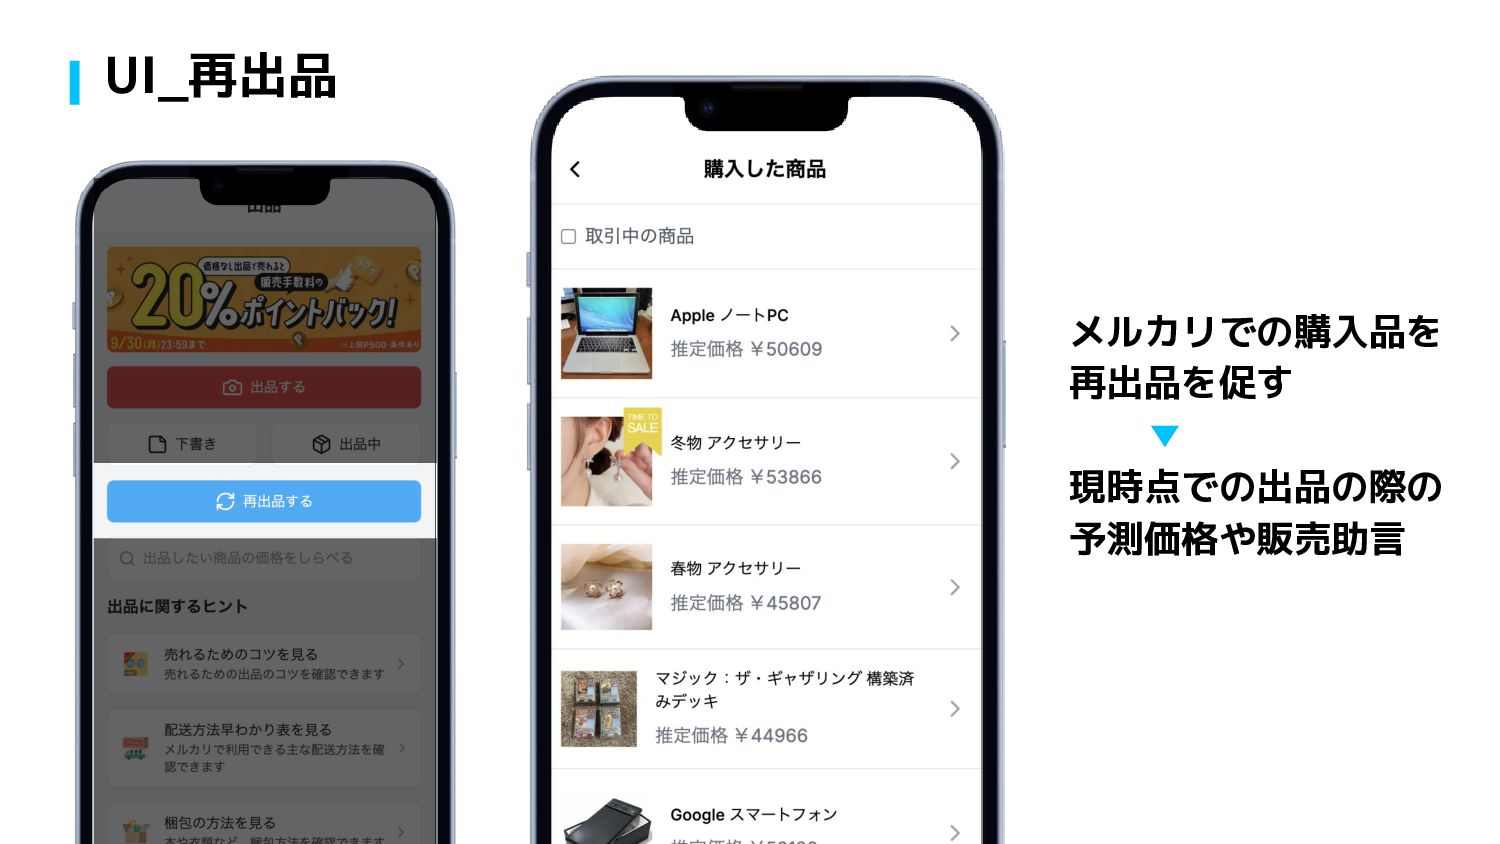
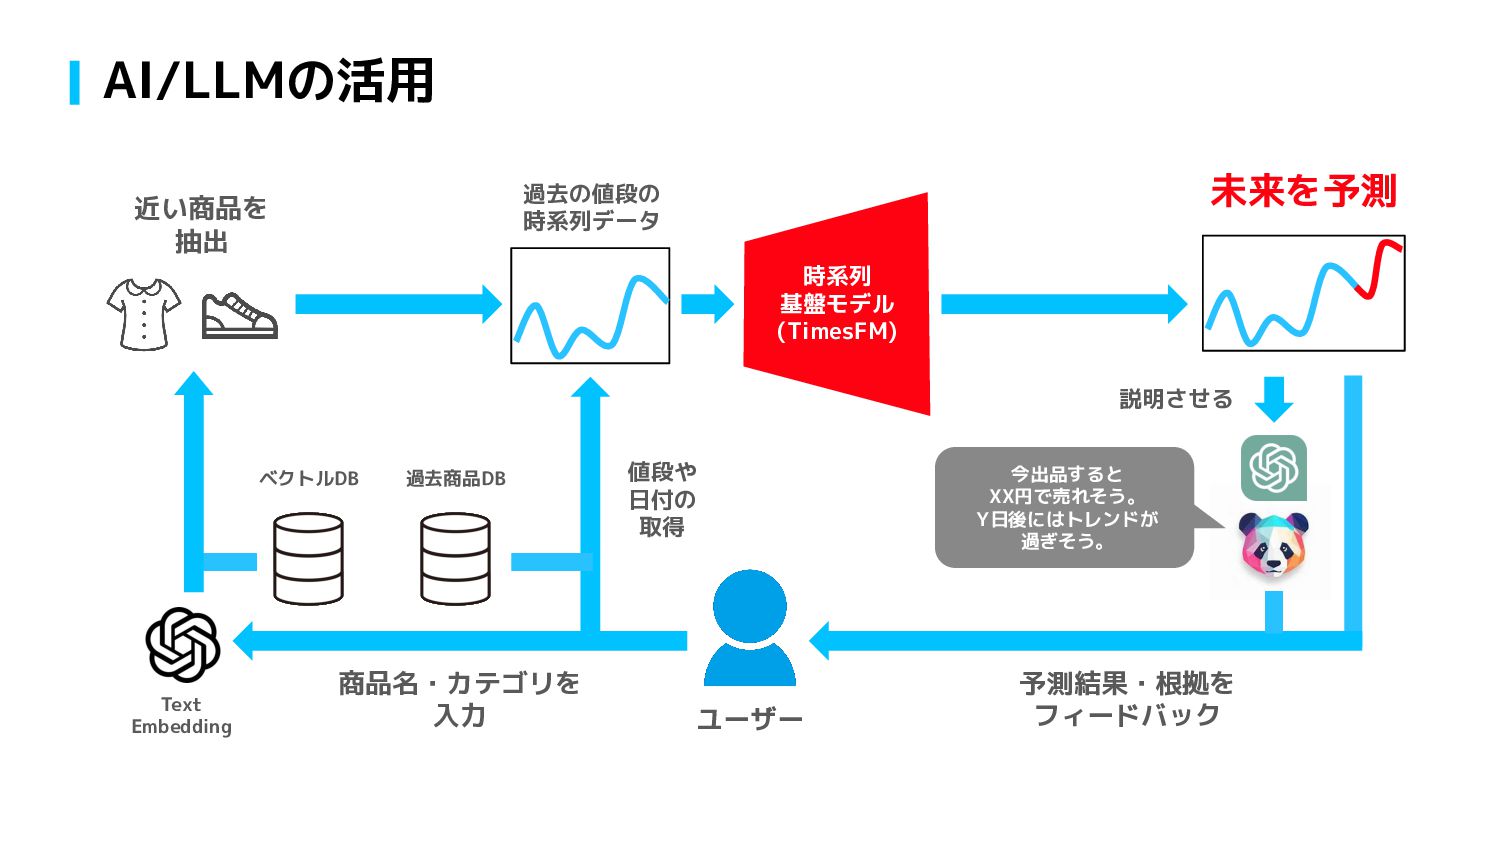
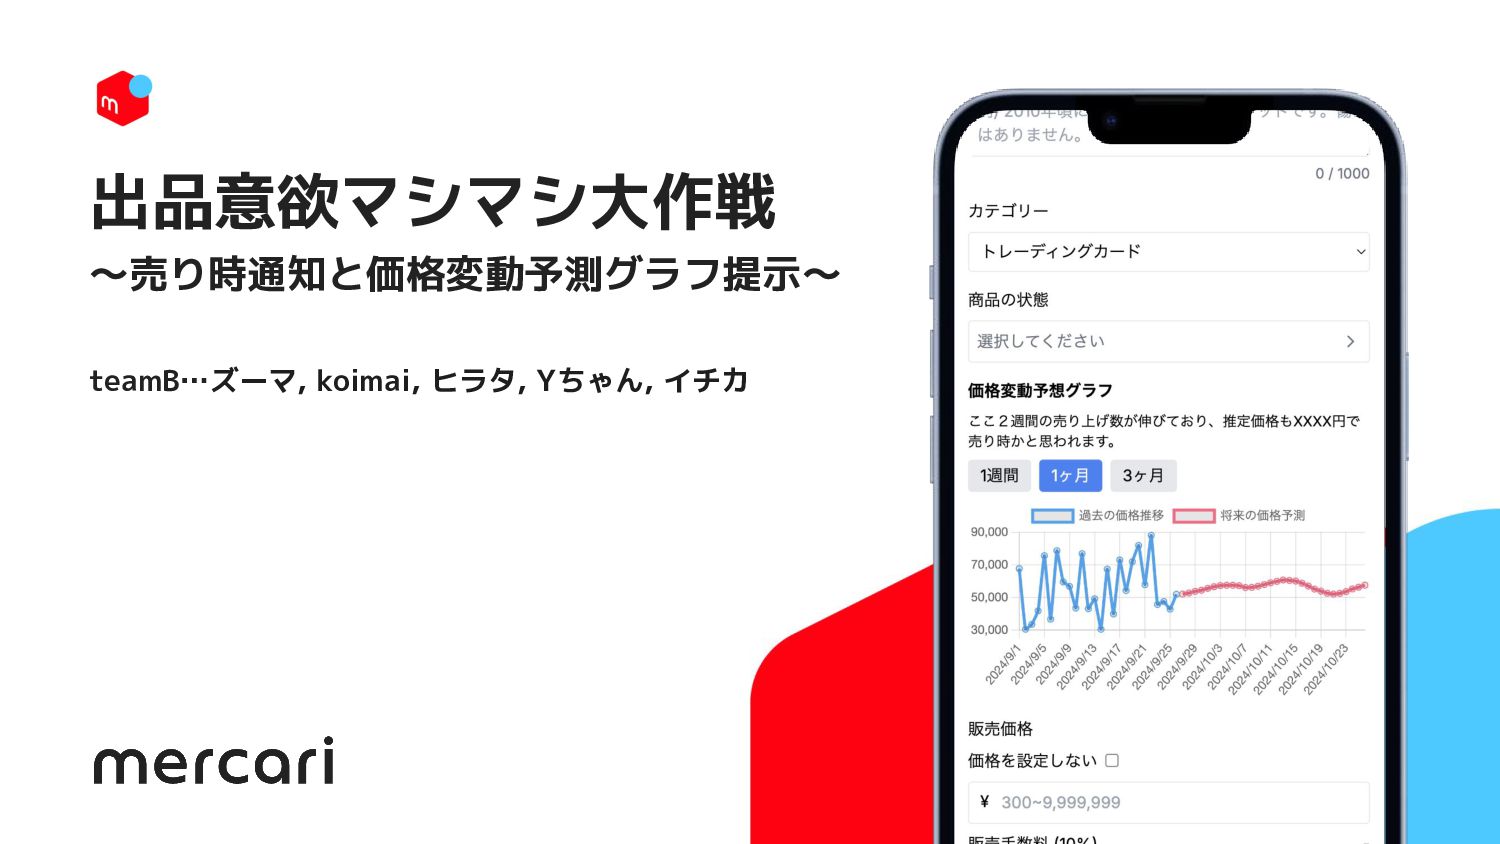
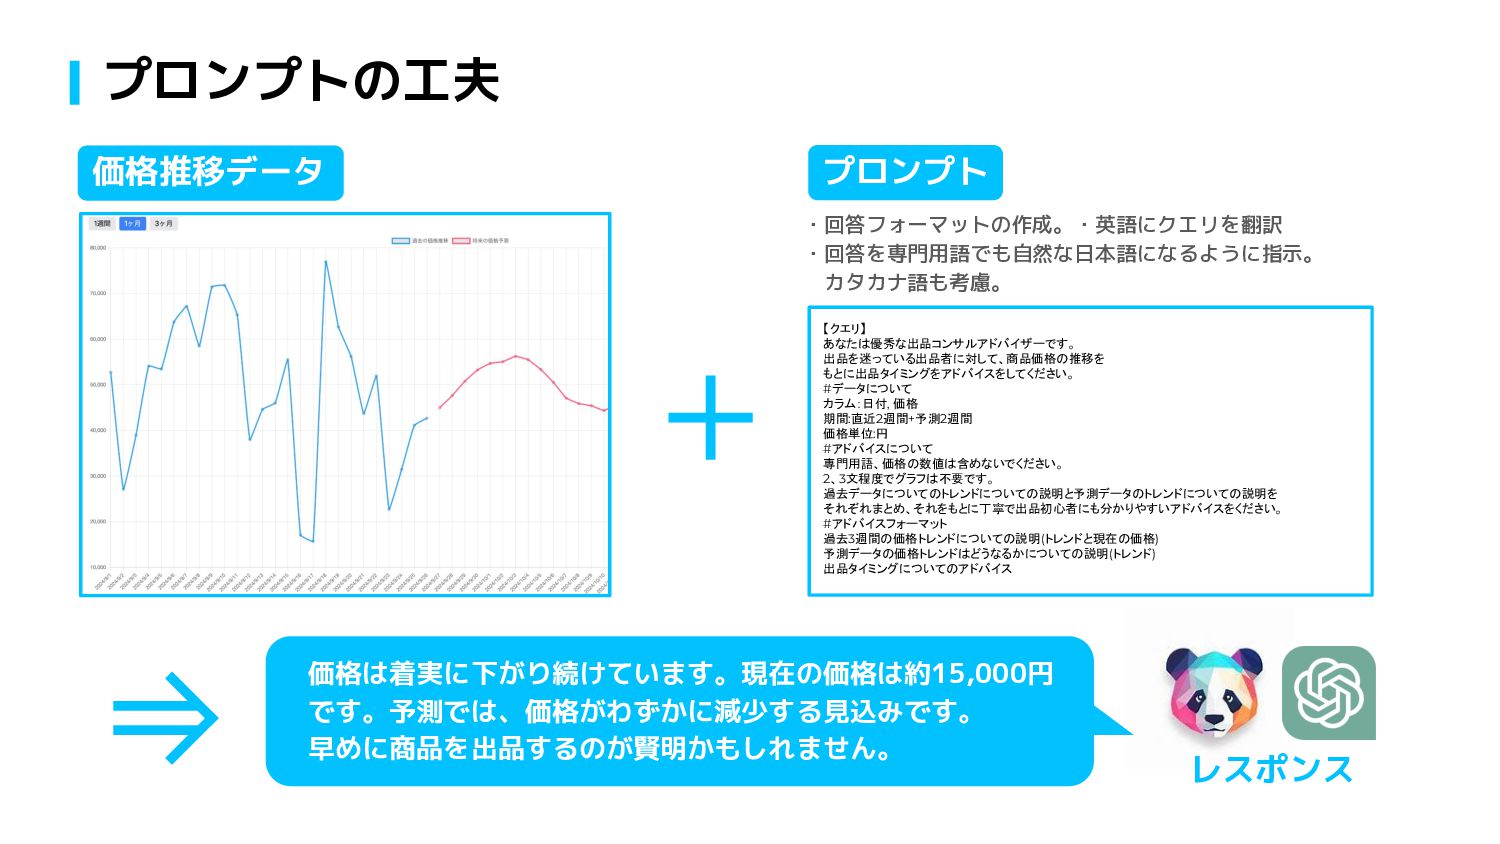
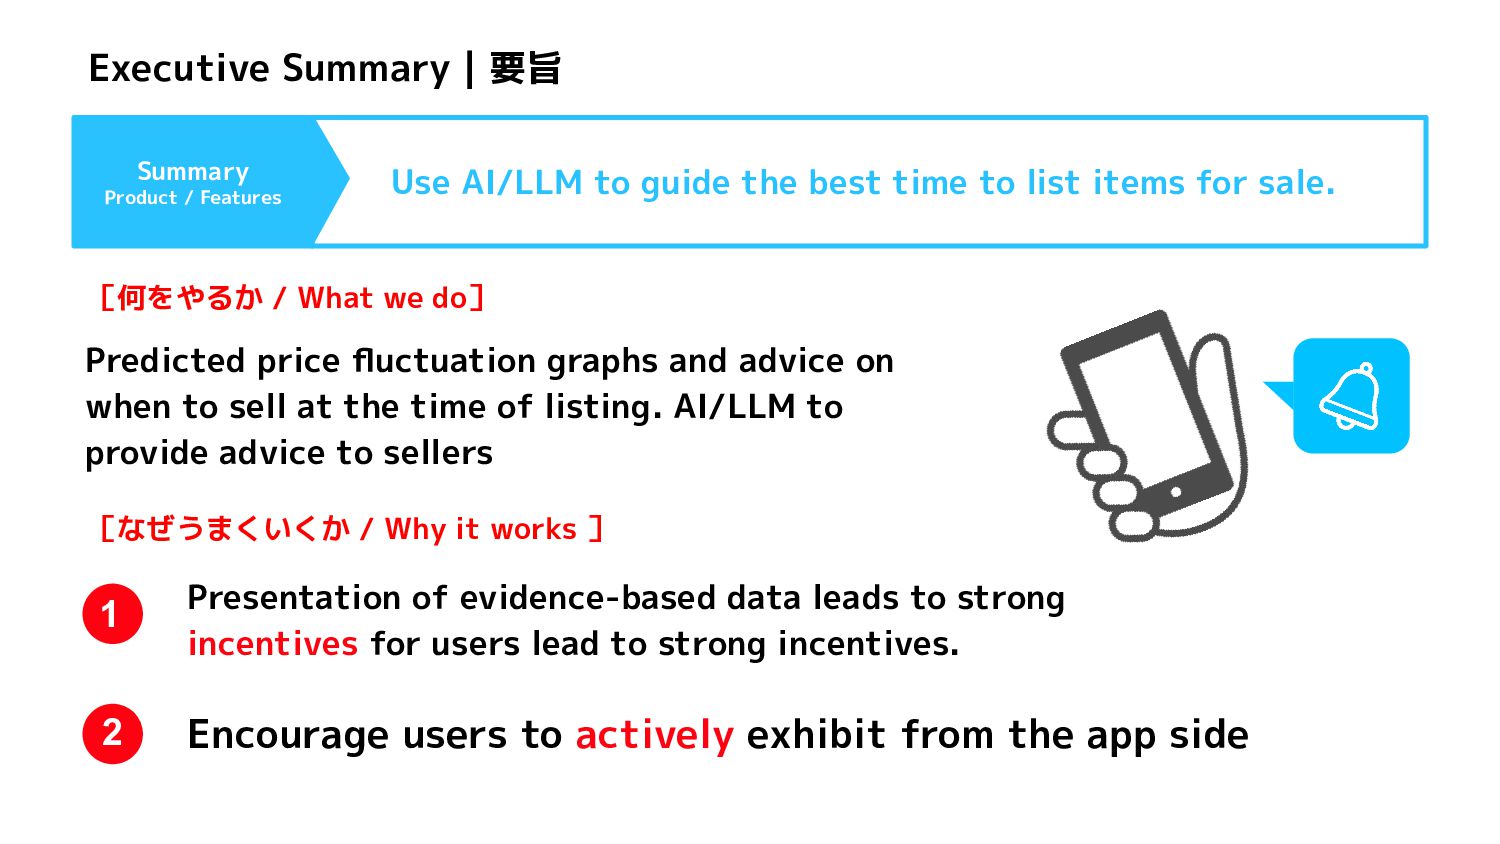
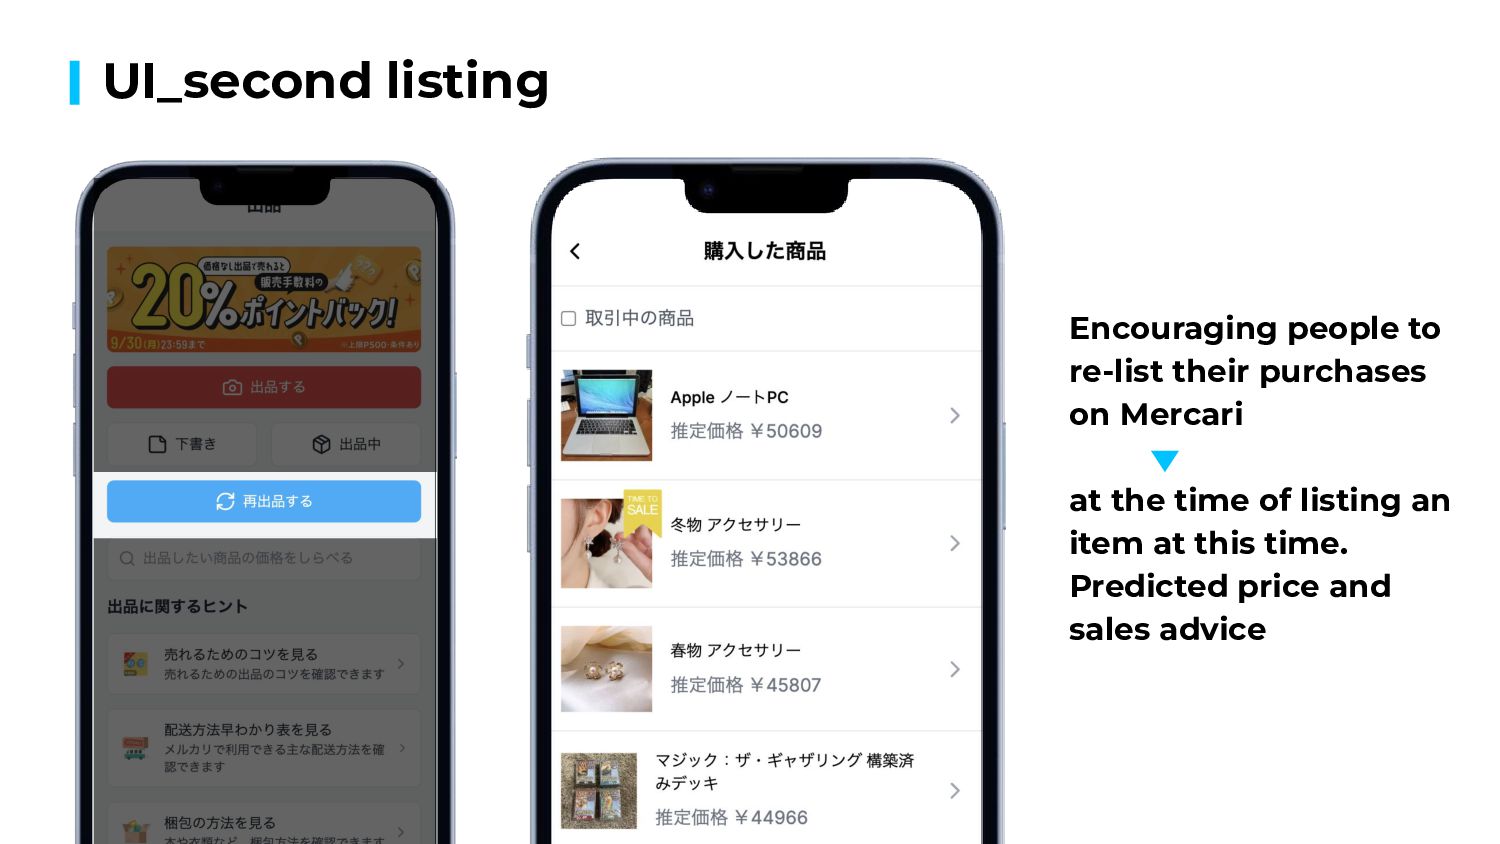
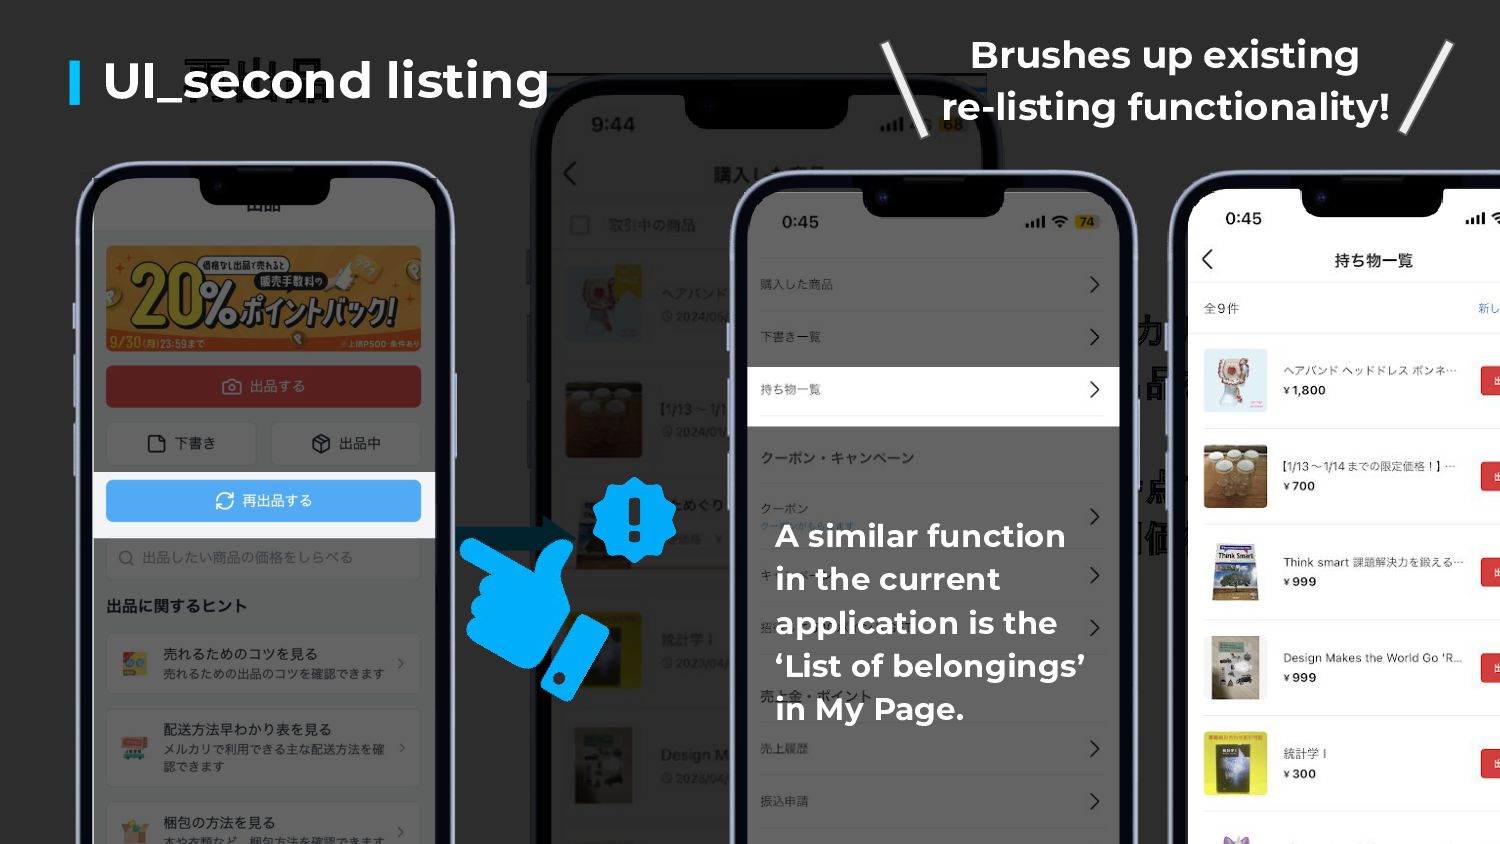
do] Predicted price fluctuation graphs and advice on when to sell at the time of listing. AI/LLM to provide advice to sellers Encourage users to actively exhibit from the app side [なぜうまくいくか / Why it works ] 1 2 Presentation of evidence-based data leads to strong incentives for users lead to strong incentives. Use AI/LLM to guide the best time to list items for sale.
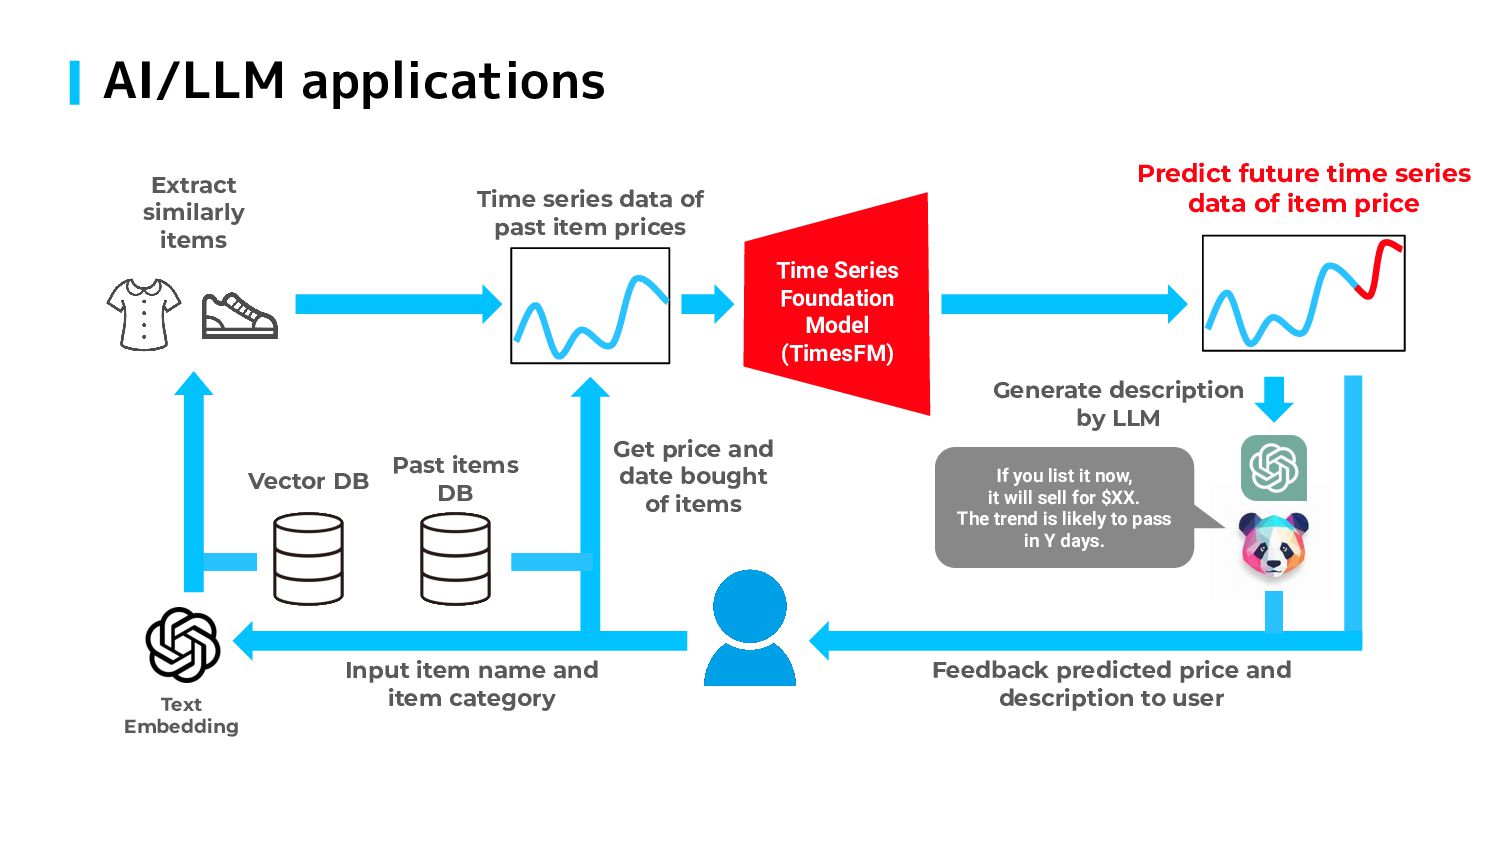
you list it now, it will sell for $XX. The trend is likely to pass in Y days. Extract similarly items Vector DB Past items DB Get price and date bought of items Time series data of past item prices Predict future time series data of item price Input item name and item category Generate description by LLM Feedback predicted price and description to user
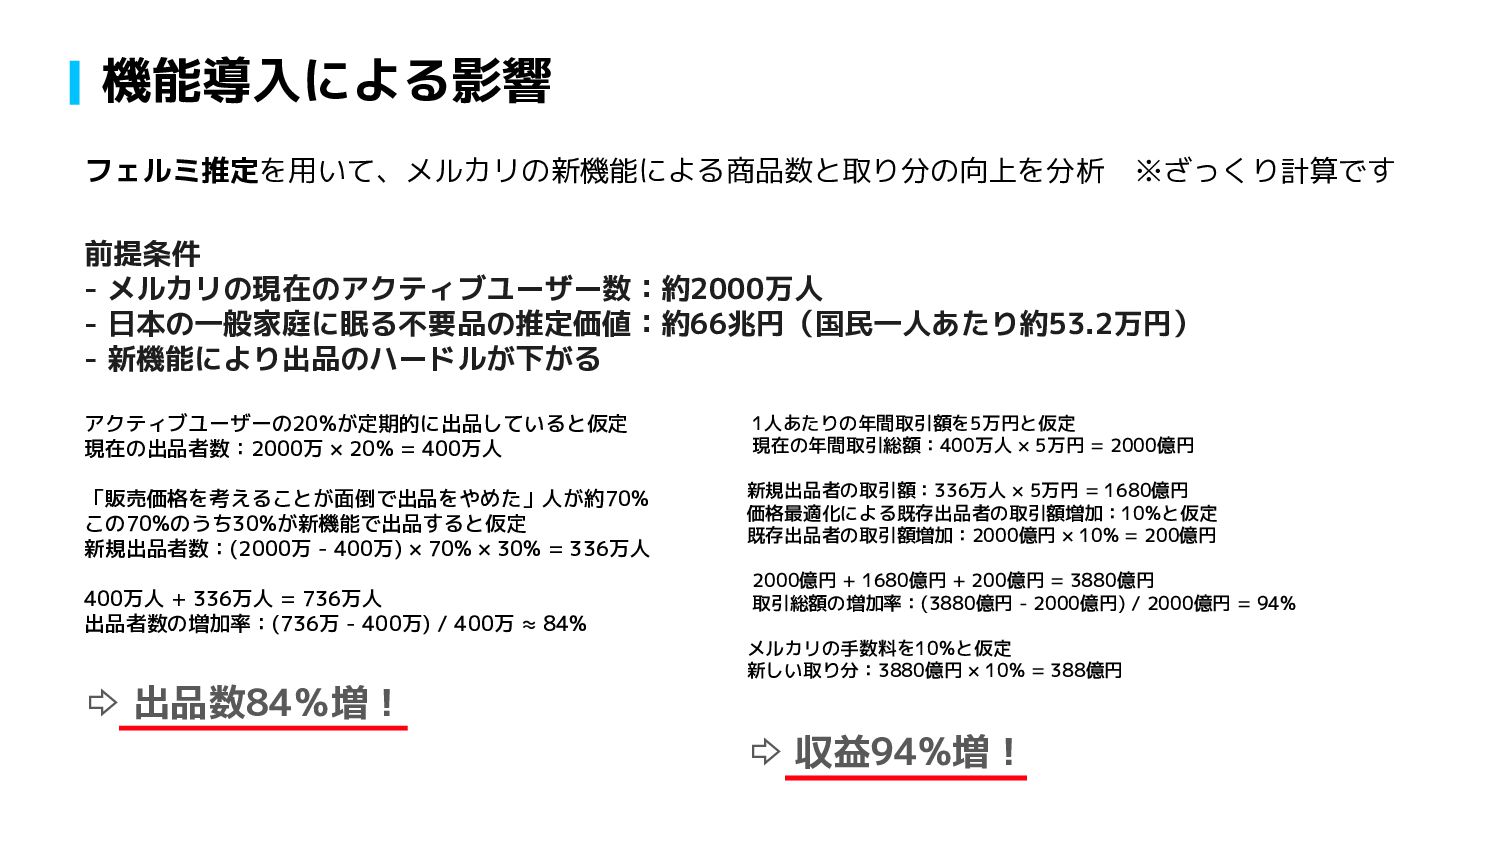
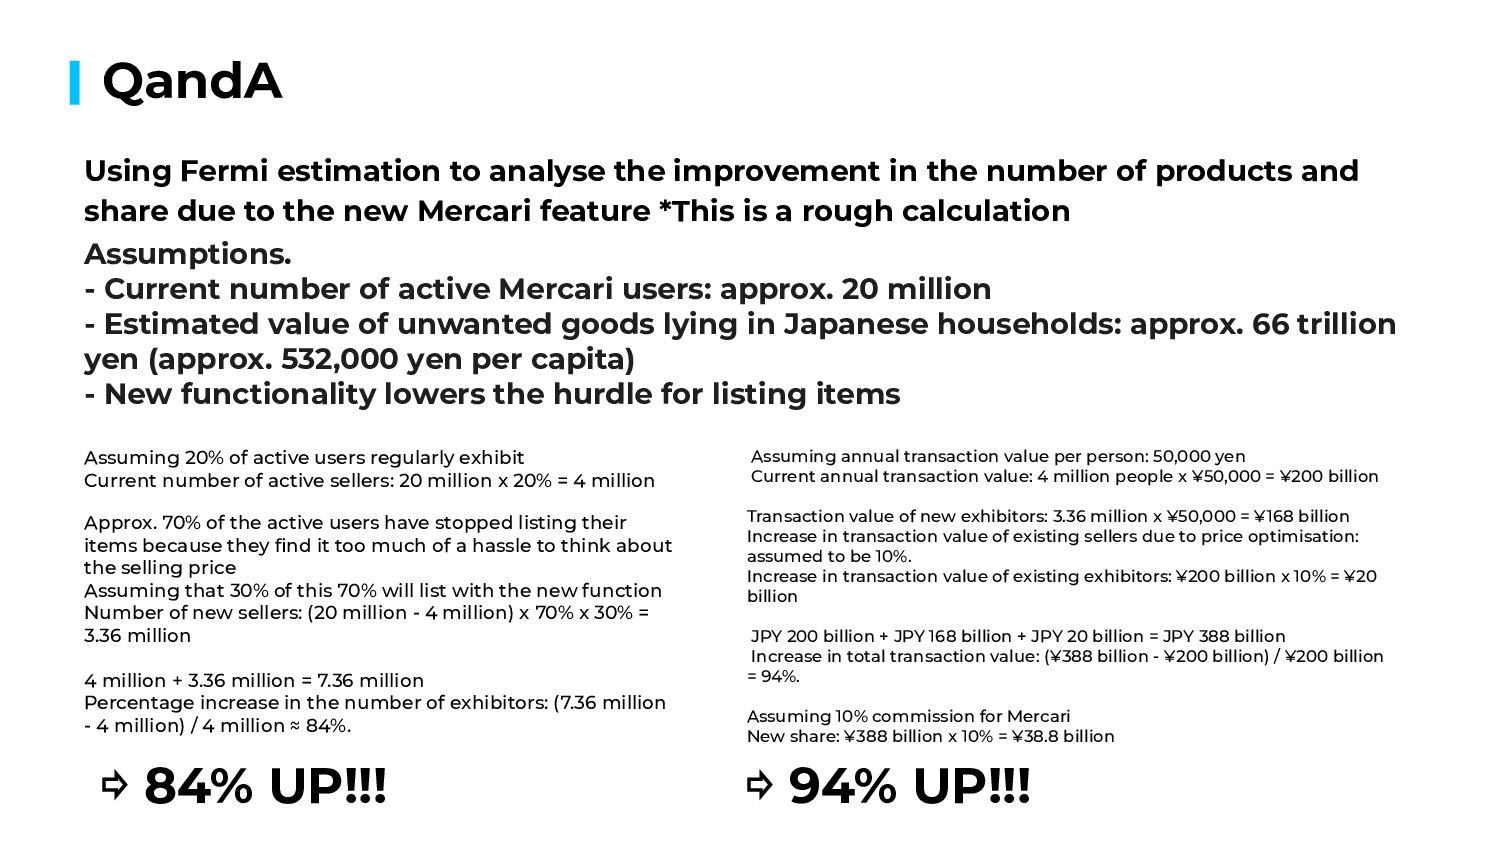
number of products and share due to the new Mercari feature *This is a rough calculation Assumptions. - Current number of active Mercari users: approx. 20 million - Estimated value of unwanted goods lying in Japanese households: approx. 66 trillion yen (approx. 532,000 yen per capita) - New functionality lowers the hurdle for listing items Assuming 20% of active users regularly exhibit Current number of active sellers: 20 million x 20% = 4 million Approx. 70% of the active users have stopped listing their items because they find it too much of a hassle to think about the selling price Assuming that 30% of this 70% will list with the new function Number of new sellers: (20 million - 4 million) x 70% x 30% = 3.36 million 4 million + 3.36 million = 7.36 million Percentage increase in the number of exhibitors: (7.36 million - 4 million) / 4 million ≈ 84%. Assuming annual transaction value per person: 50,000 yen Current annual transaction value: 4 million people x ¥50,000 = ¥200 billion Transaction value of new exhibitors: 3.36 million x ¥50,000 = ¥168 billion Increase in transaction value of existing sellers due to price optimisation: assumed to be 10%. Increase in transaction value of existing exhibitors: ¥200 billion x 10% = ¥20 billion JPY 200 billion + JPY 168 billion + JPY 20 billion = JPY 388 billion Increase in total transaction value: (¥388 billion - ¥200 billion) / ¥200 billion = 94%. Assuming 10% commission for Mercari New share: ¥388 billion x 10% = ¥38.8 billion ⇨ 84% UP!!! ⇨ 94% UP!!!
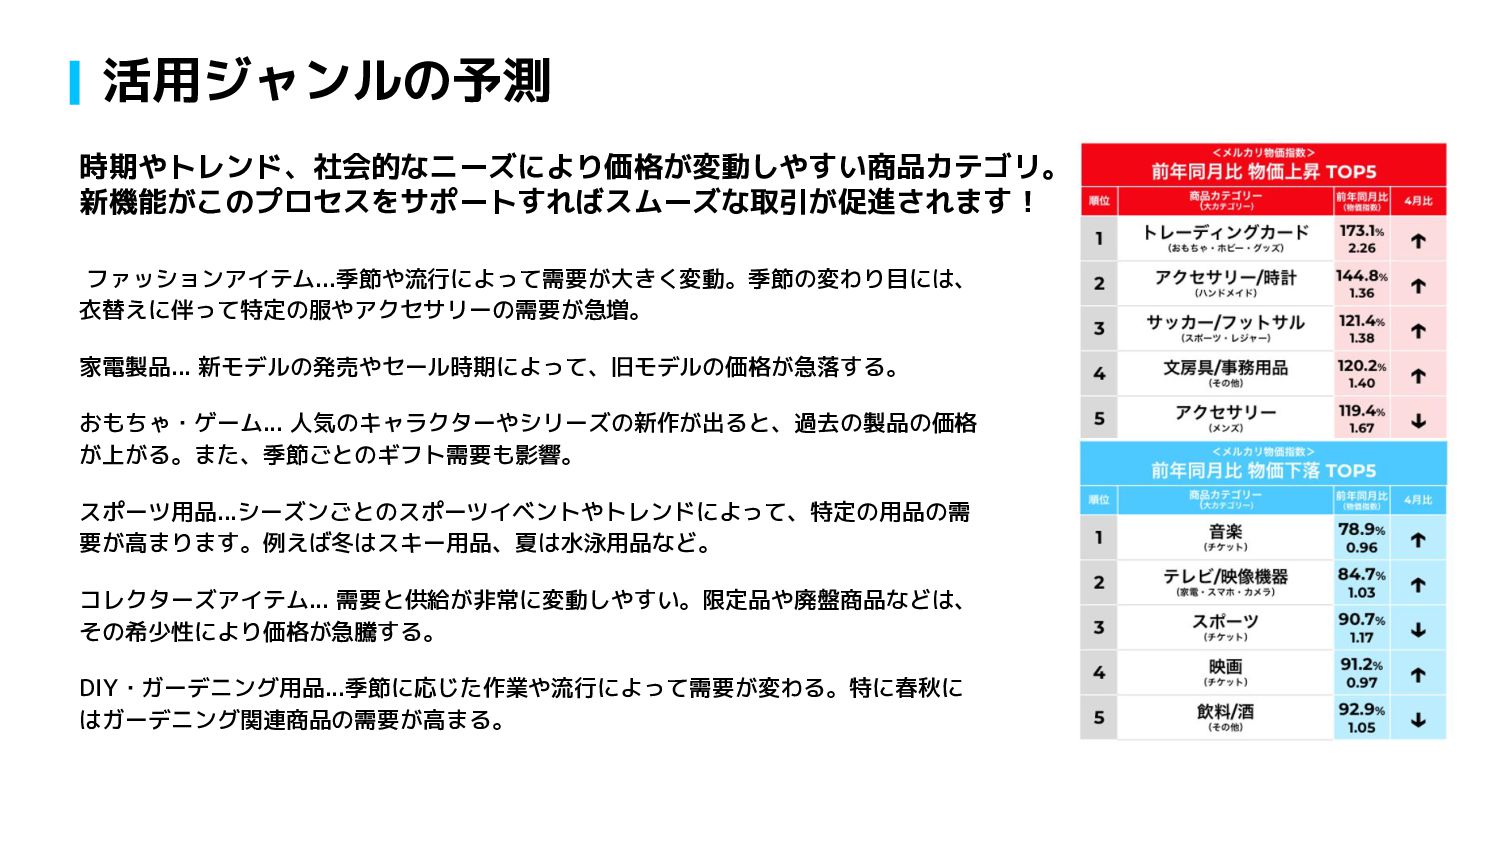
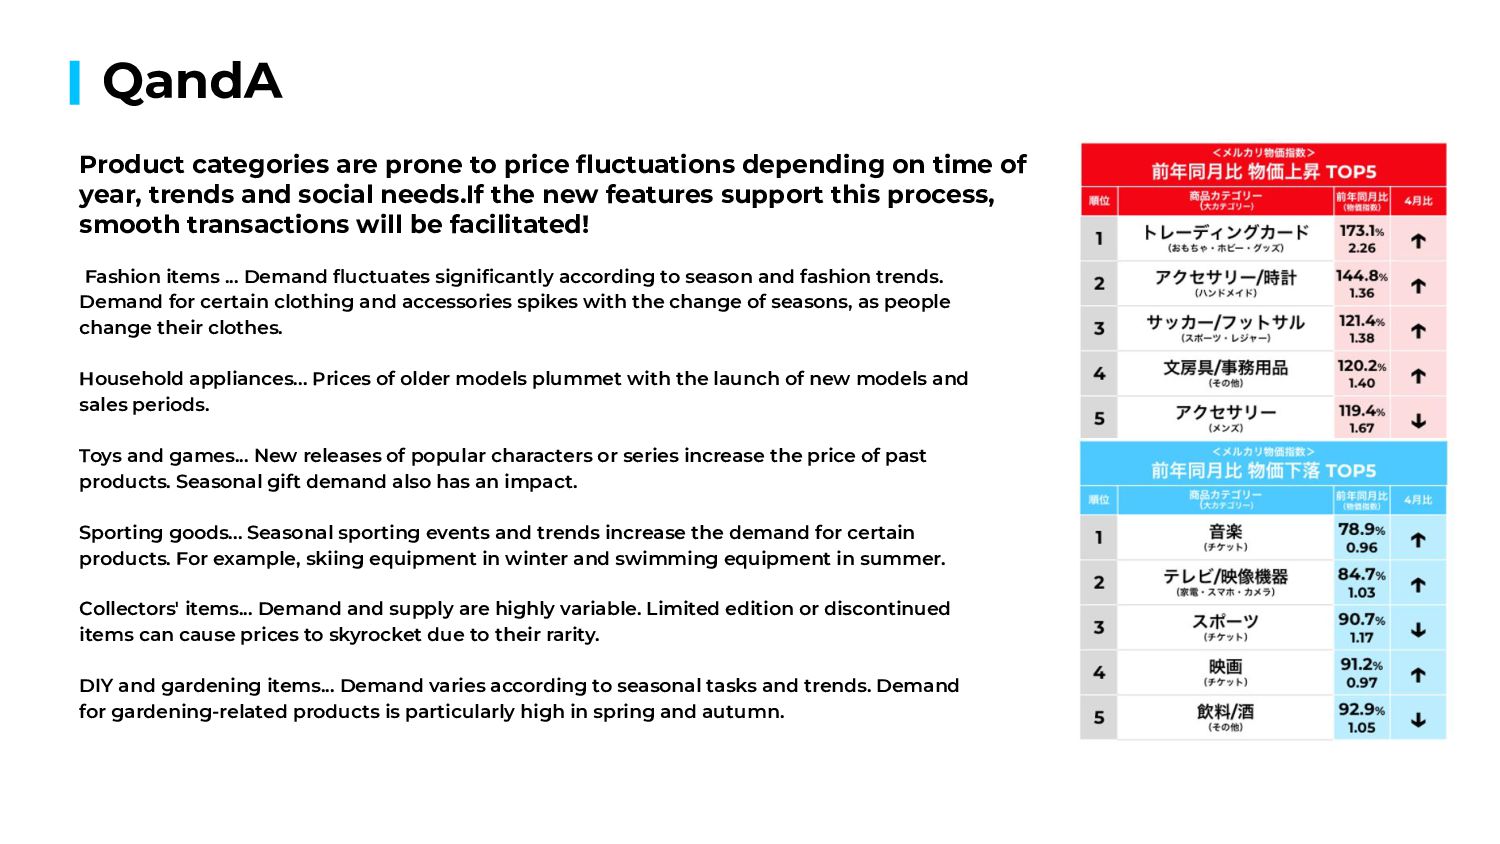
and fashion trends. Demand for certain clothing and accessories spikes with the change of seasons, as people change their clothes. Household appliances... Prices of older models plummet with the launch of new models and sales periods. Toys and games... New releases of popular characters or series increase the price of past products. Seasonal gift demand also has an impact. Sporting goods... Seasonal sporting events and trends increase the demand for certain products. For example, skiing equipment in winter and swimming equipment in summer. Collectors' items... Demand and supply are highly variable. Limited edition or discontinued items can cause prices to skyrocket due to their rarity. DIY and gardening items... Demand varies according to seasonal tasks and trends. Demand for gardening-related products is particularly high in spring and autumn. Product categories are prone to price fluctuations depending on time of year, trends and social needs.If the new features support this process, smooth transactions will be facilitated!
![Summary Product / Features AI/LLMを活用し出品のベストタイミングを導く Executive Summary|要旨 [背景 / Background]](https://files.speakerdeck.com/presentations/e30b618eb96f41549f17273f52e82a2b/slide_1.jpg)
![Summary Product / Features AI/LLMを活用し出品のベストタイミングを導く Executive Summary|要旨 [背景 / Background]](https://files.speakerdeck.com/presentations/e30b618eb96f41549f17273f52e82a2b/slide_2.jpg)