Upgrade to Pro — share decks privately, control downloads, hide ads and more …

Crypto Market Report: Bitcoin Outlook 2021

Interdax
January 19, 2021

Crypto Market Report: Bitcoin Outlook 2021

In this month's market report, we examine bitcoin's current rally and assess what is in store for 2021.

Interdax

January 19, 2021
Tweet

Other Decks in Research

Transcript

  1. Bitcoin Outlook In this month’s report, we will provide an

    outlook for 2021 by examining technical indicators and on-chain fundamentals to assess what stage bitcoin is currently at in the market cycle. Firstly, we will take a look at some general measures of network health to show the growth of bitcoin since the last cycle top in December 2017. Secondly, we will also examine on-chain fundamentals to determine if bitcoin has topped out recently at $42,000. On-chain fundamentals use data from the blockchain to provide insights into investor behaviour, cost basis, pro f i tability and so on. 
 Third, we will also look at some themes that will be important for bitcoin in 2021 including the Covid fallout, a possible Bitcoin ETF, Institutional Involvement and development updates such as Taproot. 2
  2. 3 Source: CoinMetrics The number of bitcoin active addresses (7-

    day moving average) is above the value it was at during the last peak, comfortably above 1 million. The number of transfers (7-day moving average) is approaching the highs seen during late 2017. Both indicators of Bitcoin’s network health have grown signi f i cantly over 2020, where active addresses and number of transfers approximately doubled over the course fo the year. For bitcoin’s price to sustain the rally, we should look for these indicators of network health to keep on growing. Network Health Overview Bitcoin Active Addresses and Transfer Count 300,000 525,000 750,000 975,000 1,200,000 300,000 550,000 800,000 1,050,000 1,300,000 2017 2018 2019 2020 2021 Active Addresses 7-day MA (left axis) Transfer Count 7-day MA (right axis)
  3. 4 The number of bitcoin that are small investors or

    retail traders can be proxied by the number of addresses holding between 0.001 and 1 BTC. The chart shows that the growth in the number of addresses holding between 0.001 and 1 BTC has grown signi f i cantly since the last cycle top in 2017. Small investors/Retail Number of Addresses Holding Between 0.001-1 BTC 0 3,000,000 6,000,000 9,000,000 12,000,000 15,000,000 18,000,000 2018 2019 2020 2021 0.001 - 0.01 coins 0.01 - 0.1 coins 0.1 - 1 coins Source: Santiment
  4. 5 Bitcoin's supply is known, can be veri f i

    ed independently and forecast with a certain degree of accuracy. On average blocks are produced every 10 minutes, and in the current epoch the issuance rate is 6.25 BTC per block. On average, 900 BTC will be minted per day until the next halving event in 2024. With these f i gures, the future supply curve can be estimated. By December 2021, less than 10% of the total bitcoin supply (2.1 million coins) will be left for miners. The free f l oat supply, which was developed by Coinmetrics, estimates the true circulating supply of bitcoin. Some coins are known to be lost or burned. Any such coins, as well as BTC held by addresses that have been inactive for 5 years, are excluded from the supply count. Bitcoin Supply Bitcoin Supply and Free Float Supply 0 BTC 3,000,000 BTC 6,000,000 BTC 9,000,000 BTC 12,000,000 BTC 15,000,000 BTC 18,000,000 BTC 21,000,000 BTC 2010 2011 2012 2013 2014 2015 2016 2017 2018 2019 2020 2021 2022 Projected* Total Supply Free Float Supply Source: Coinmetrics By April 2022, the total number of BTC mined is expected to reach 19 million …while the Free Float Supply is anticipated to be close to 15 million. * assumes a total of 900 BTC mined per day and no lost or burned BTC.
  5. 6 Bitcoin’s annual in f l ation fell from 3.6%

    to 1.8% after the block subsidy halving event in May 2020. The annual in f l ation rate will gradually fall from 1.8% until the next halving. Bitcoin Supply Bitcoin’s Annual In f l ation Rate 0% 2% 4% 6% 8% 10% 12% June 2016 June 2017 June 2018 June 2019 June 2020 Annual In f l ation Rate Projected Source: Coinmetrics
  6. 7 The Puell Multiple indicator visualises market cycles from the

    perspective of miners, speci f i cally their revenues/pro f i tability. Created by David Puell, the Multiple is calculated as the daily miner issuance in terms of USD divided by the 365-day moving average of the daily issuance in USD. When the Puell Multiple is above 4.5, it means that the daily revenue of miners in USD terms is 4.5 times higher as compared to average over the prior 365 days. Miners are natural sellers of BTC and have to manage BTC inventories to maximise their pro f i ts but they must sell BTC and cover their f i at-denominated costs. When their revenue is at a historically high level in USD terms, more sell pressure on bitcoin may be observed pushing the price lower. Since moving out of the buy zone (below 0.50) in May 2020, the Puell Multiple has approached the sell zone (above 4.5) but not yet touched this level, suggesting the current rally may have further room to go higher in 2021. The current cycle is likely to top once the Puell Multiple exceeds 4.5. Puell Multiple Source: Coinmetrics Bitcoin: Puell Multiple 0 2 4 6 8 10 12 14 16 18 20 22 2011 2012 2013 2014 2015 2016 2017 2018 2019 2020 2021
  7. Bitcoin Price Performance in Each Mining Epoch 10 100 1,000

    10,000 100,000 +12 Months +18 Months +24 Months +30 Months +36 Months +42 Months 4th epoch (2020-2024) 3rd epoch (2016-2020) 2nd epoch (2012-2016) 1st epoch (2009-2012) 8 Bitcoin is outpacing the performance seen in the 3rd epoch after the July 2016 halving: approximately 250 days after the third block subsidy reduction and the price is performing better relative to the second halving in July 2016. The price of bitcoin is up more than 400% since May 11, 2020. After the second block subsidy reduction, the cycle lasted approximately 18 months: this time around, the pattern of lengthening cycles seems to have changed. A break of the previous ATH in less than 7 months and a steeper advanced similar to that in the second epoch with two bull phases in 2013. In the f i rst and second epochs, the ATH occurred around 12 months into the epoch. For the third epoch, the all-time high occurred just under 18 months into the epoch. If the trend continues, the current epoch is likely to reach a peak between May 2021 and November 2021. Bitcoin Up +400% Post-Halving Source: Coinmetrics
  8. 9 Thermocap can be thought of as bitcoin’s aggregate security

    spend, an estimate of the costs that miners have incurred. The Market Cap to Thermocap ratio is a valuation metric which can help traders and investors to assess periods where bitcoin is overvalued or undervalued. When the ratio is 45 or higher, bitcoin’s market value is overvalued compared to the thermocap and typically coincides with tops in the price of bitcoin. Readings below 8 have highlighted where bitcoin is undervalued relative to thermocap. The red box on the chart shows where the ratio suggests the price of bitcoin is overvalued. The green box highlights the zone where the market value is well below thermocap, which has historically produced large returns from buying BTC. Thermocap Source: Coinmetrics Market Cap to Thermocap Ratio 0 10 20 30 40 50 60 70 2011 2012 2013 2014 2015 2016 2017 2018 2019 2020 2021
  9. 10 Source: Bitcoin Liquid Index, TradingView (script by everget) The

    Mayer Multiple (= BTC price/200- day Moving Average) has historically identi f i ed tops in the price of bitcoin when the value exceeded 2.40. 
 Since the start of 2021, the Mayer Multiple moved above the threshold at 2.4 three times, on January 3, 5 and 13. A value of 2.4 says that the current price is 2.4 times higher than the 200- day moving average and when this occurs, the price of bitcoin tends to return to the mean and return to the 200-day moving average. 
 The technical indicator suggests that the top may be in or at least there will be a cool off period before another breach of the threshold above 2.4, as seen in 2017. Mayer Multiple: BTC Exits Accumulation Zone Bitcoin’s Mayer Multiple 1.0 2.0 3.0 4.0 5.0 6.0 7.0 8.0 9.0 2012 2013 2014 2015 2016 2017 2018 2019 2020 2021 2.4 Accumulation Zone
  10. Monthly Trading Volume: Bitcoin Real Volume $50 billion $100 billion

    $150 billion $200 billion $250 billion $300 billion $350 billion $400 billion January 2017 January 2018 January 2019 January 2020 January 2021 Spot Derivatives Technicals: Trading Volume Trading volume across spot and derivatives exchanges reached all-time highs, with the current rally accompanied by a large increase in spot trading activity as compared to derivatives. Bitcoin Real Volume grew 110% in 2020 versus 2019. The Real Volume totalled $718.99 billion in 2020, compared to $341.6 billion in 2019. 11 January 18, 2021. Source: TradingView, script by capriole_charles
  11. Bitcoin: Pi Cycle Top Indicator $1 $10 $100 $1,000 $10,000

    $100,000 Apr 6, 2013 Dec 16, 2017 Closing price 111-day moving average (350-day moving average)x2 The Pi Cycle top indicator uses the 111- day moving average (MA) of the bitcoin price and the 350-day MA multiplied by 2 to identify tops in each market cycle. Whenever the 111-day MA begins to move above the product of the 350-day MA and 2, it has historically marked tops in each cycle within 4 days. The indicator was created by Philip Swift of lookintobitcoin.com. The Pi Cycle top indicator has only ever given three signals to sell bitcoin for USD and/or to take pro f i t from long positions. The f i rst occurred on April 6, 2013, 4 days prior to the cycle high of $268. The second instance was on December 4, 2013 and perfectly aligned with the cycle high of $1,140. The most recent was December 16, 2017, one day before the cycle's high of $19,700. Technicals: Pi Cycle Top Indicator 12 Source: Bitcoin Liquid Index, TradingView The Pi Cycle Top indicator implies that the bull run has room to go higher as the 111-day MA is still below the x2 multiple of the 350-day MA, with a difference of about $5,500 as of January 17. Once the two MAs are equal, then the indicator suggests that the cycle’s high is already in (or is likely to be established in the following days). Dec 4, 2013
  12. 13 Bitcoin has traded within the logarithmic channels for its

    entire price history (except brie f l y during the COVID-19 black swan): The price of bitcoin bounced off the support provided by the bottom channel. 
 The price action has broken above the middle of the channel (around $35,000-$36,000 in January 2021) for the f i rst time since August 2017. A move above the middle of the channel means that bitcoin could potentially extend towards the top of the channel, which reaches as high as $140,000 by December 2021. The bottom of the channel is currently near the 2019 high of $13,800. The bottom of the channel rises to the 2017 high of $19,800 by September 2021, which suggests that the market could potentially drop these lows. Source: TradingView, script by Quantadelic Bitcoin Logarithmic Regression Bitcoin Logarithmic Regresssion $0.1 $1 $10 $100 $1,000 $10,000 $100,000 $1,000,000 2011 2012 2013 2014 2015 2016 2017 2018 2019 2020 2021 close 100% - Top of Channel 50% - Middle of Channel 0% - Bottom of Channel
  13. Bitcoin's Market Value to Realised Value (MVRV) Ratio 1.5 3.0

    4.5 6.0 7.5 9.0 2011 2012 2013 2014 2015 2016 2017 2018 2019 2020 2021 14 The Market Value-to-Realised Value (MVRV) ratio is calculated by dividing the Market Cap in USD by the Realised Cap in USD. The realised capitalisation is a variation of market capitalisation which values each UTXO based on the price when it was last moved, instead of its current value. 
 The thresholds to determine where bitcoin is overvalued or undervalued are shown on the chart by the red and green zones respectively. 
 The bitcoin price is currently over-valued according to this on-chain metric, which has pinpointed tops in previous cycles. In the 2017 rally, the MVRV ratio was in a similar position as it is today, the ratio fell from around 3.5 to 2 and went on to hit the red zone several times before peaking above 4.5 in December 2017. Market Value-to-Realised Value (MVRV) Source: Coinmetrics
  14. 15 The MVRV Z-Score is calculated as: (Market Cap in

    USD - Realised Cap in USD) divided by the standard deviation of Market Cap in USD. The MVRV Z-Score identi f i es periods where bitcoin’s price is overextended from the realised value. The metric has historically picked the high for the cycle within two weeks and indicates the top of a cycle when the z-score enters the red box on the chart. The green box highlights the zone where the market value is well below the realised value, which has historically produced large returns from buying BTC. 
 The Z-Score has not yet moved into the sell zone between 7.5 and 9, currently sitting below 6. MVRV Z-Score Bitcoin’s MVRV Z-Score 0 2 4 6 8 10 12 2011 2012 2013 2014 2015 2016 2017 2018 2019 2020 2021 7.5 9 -0.4 0.1 Source: Coinmetrics
  15. Net Unrealised Pro f i t/Loss Indicator -1.0000 -0.7500 -0.5000

    -0.2500 0.0000 0.2500 0.5000 0.7500 1.0000 2012 2013 2014 2015 2016 2017 2018 2019 2020 2021 NUPL: Nearing Euphoria-Greed Calculated as (Market Cap - Realised Cap)/Market Cap. Source: CoinMetrics. 15 Belief-Denial Euphoria-Greed Hope-Fear Capitulation Optimism-Anxiety The Net Unrealised Pro f i t/Loss (NUPL) indicator peaked with a reading of 0.736 on January 8, just below the Euphoria zone and the highest value since December 19, 2017. Since the NUPL moved above 0.50, bitcoin has traded in the Belief-Denial zone for 89 days. In 2017, bitcoin traded within the Belief-Denial zone for a total of 249 consecutive days before entering Euphoria-Greed. 
 The last time Euphoria was observed, bitcoin traded in this zone above 0.75 for just 12 days (between December 6-18, 2017). The price reached an all-time high near $20,000, before the NUPL fell back into Belief-Denial and then below 0.50 con f i rming the cycle top. Other instances of Euphoria( cycle highs)/Capitulation (cycle lows) are highlighted on the chart. 
 1. The NUPL and bitcoin's price may have already peaked, with the NUPL falling short of 0.75 and could continue to fall. A top is con f i rmed once bitcoin enters the Optimism- Anxiety zone where 0.25 < NUPL < 0.50. 2. Alternatively, BTC-USD may consolidate in the Belief-Denial zone, where 0.50 < NUPL < 0.75, before the NUPL breaches 0.75 and bitcoin enters the Euphoria stage of the market cycle. 16 Bitcoin top near $20,000 Market Cycle peak above $1,100 Bitcoin bottoms out around $3,000 Black Thursday, bitcoin crashes below $4,000 Market Cycle peak above $200 Market Cycle low near $170
  16. 17 Source: Santiment Dormant circulation metric is useful for tracking

    when old bitcoin are spent. The 3-year dormant circulation shows the coins not moved in more than 3 years that were transacted during a week. The silver line shows the 5-year dormant circulation. Since 2017, spikes in the 5-year circulation have occurred near important turning points: in late 2017 and at the end of the bear market around early 2019. The top of the bull market in 2017 coincided with a 5-year dormant circulation of 50,000 BTC or more per week. In October 2020, there was similar a spike in the 5- year dormant circulation of 73,510 BTC when the price regained the 2019 high. The metric has moved lower since then, suggesting there’s room for price to appreciate without long-term HODLers selling. The 3-year dormant circulation shows a similar pattern, but with larger, more frequent and more sporadic spikes. Previous cycle tops in 2017/2019 were marked by a 3-year dormant circulation > 100,000 BTC. The last time this occurred was shortly after bitcoin reached a peak near $14,000 in the summer of 2019. The 3-year dormant circulation is currently less than half of this level - but is trending higher. Dormant Circulation Bitcoin: 3-Year and 5-Year Dormant Circulation $100 $1,000 $10,000 $100,000 Dormant Circulation 50,000BTC 100,000BTC 150,000BTC 200,000BTC 250,000BTC 300,000BTC 350,000BTC 400,000BTC 2017 2018 2019 2020 2021 5-Year Dormant Circulation (left axis) 3-Year Dormant Circulation (left axis) Price (right axis)
  17. 18 Bitcoin Price and Age Consumed $1 $10 $100 $1,000

    $10,000 $100,000 0 10,000,000 20,000,000 30,000,000 40,000,000 50,000,000 2012 2013 2014 2015 2016 2017 2018 2019 2020 2021 Age Consumed 30-day MA (left axis) Price (right axis) Sources: Coinmetrics (price), Santiment (Age Consumed) Age consumed is an interesting on-chain metric used to visualise the movement of old coins and shows the amount of BTC changing addresses on a certain date, multiplied by the time since they last moved. A spike in age consumed indicates that a large number of coins are moving after an extended period of time. The 30-day moving average tends to exhibit large increases before or near cycle tops. The metric captures holders that send their BTC to exchanges or buyers to realise pro f i ts. The 30-day MA of the Age Consumed is currently near 2-year highs and above the level at the top of the summer 2019 rally. The age consumed is also above the level it was at above $19,000 in December 2017 but still below the high seen in July 2017, where age consumed rose to 45 million. In each market cycle, the age consumed tends to increase in size at each ATH, so we could look for a moved above 45 million for the 30-day MA of age consumed to begin to scale out or consider looking for a top for the current cycle. Bitcoin Age Consumed
  18. 19 Covid Fallout Policymakers are examining the evolution of Covid

    as the course of the economy now depends on how the situation plays out. Interest rates in the G3 countries will remain at the zero lower bound for the foreseeable future, with the best case scenario being a recovery in economic activity in late 2021/early 2022. Further pressure on f i scal and monetary policy for stimulus is expected. With money f l owing abundantly, investors will look beyond gold and traditional investments to focus more on cryptocurrencies, especially the market leader: bitcoin. A further loss of con f i dence in governments, central banks and the f i nancial system in general will act as a boost for bitcoin. Annual percentage growth of the M2 money stock grew almost 20% in 2020, compared to around 1.8% for bitcoin. USD M2 Money Stock, Annual Percentage Growth 4% 8% 12% 16% 20% 1982 2001 2020 Source: Federal Reserve Bank of St. Louis
  19. Bitcoin ETF 20 VanEck Associates Corp. submitted a Bitcoin ETF

    proposal at the end of 2020 to the SEC, which has denied all crypto-tracking ETFs over the years, such as the COIN ETF proposed by the Winklevoss twins in early 2017. 2021 may see the introduction of a Bitcoin ETF: A change in SEC leadership under the Biden administration could be a positive sign. Biden’s pick for the SEC is Gary Gensler, which is interesting because Gensler is a Senior Advisor to the MIT Media Lab Digital Currency Initiative and has taught bitcoin/cryptocurrency courses at MIT Sloan School of Management. An ETF approval would be bullish for BTC in the long-term as it would give the leading digital asset exposure to a wider audience of investors. However, an approval could be bearish for BTC in the short-term, as it would spark out f l ows from Grayscale’s GBTC, the world’s largest traded cryptocurrency fund.
  20. CME Open Interest Open Interest for the CME’s bitcoin futures

    are rising (along with “real” trading volume and the price of bitcoin), suggesting further advances are likely: Open interest is at 12,039 according to the most recent data, up +122.94% since January 2020. The CME’s offering has become one of the most popular futures contracts for bitcoin and has one the of the largest Open Interest f i gures out of all futures exchanges. December 2020 saw the highest monthly volume on the CME since May 2019, suggesting the bullish trend should continue as there’s more interest in trading bitcoin. 2021 will likely be another year of growth for CME bitcoin futures. 21 Open Interest since 2019: CME Bitcoin Futures 2,000 4,000 6,000 8,000 10,000 12,000 14,000 16,000 Jan ‘19 Feb ‘19 Mar ‘19 Apr ‘19 May ‘19 Jun ‘19 Jul ‘19 Aug ‘19 Sep ‘19 Oct ‘19 Nov ‘19 Dec ‘19 Jan ‘20 Feb ‘20 Mar ‘20 Apr ‘20 May ‘20 Jun ’20 Jul ‘20 Aug ‘20 Sep ‘20 Oct ‘20 Nov ‘20 Dec '20 Jan '21 Source: Quandl
  21. 22 Institutional Adoption Bitcoin Treasuries (with >5,000 BTC) Grayscale Bitcoin

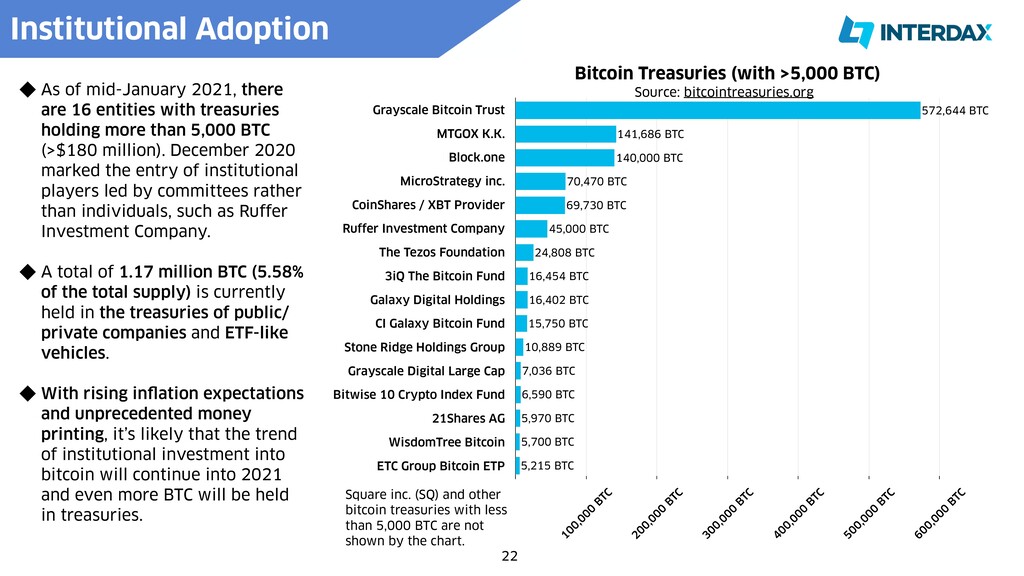
    Trust MTGOX K.K. Block.one MicroStrategy inc. CoinShares / XBT Provider Ruffer Investment Company The Tezos Foundation 3iQ The Bitcoin Fund Galaxy Digital Holdings CI Galaxy Bitcoin Fund Stone Ridge Holdings Group Grayscale Digital Large Cap Bitwise 10 Crypto Index Fund 21Shares AG WisdomTree Bitcoin ETC Group Bitcoin ETP 100,000 BTC 200,000 BTC 300,000 BTC 400,000 BTC 500,000 BTC 600,000 BTC 5,215 BTC 5,700 BTC 5,970 BTC 6,590 BTC 7,036 BTC 10,889 BTC 15,750 BTC 16,402 BTC 16,454 BTC 24,808 BTC 45,000 BTC 69,730 BTC 70,470 BTC 140,000 BTC 141,686 BTC 572,644 BTC Source: bitcointreasuries.org As of mid-January 2021, there are 16 entities with treasuries holding more than 5,000 BTC (>$180 million). December 2020 marked the entry of institutional players led by committees rather than individuals, such as Ruffer Investment Company. A total of 1.17 million BTC (5.58% of the total supply) is currently held in the treasuries of public/ private companies and ETF-like vehicles. With rising in f l ation expectations and unprecedented money printing, it’s likely that the trend of institutional investment into bitcoin will continue into 2021 and even more BTC will be held in treasuries. Square inc. (SQ) and other bitcoin treasuries with less than 5,000 BTC are not shown by the chart.
  22. 23 Number of Addresses Holding 1,000-100,000 BTC 500 1,000 1,500

    2,000 2,500 3,000 2010 2011 2012 2013 2014 2015 2016 2017 2018 2019 2020 2021 Source: Santiment Between September 2009 and January 2021, the number of addresses holding between 1,000 to 100,000 BTC has risen almost 500 times from 5 addresses to 2,432. The rate at which the number of addresses is growing has not seen since the early years of bitcoin between 2011 and 2013. With bitcoin at a much higher price, the number of wallets holding between 1,000-100,000 BTC serves as a proxy for institutional involvement and high-net worth individuals. If large holders have more conviction, then it is likely that bitcoin still has room to appreciate further as they are accumulating more coins and taking more of the supply out of circulation. Large HOLDers More Conviction
  23. Taproot 24 Bitcoin is set to see its biggest upgrade

    since Segregated Witness (SegWit) in 2017, arguable even more important and impactful. The consensus rules for the proposed Taproot upgrade have been implemented into Bitcoin Core’s recent 0.21.0 release. Taproot would inspire a lot of con f i dence in the development of Bitcoin: there’’s been no no community in f i ghting so far as there was with SegWit and is relatively uncontroversial upgrade. The Taproot deployment should go smoothly, install more con f i dence in Bitcoin, opens up more sophisticated use cases and enhances scalability. Taproot is likely to be soft-forked into Bitcoin in early 2021. Miners representing approximately 91% of Bitcoin’s total hashrate are now signalling support for the upgrade, and are now deciding on an activation method and date. Bitcoin Core may see a minor release, version 0.21.1, that will contain code that can begin enforcement of Taproot’s rules when an appropriate activation signal is received. BIP 340: Schnorr Signatures BIP 341: Taproot BIP 342: Tapscript Schnorr signatures are just as secure, if not more secure, than ECDSA while also reducing the size of transactions, at just 64 bytes compared to 70-72 bytes for the current ECDSA signatures. Key and signature aggregation: produce only one signature for all M parties in multi-party contracts. Improves veri f i cation speed (via batch veri f i cation) and spending policy privacy. Schnorr makes multi-signature transactions look like ‘regular’ Pay-to-Public-Key-Hash transactions. Taproot extends the types of transactions that will look similar (making Pay-to- Public-Key-Hash and Pay-to-Script-Hash indistinguishable), minimising the information that is revealed on chain about the conditions to spend for a transaction output. Complicated transactions realise signi f i cant savings on transaction fees, as data-intensive scripts no longer have to pay fees higher than a standard Pay-to-Public-Key-Hash transaction. The ef f i ciency gains are greater the more complex transactions there are on the network. Opens up further privacy and ef f i ciency improvements, such as cross-input signature aggregation. Tapscript upgrades Script, Bitcoin’s programming language, adding more f l exibility to deploy new op-codes for smart contract applications.
  24. Coinswap 25 One of the big Bitcoin developments in 2020

    was CoinSwap, “the next step for on-chain bitcoin privacy”. CoinSwap is a non-custodial protocol to enhance privacy and fungibility of Bitcoin based on the idea of atomic swaps. CoinSwap was f i rst proposed in 2013 by Greg Maxwell but was complicated to implement versus other suggestions such as CoinJoin. On May 25, 2020, Chris Belcher posted a design for a full featured coinswap implementation. What CoinSwap does is basically break the transaction graph heuristic, i.e., breaking the link between the sent and received bitcoins and it looks like two sets of completely disconnected transactions on-chain. Bitcoin’s property of censorship resistance relies on fungibility. Greater fungibility improves the bull case for bitcoin as censorship-resistant money. The bear case is that regulatory risk is heightened if privacy features are implemented meaningfully. While the battleground was scaling in the 2017 bull run, it may shift to privacy/fungibility in 2021. Other important developments that are upcoming for bitcoin include: Utreexo, which compresses fully validating nodes to enhance scalability, and Stratum v2, which improves the decentralisation and security of mining.
  25. 26 Summary: 2021 Outlook Bitcoin is in the early to

    mid stages of a bull market. Several indicators have f l ashed signs of a top for BTC- USD around $42,000 such as the Mayer Multiple and the Market Value to Realised Value (MVRV) ratio. The Mayer Multiple hit 2.40 and the MVRV ratio exceeds the 3.2 threshold: both of these facts suggest that bitcoin is currently overvalued. However, other technical and fundamental indicators imply that the price still has room to go higher. Most notably, long-term holders are not selling in the amounts seen during late 2017, despite bitcoin reaching more than double the price at that time. Several valuation metrics such as Market Cap to Thermocap, the Net Unrealised Pro f i t/Loss indicator and the Puell Multiple all imply the market is not yet overvalued. The Pi Cycle Top indicator and Logarithmic Regression both suggest that bitcoin can reach higher highs in 2021. In terms of the macro backdrop, bitcoin is likely to bene f i t from additional monetary expansion and a weaker US dollar. The trend of institutional involvement is starting to snowball, with the rate of accumulation by addresses with between 1000-100,000 BTC the most robust since the early years (2011-2013). A Bitcoin ETF is also on the cards. The fundamental outlook is also strong, with the Schnorr/Taproot/Tapscript upgrade to be deployed in early 2021 and other upgrades such as Utreexo, CoinSwap and Stratum v2 further improving the fungibility, scalability and security of Bitcoin.
  26. Contact: ‣ [email protected] ‣ Twitter ‣ Medium ‣ Telegram 


    Disclaimer: Interdax’s monthly market report is for informational purposes only and should not be taken as f i nancial advice. Trading involves signi f i cant risks and investors should conduct their own due diligence and/or seek professional advice.