Slide 1: (Intro) Hello. My name is Jasmine Russell and I am a strategic Market Research and Digital Analytic Professional. Yes, that means I create surveys for a living, but that also means I'm the person that analyzes and creeps on all of your online activity...so be nice to me.
Slide 2: (Consultant) As an analyst, I consider myself to be many things. A consultant...to help you walk through your initial set-up of research and outlook plan. What is your hypothesis, where should we go?
Slide 3: (Strategic) A strategist...Now that we've identified your hypothesis. how do we actually get there? What research do we need to put in place? What historical data do we have to analyze?
Slide 4: (Number Love) And of course, I consider myself to be a lover of numbers. I enjoy being able to close questions on the basis of figures and sound reasoning.
Slide 5: (Mediator) In the midst of all of these good things, there are a few things that were not in my job description...such as being a mediator between conflicting lines of thought on how we should use data.
Slide 6: (Counselor) Being a counselor for those same conflicting individuals to let them know, its not about their personal opinion of how we use the data, but what the insights are telling them.
Slide 7: (Comedian) And for my own personal sanity...a comedian because some data arguments are so ugly the only way we can move on is through humor.
Slide 8: (What is the Purpose...) With these conflicting challenges of what an analyst deals with, I ask myself constantly, what is the true purpose of data reporting?
Slide 9: (Let's Think) Is it to bring organizations to actionable conclusions? Develop Killer Data Visualizations? To entice team members with fancy predictive models?
Slide 10: (Pikachu. For Life.) Perhaps the entire point of data reporting is to identify and analyze the best corner in Minneapolis to catch Pokemon in Pokemon Go. With all of this, there are a few data woes that stand out.
Slide 11: (Data Hauntings) First Woe. Report Recreation. The task of re-creating an entire previously delivered report. This is often seen as a looming cloud of work in thinking about the hourse needed to recreate the report, but there are benefits to this frustration.
Slide 12 (Dark Right?): 9/10 recreating reports come out better and are completed faster due to familiarity the second time around.
Slide 13. (Truth or Dare) Next Woe: Being Honest as an analyst. To be an analyst that moves with the sway of the room seems unnatural to me. To research and study data habits without the ability to identify the true nature of data is ungrounded.
Slide 14: (You Chicken) So the question becomes are you a chicken analyst? Are you afraid to be honest? Challenge yourself to be a: factual analyst, bring your thick skin to the table and don't shun away from delivering negative reports.
Slide 15: (Your Flat) Flat Data. There are times when data does not change chartwise, although data is always evolving. And many ask themselves, whats the impact? We're not making progress.
Slide 16: (Flat graph) Challenge yourself to view flat data strategically. Along with the obvious flat line. Flat data represents retention, a potential need for product creativity, and the opportunity to share your view of historical actions and results.
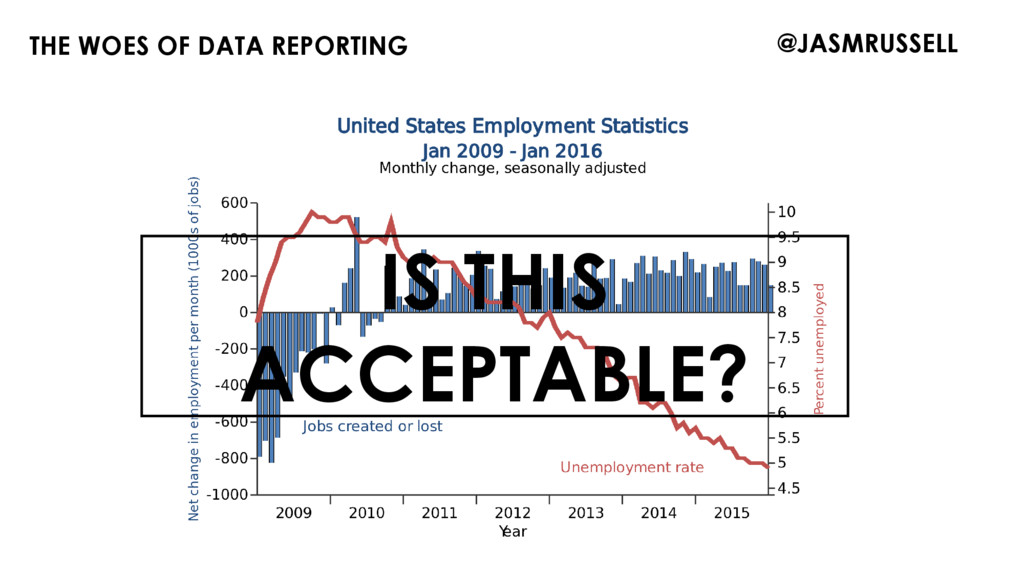
Slide 17: (Is This Acceptable) What do mean you don't understand my analysis? We've all been there. We create a fancy data visualization or create a conclusion that no-one understand bus us. it happens.
Slide 18: (X Papers) Ask yourself: Am I stacking too many variables? Am I concentrating on the correct objective? Am I just creating this chart for my ego instead of strategy? Pause before your deliver.
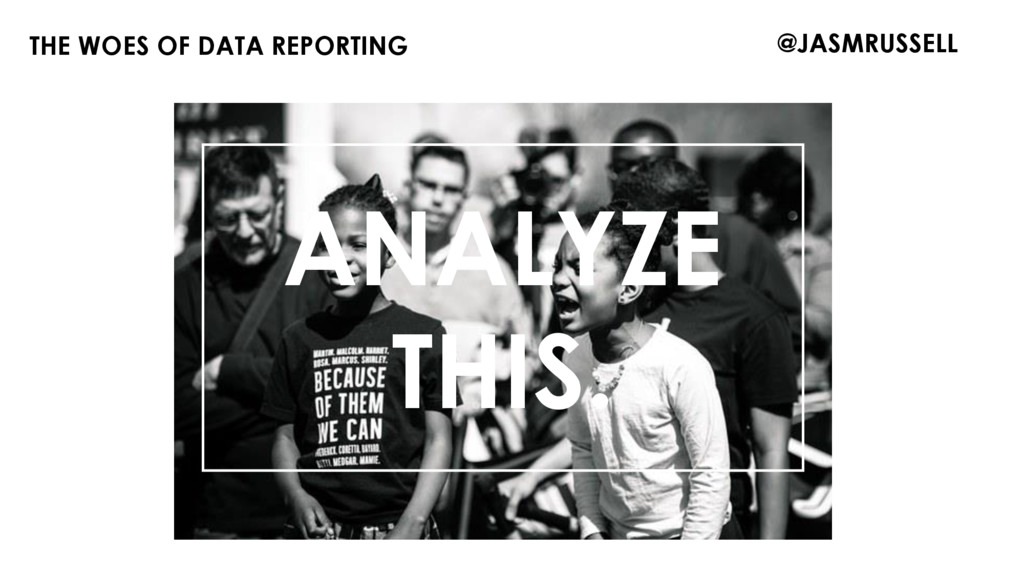
Slide 19: (Analyze This) Finally, Analyzing Images within market research. The more images or stimuli you present in research, the greater opportunity the respondent has to formulate and draw their own conclusions of individual choice. Be precise in your design and offer sound structure of how results may come back after respondents receive visuals before fielding.
Slide 20: (Last thought) My data guides and mentors up until this point have been extremely factual strategist. Willing to rip apart ever detail of a data report until its tearfully and painfully accurate. Don't be afraid to go there and don't be afraid to make mistakes.