Upgrade to Pro — share decks privately, control downloads, hide ads and more …

2025-09-30 Dev2Next - From Mystery to Mastery -...

2025-09-30 Dev2Next - From Mystery to Mastery - Decoding the JVM with Observability Tools

Avatar for Jonatan Ivanov

Jonatan Ivanov

September 28, 2025
Tweet

More Decks by Jonatan Ivanov

Other Decks in Programming

Transcript

  1. Jonatan Ivanov - Spring Team - Micrometer - Spring Cloud,

    Spring Boot - Spring Observability Team - Java Champion - Seattle Java User Group - develotters.com - @jonatan_ivanov
  2. Pasha Finkelshteyn - Developer 🥑 at BellSoft - JVM Developer

    - Developers should know how their production works - @asm0di0
  3. What is Observability? How well we can understand the internals

    of a system based on its outputs (Providing meaningful information about what happens inside) (Data about your app)
  4. Why do we need Observability? Today's systems are increasingly complex

    (cloud) (Death Star Architecture, Big Ball of Mud)
  5. Environments can be chaotic You turn a knob here a

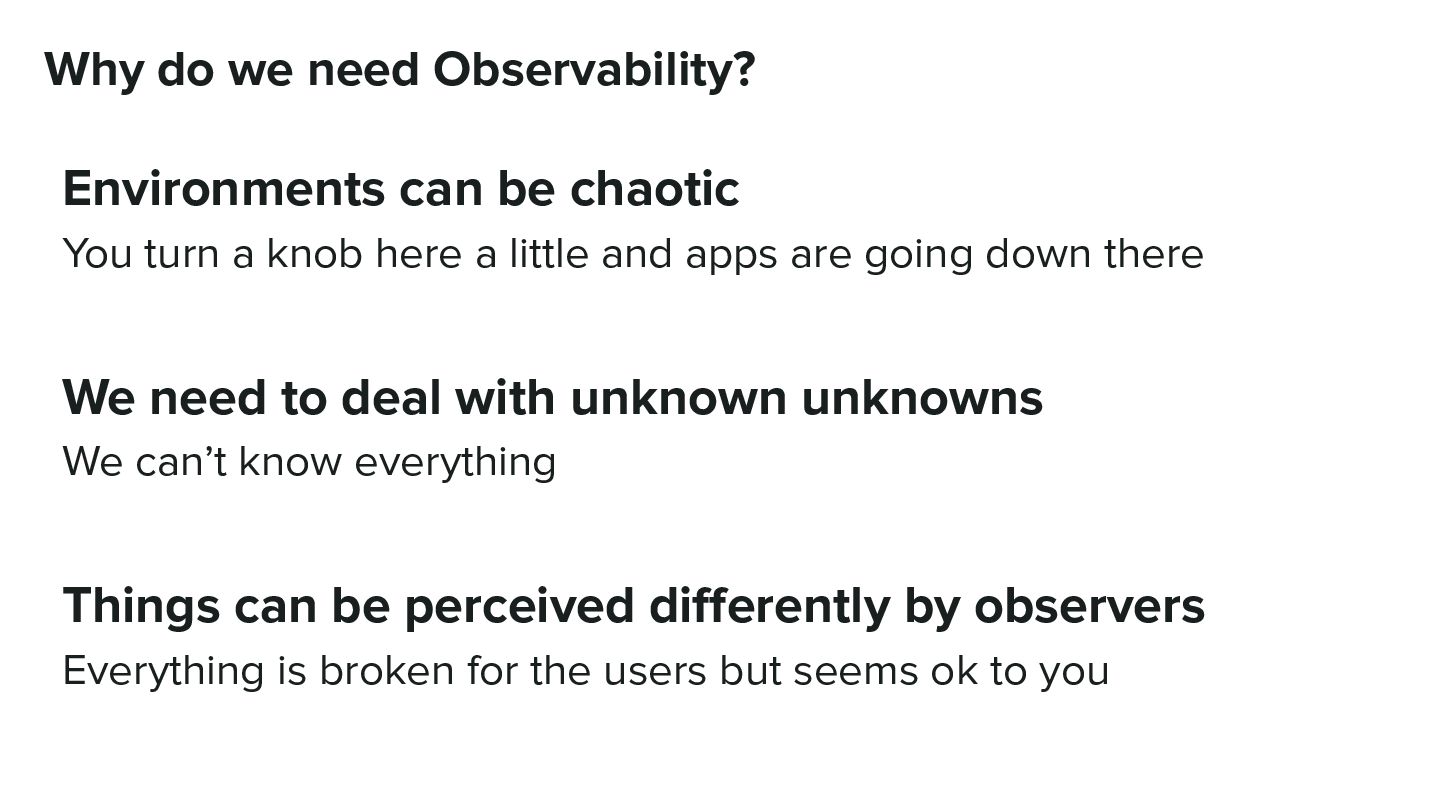
    little and apps are going down there We need to deal with unknown unknowns We can’t know everything Things can be perceived differently by observers Everything is broken for the users but seems ok to you Why do we need Observability?
  6. JMX - Java Management eXtensions - Standard API to monitor/manage

    Java apps at runtime - Uses MBeans to expose metrics and operations - Accessible locally & remotely (e.g.: JConsole, VisualVM, Prometheus).
  7. And even… - github.com/prometheus/jmx_exporter - Comes in 2 flavours: -

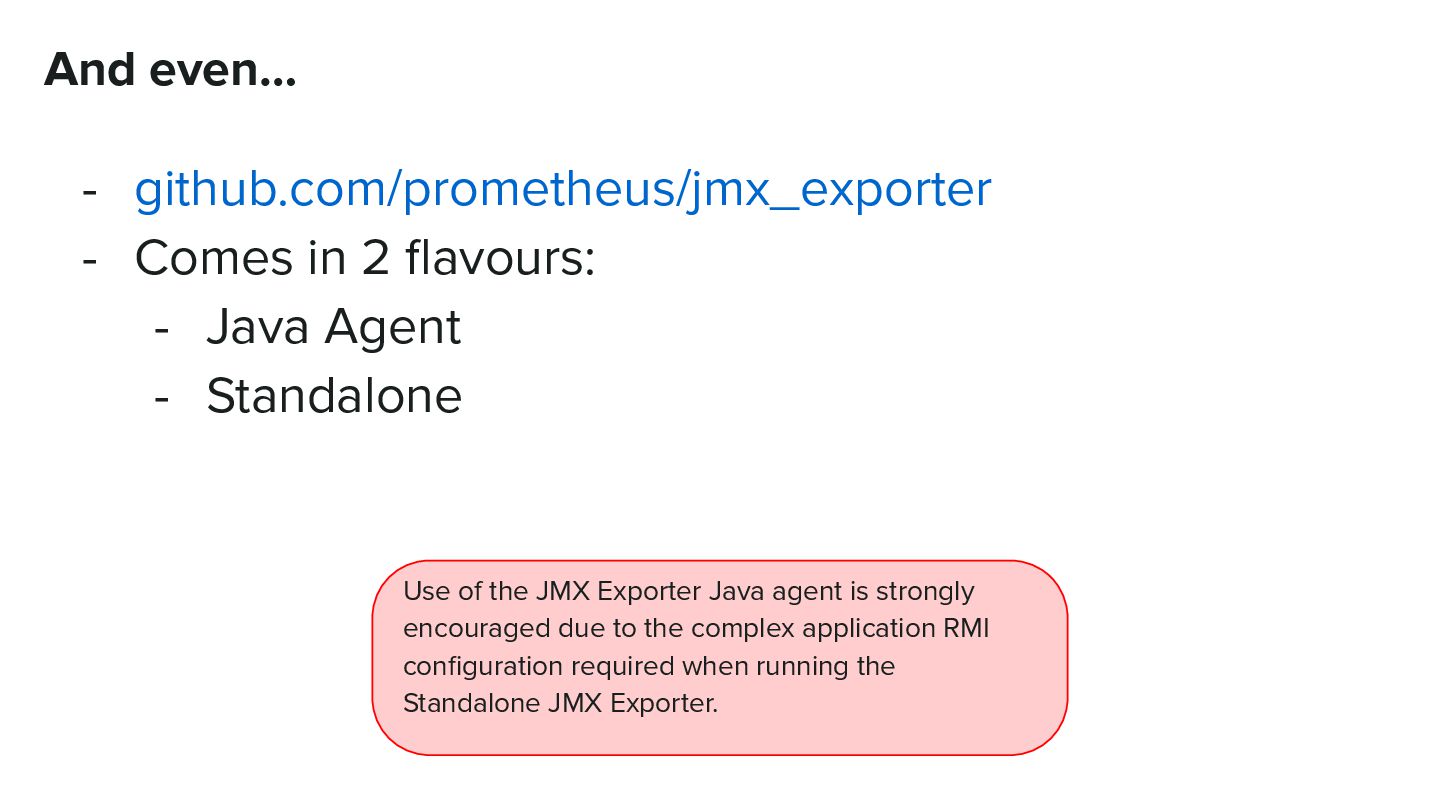
    Java Agent - Standalone Use of the JMX Exporter Java agent is strongly encouraged due to the complex application RMI configuration required when running the Standalone JMX Exporter.
  8. Metrics - What is the context of certain events? -

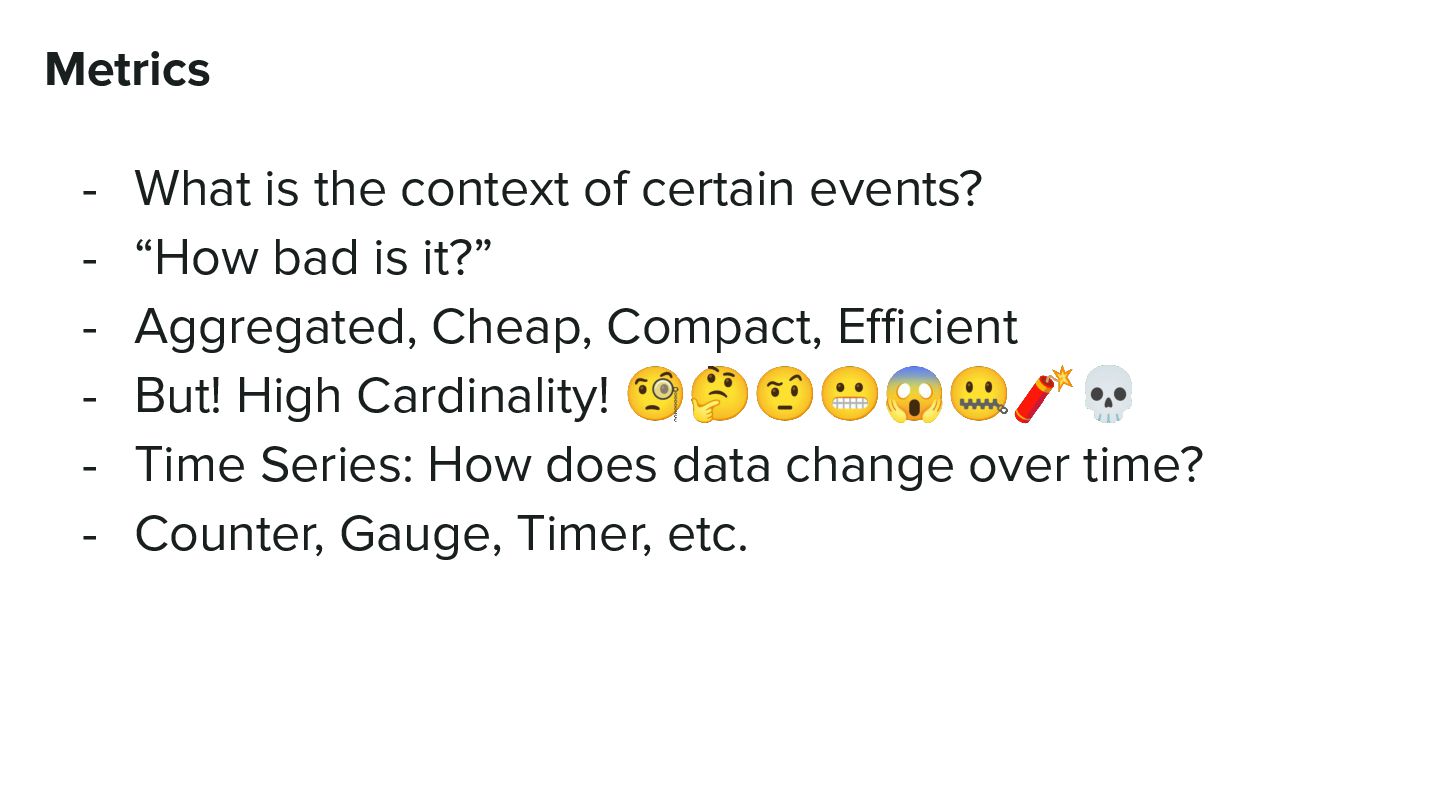
    “How bad is it?” - Aggregated, Cheap, Compact, Efficient - But! High Cardinality! 🧐🤔🤨😬😱🤐🧨💀 - Time Series: How does data change over time? - Counter, Gauge, Timer, etc.
  9. Logging - Logging is essential to any application - Good

    logging helps in debug AND maintenance
  10. Two types of logging System logs • Focus: system and

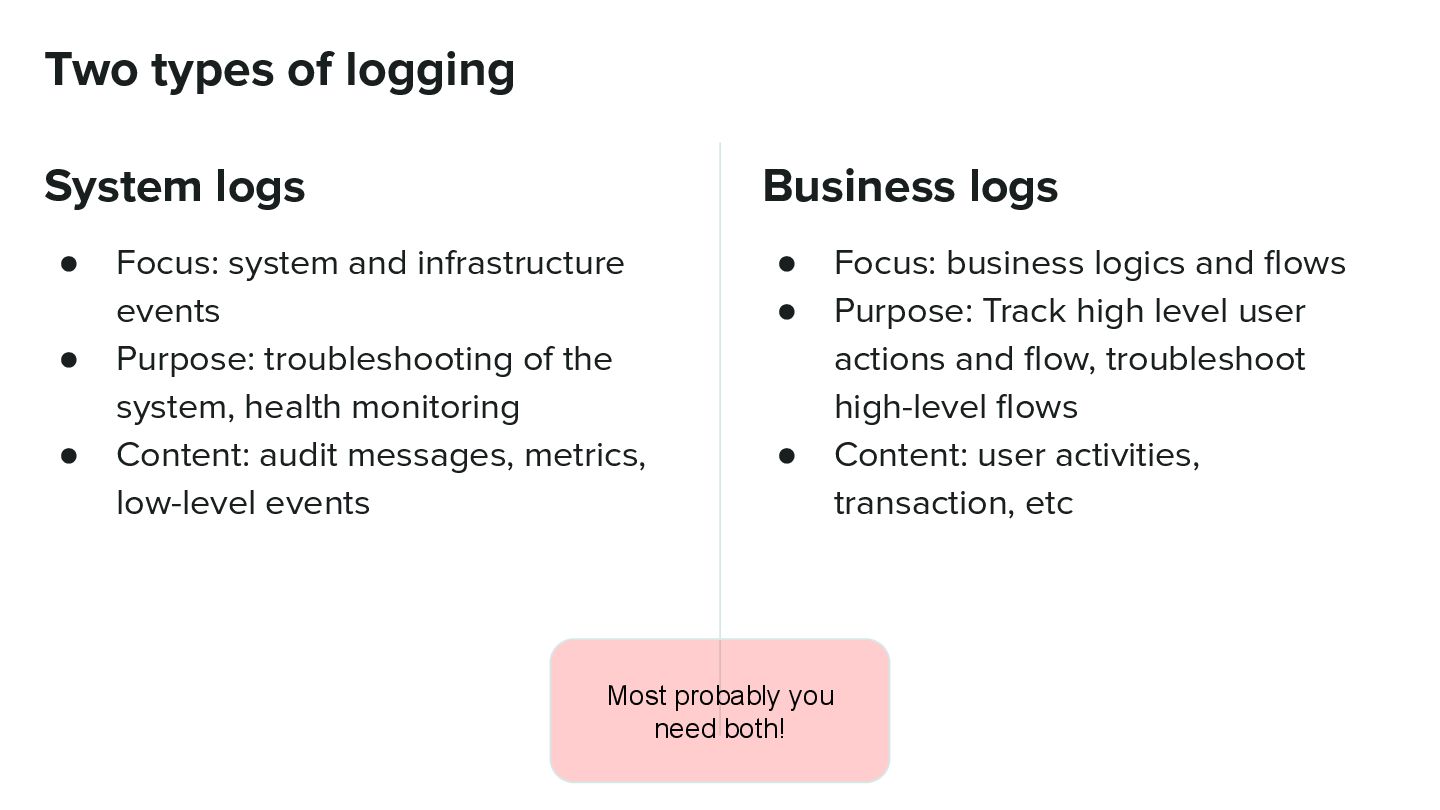
    infrastructure events • Purpose: troubleshooting of the system, health monitoring • Content: audit messages, metrics, low-level events Business logs • Focus: business logics and flows • Purpose: Track high level user actions and flow, troubleshoot high-level flows • Content: user activities, transaction, etc Most probably you need both!
  11. How to separate them? - Loggers are hierarchical! - org.example.tea

    and org.example.water belong to the same org.example namespace - Put everything in 2 namespaces: i.e. business and system!
  12. Distributed Tracing - Why did certain events happen? - Record

    events with causal ordering - High Cardinality? - Span, Trace (SpanId, TraceId, ParentSpanId) - Tag/Label/Attribute, Annotation/Event - Context Propagation - Log Correlation
  13. - Add Logs (application logs) - Add Metrics - Add

    Distributed Tracing - Other custom needs You want to instrument your application…
  14. Introducing Observation API - “New” module in Micrometer 1.10 (micrometer-observation)

    - Higher level abstraction for timing an operation - Instrument once, add handlers for your needs (e.g.: metrics, tracing, logging, etc.)
  15. FAQ - Why measuring only avg/median is not a good

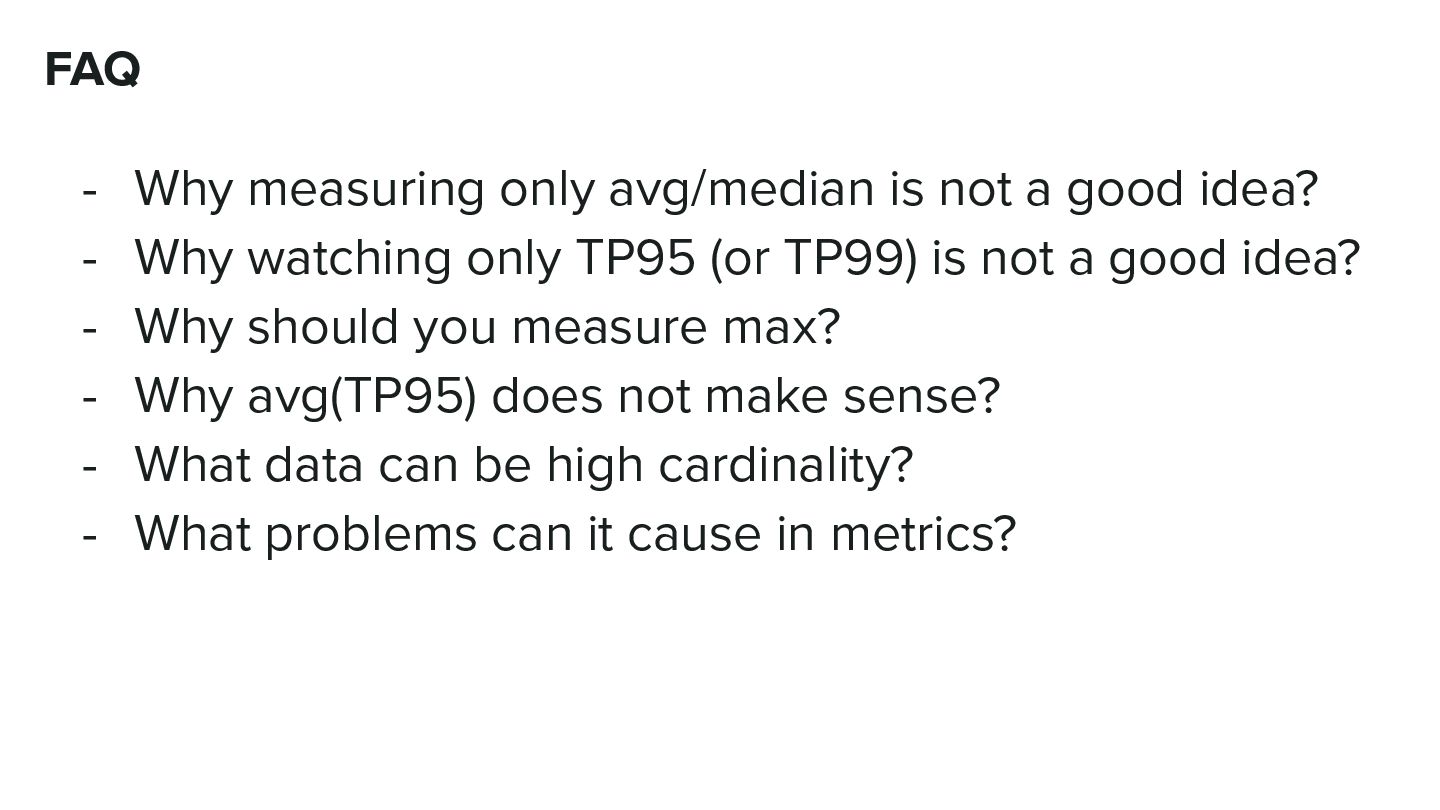
    idea? - Why watching only TP95 (or TP99) is not a good idea? - Why should you measure max? - Why avg(TP95) does not make sense? - What data can be high cardinality? - What problems can it cause in metrics?