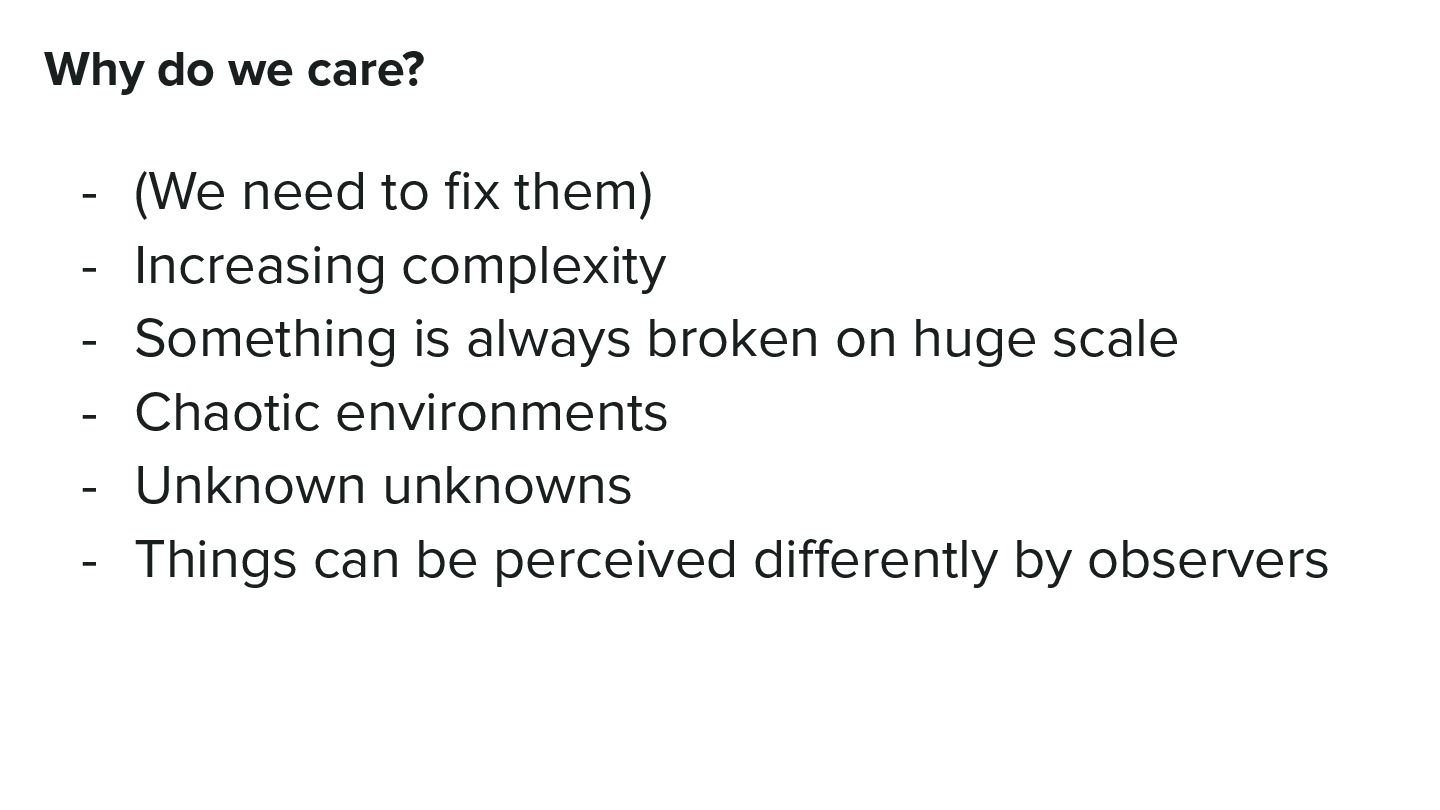
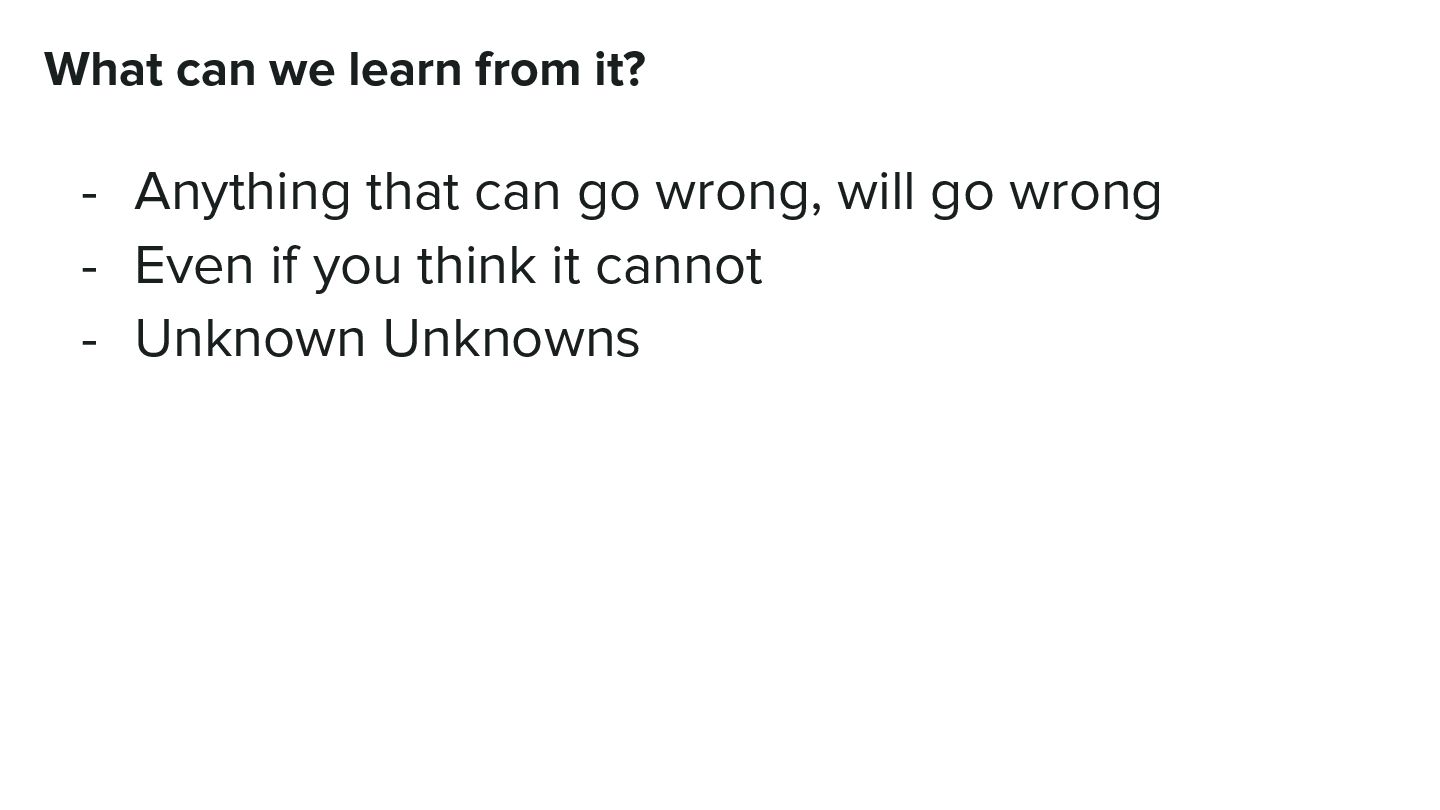
- Increasing complexity - Something is always broken on huge scale - Chaotic environments - Unknown unknowns - Things can be perceived differently by observers
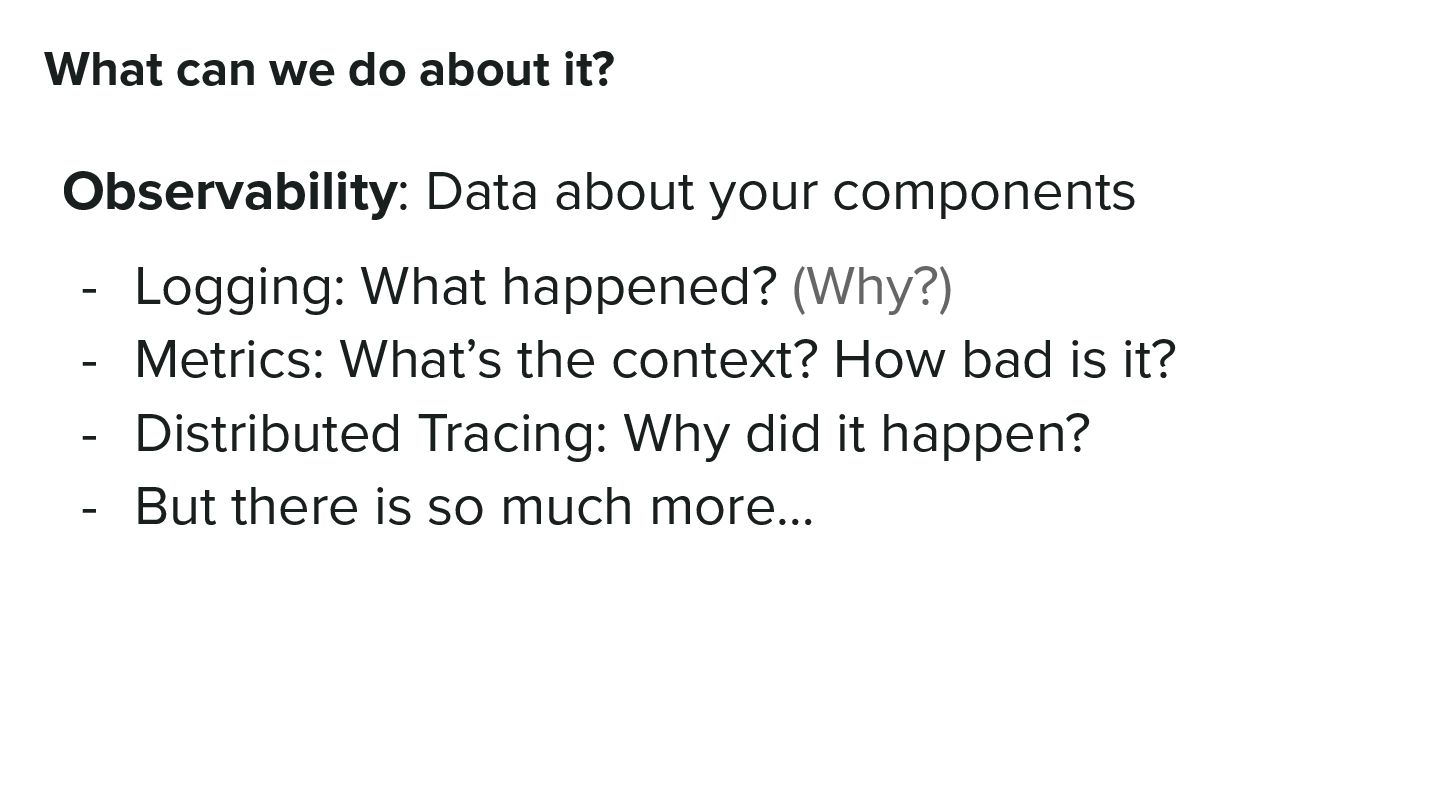
components - Logging: What happened? (Why?) - Metrics: What’s the context? How bad is it? - Distributed Tracing: Why did it happen? - But there is so much more…
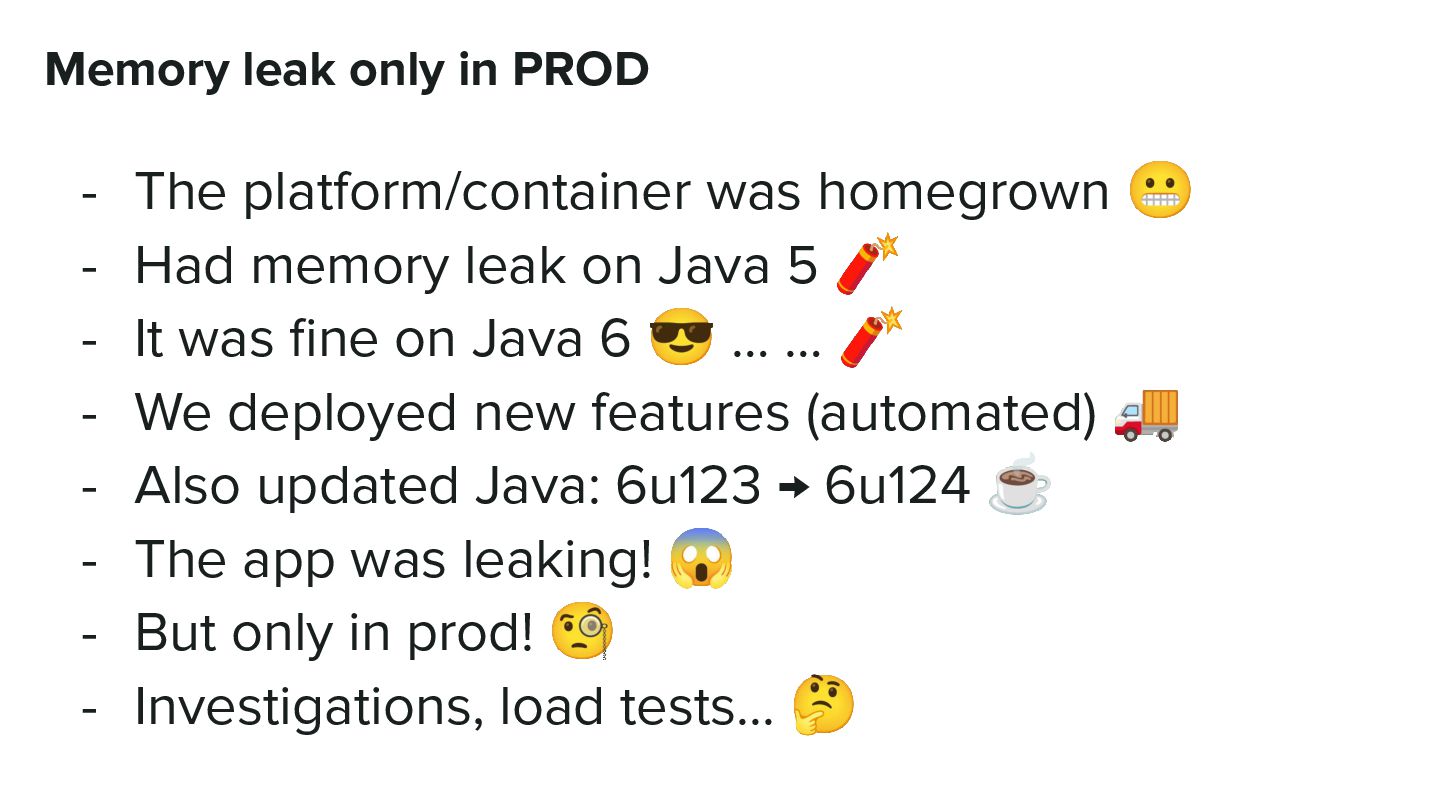
😬 - Had memory leak on Java 5 🧨 - It was fine on Java 6 😎 … … 🧨 - We deployed new features (automated) 🚚 - Also updated Java: 6u123 → 6u124 ☕ - The app was leaking! 😱 - But only in prod! 🧐 - Investigations, load tests... 🤔
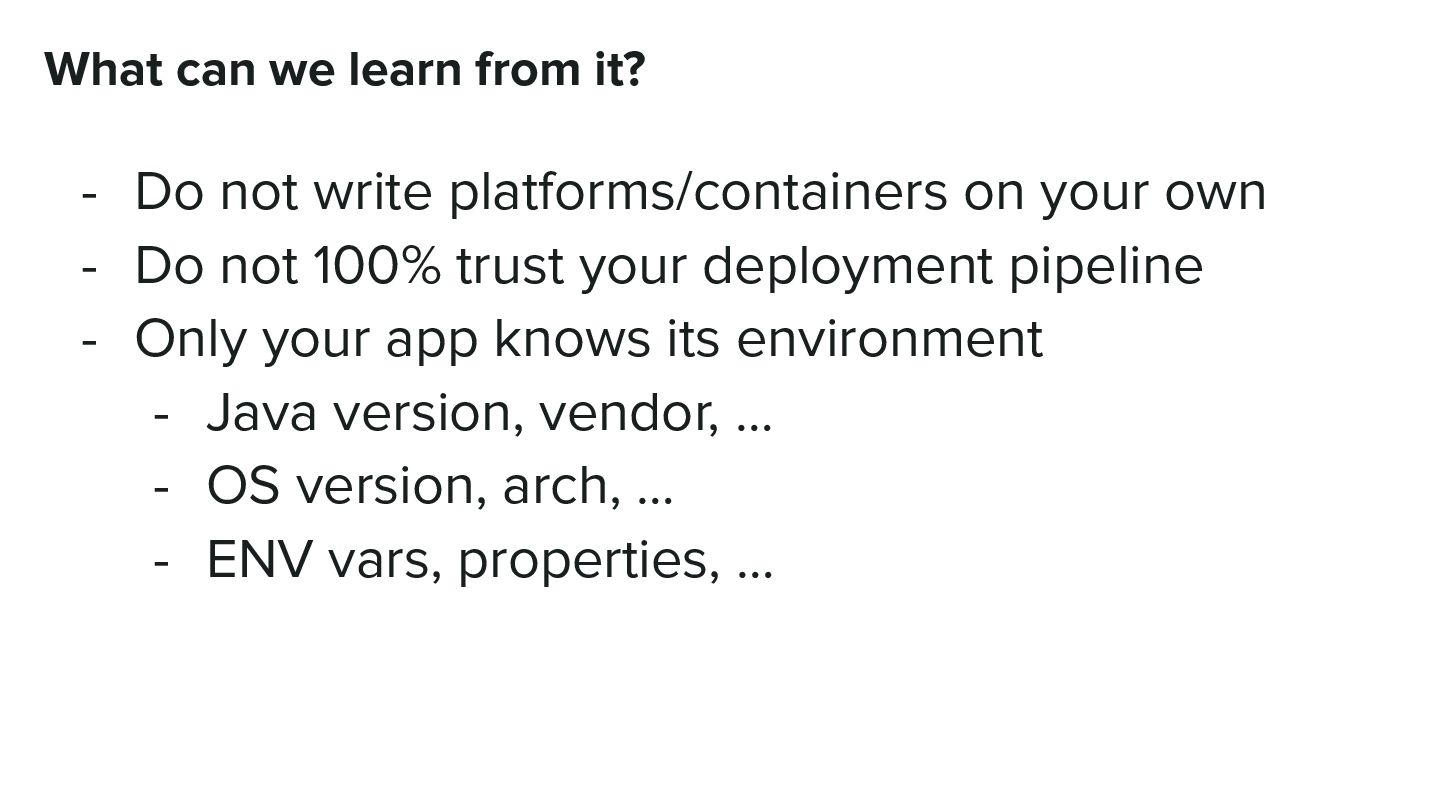
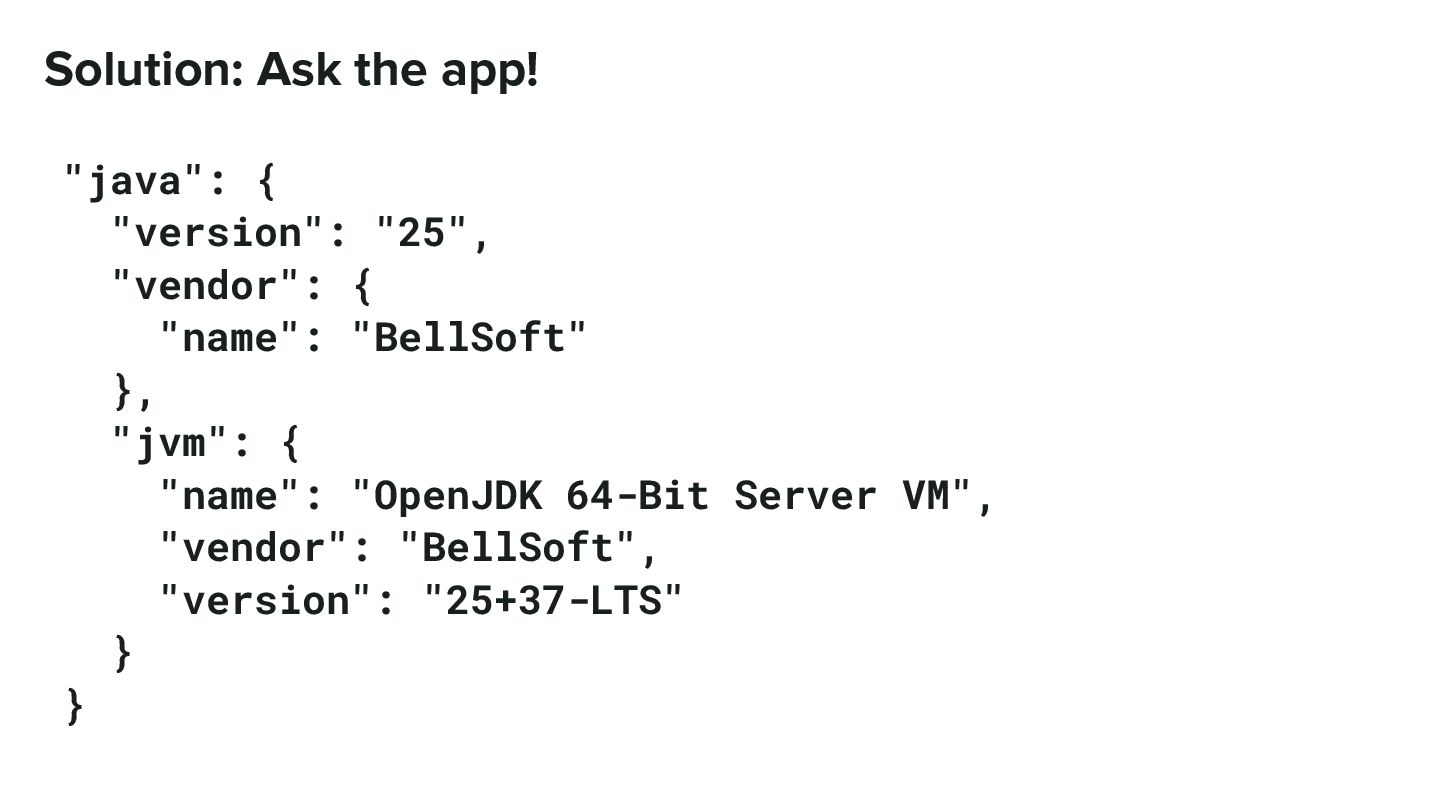
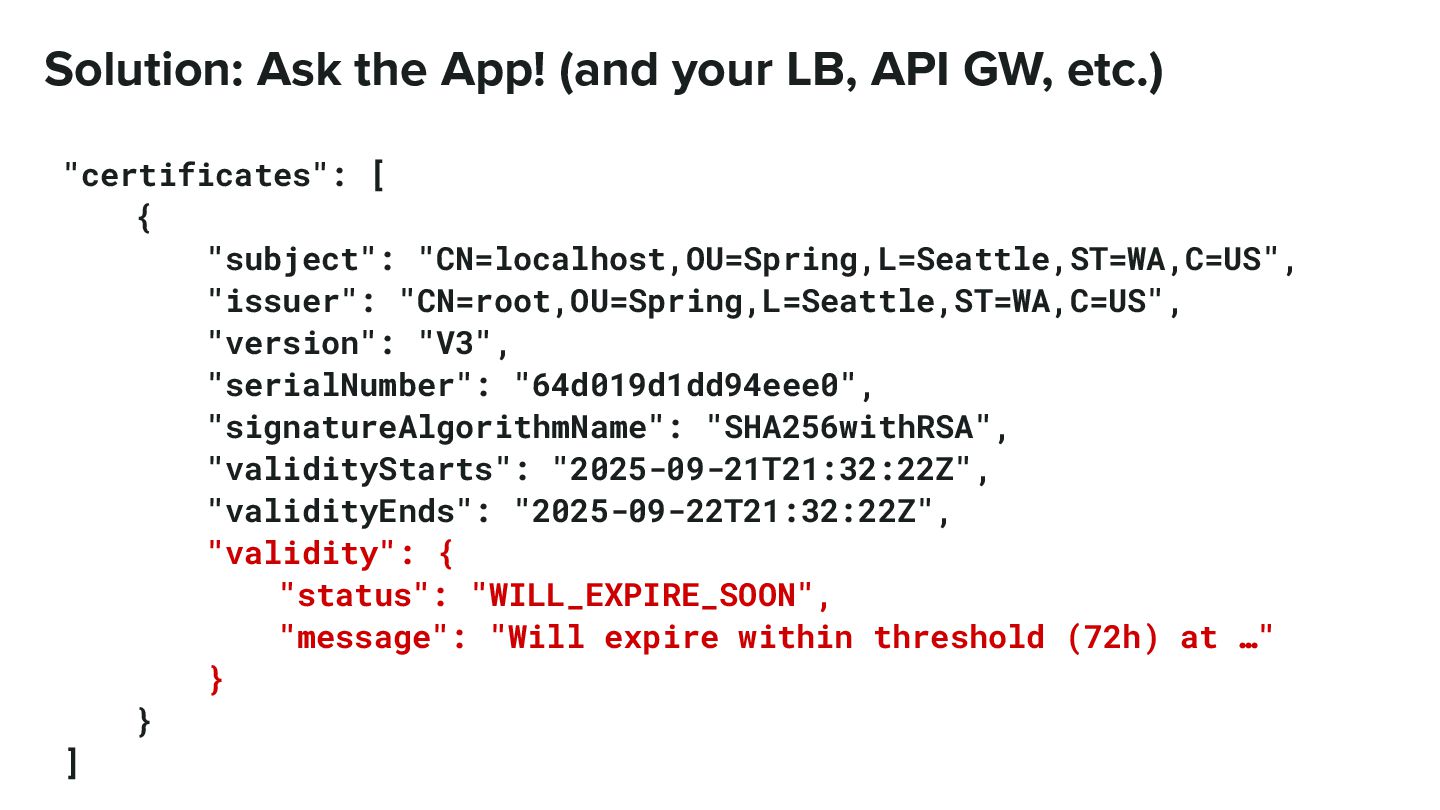
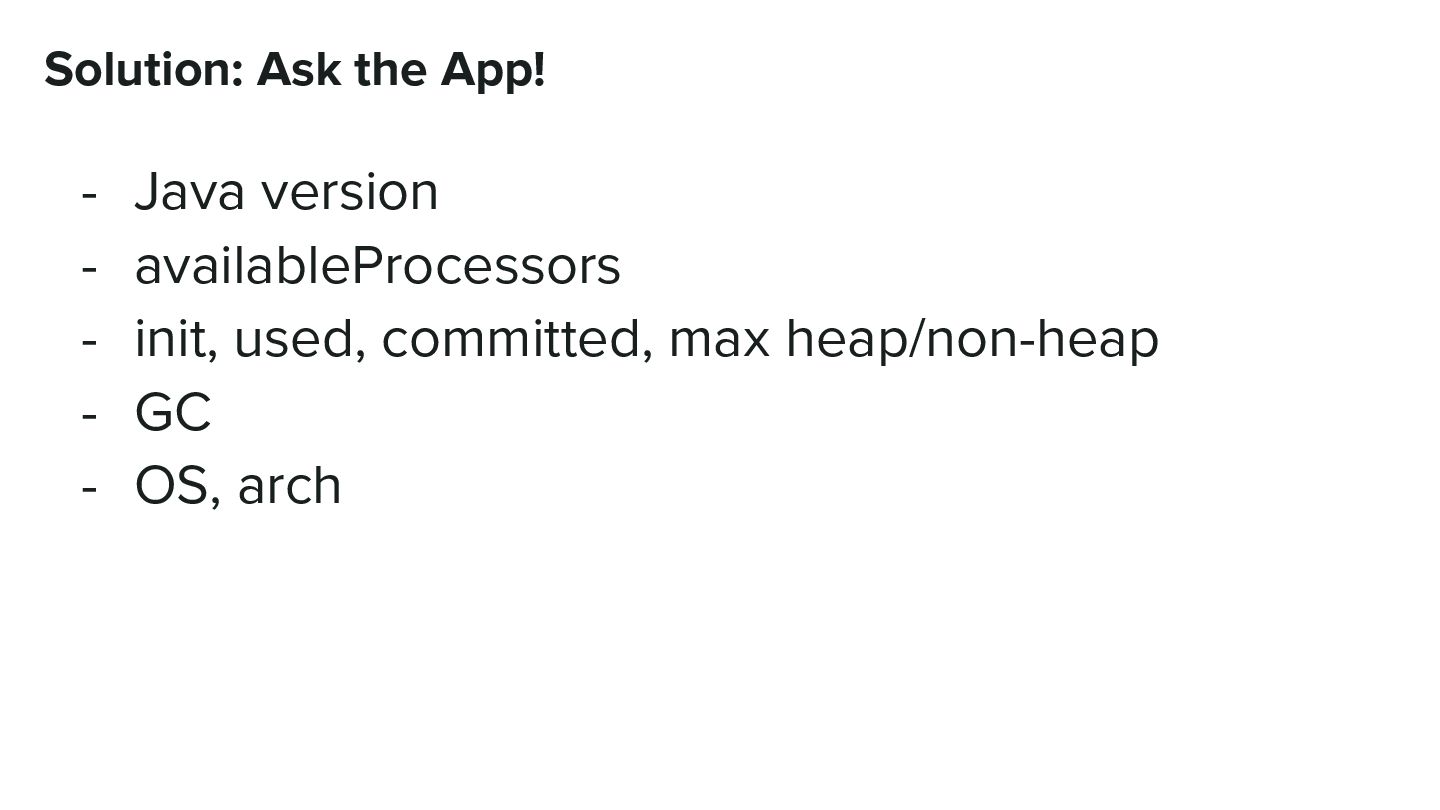
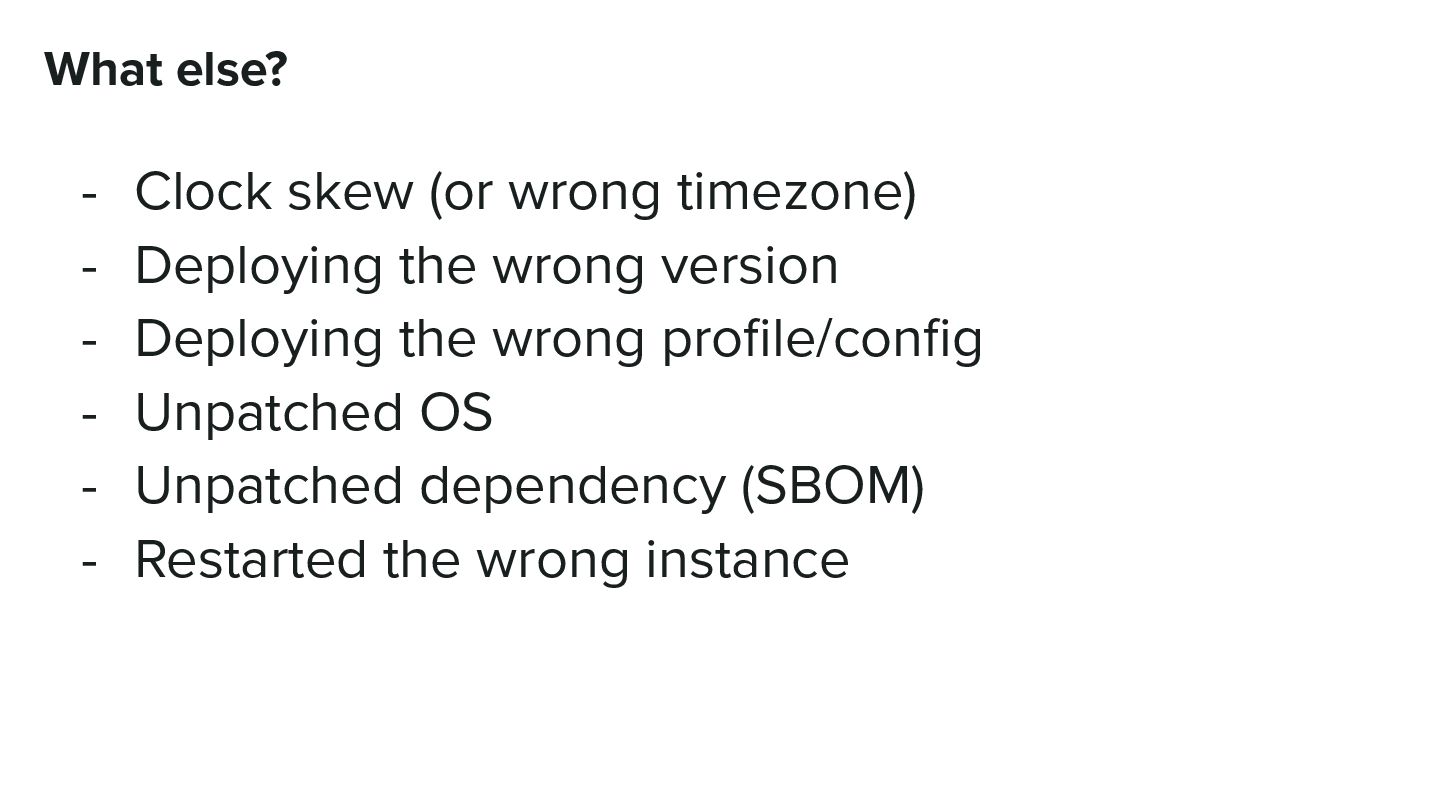
platforms/containers on your own - Do not 100% trust your deployment pipeline - Only your app knows its environment - Java version, vendor, … - OS version, arch, … - ENV vars, properties, …
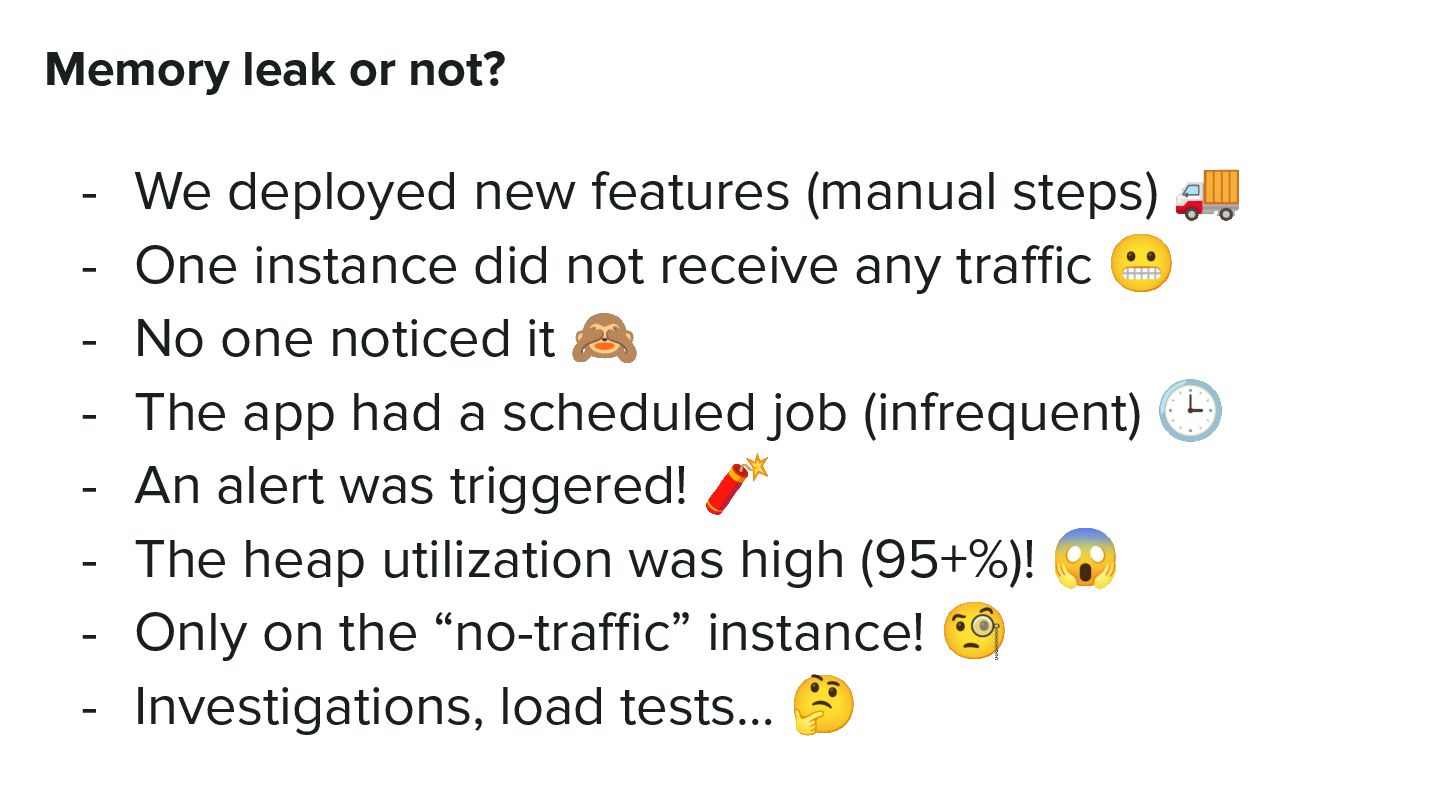
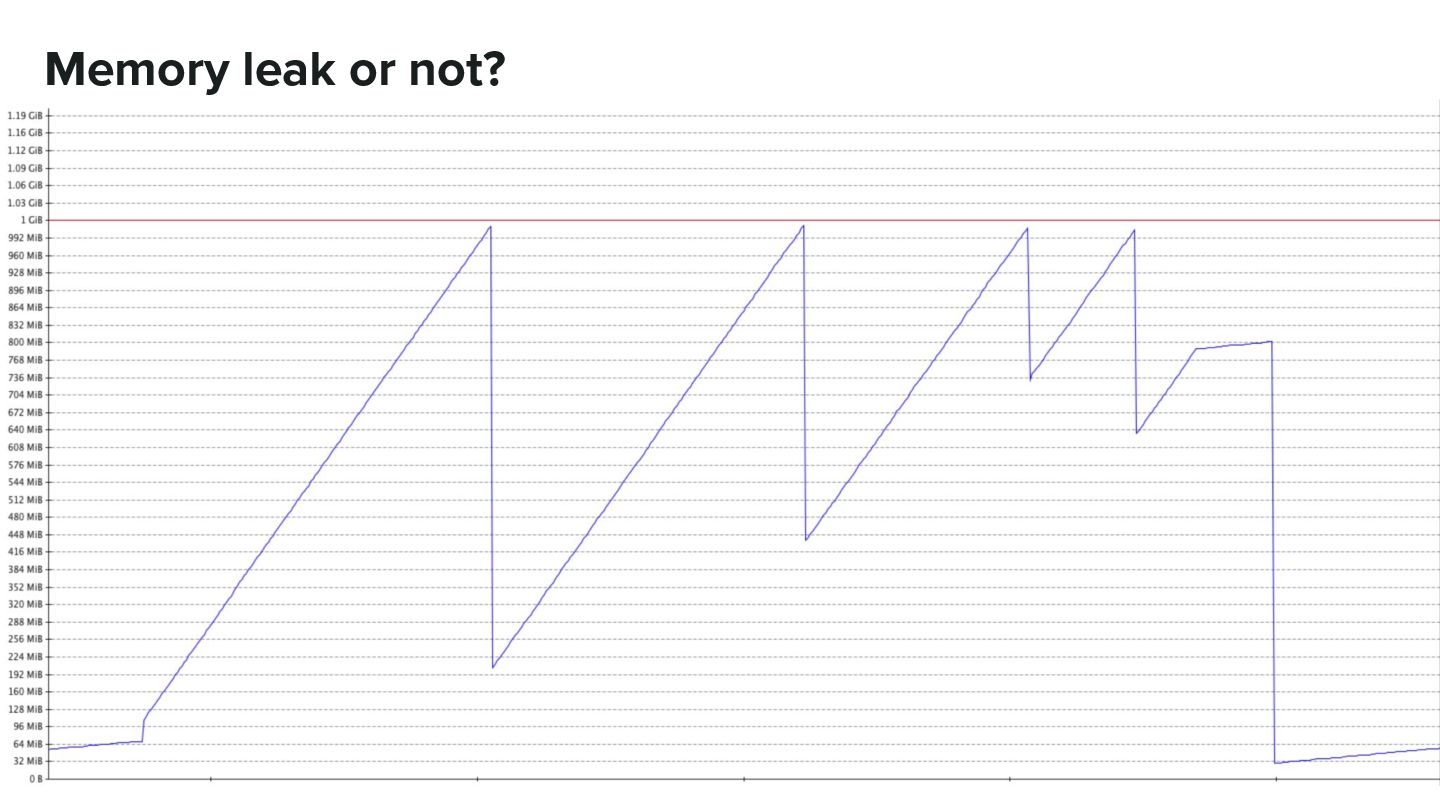
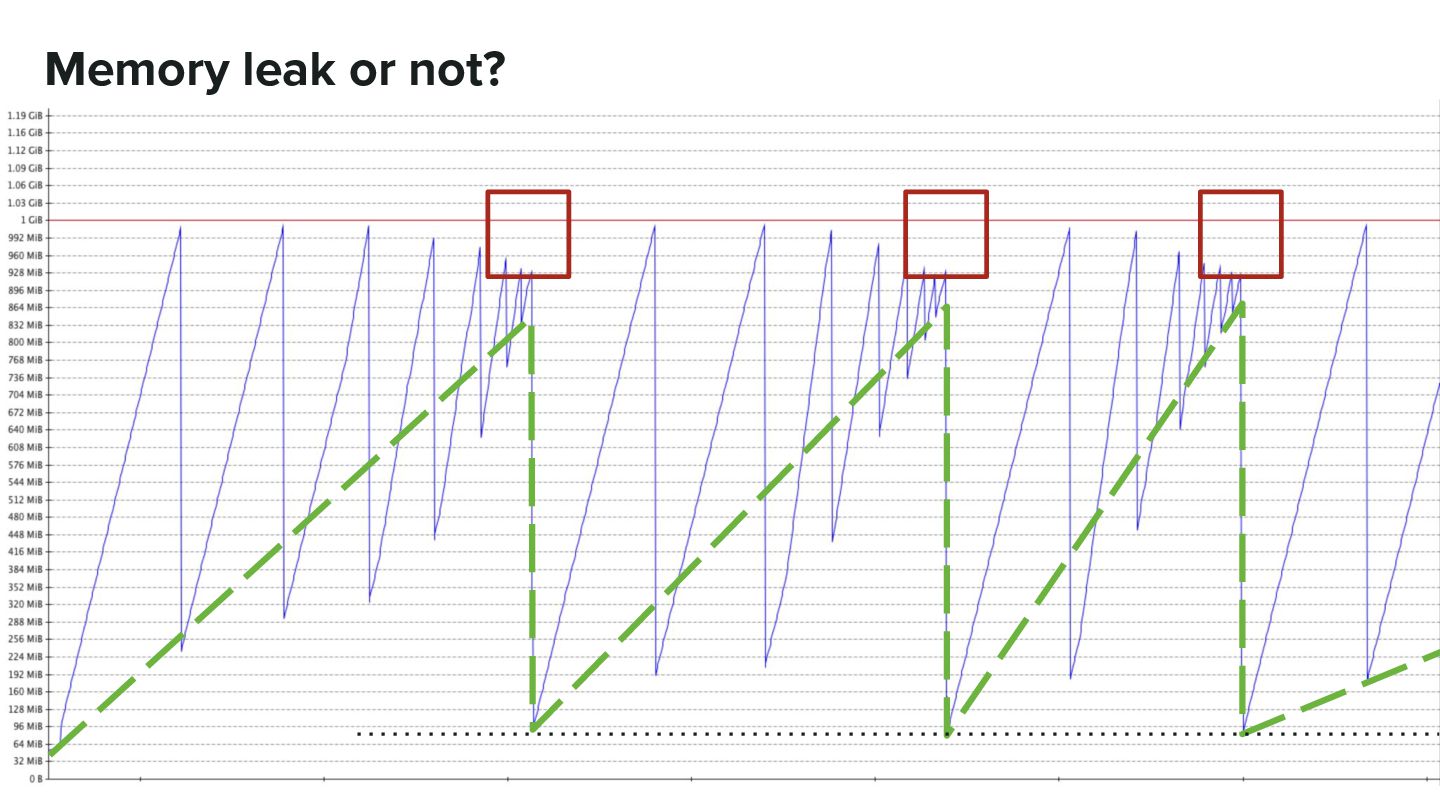
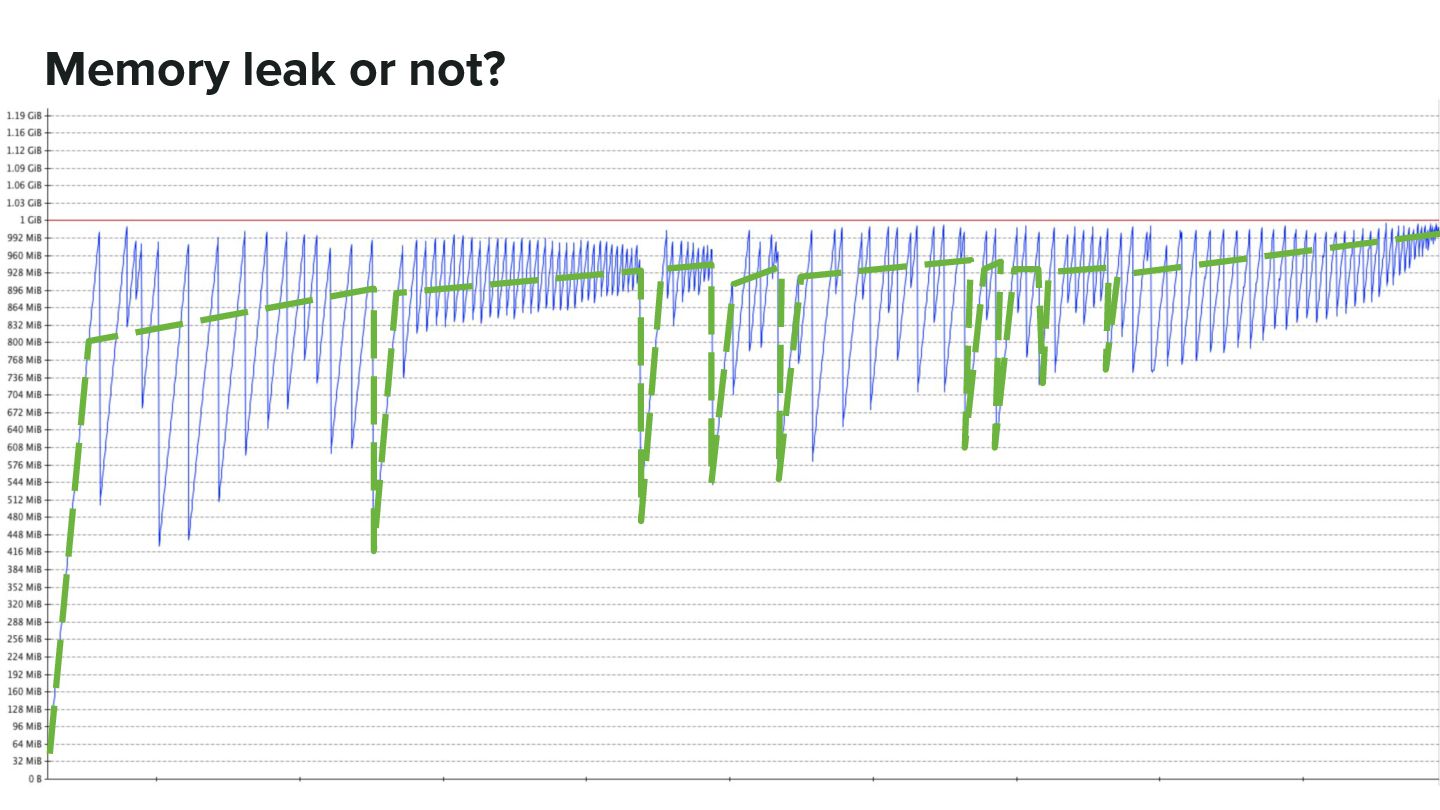
steps) 🚚 - One instance did not receive any traffic 😬 - No one noticed it 🙈 - The app had a scheduled job (infrequent) 🕒 - An alert was triggered! 🧨 - The heap utilization was high (95+%)! 😱 - Only on the “no-traffic” instance! 🧐 - Investigations, load tests… 🤔
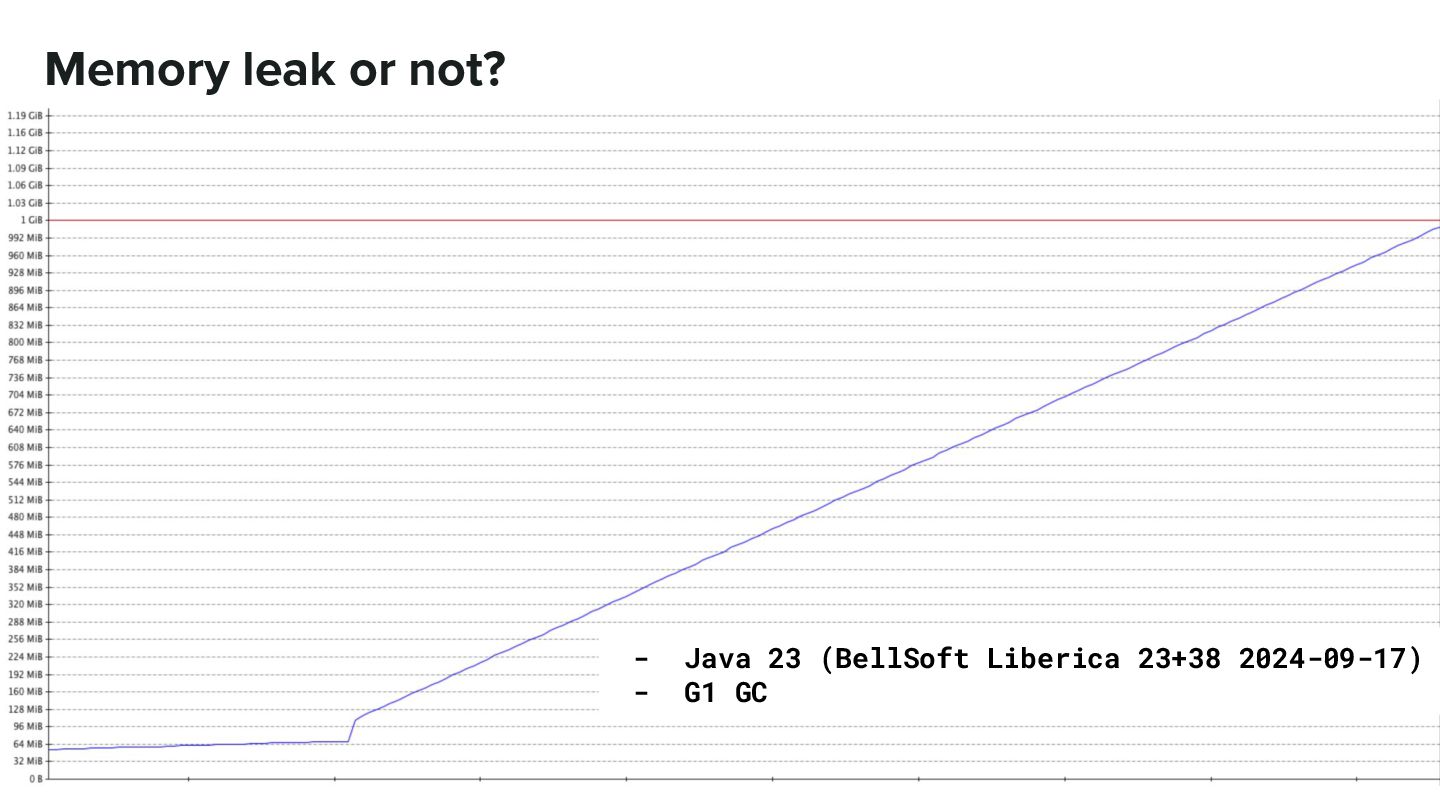
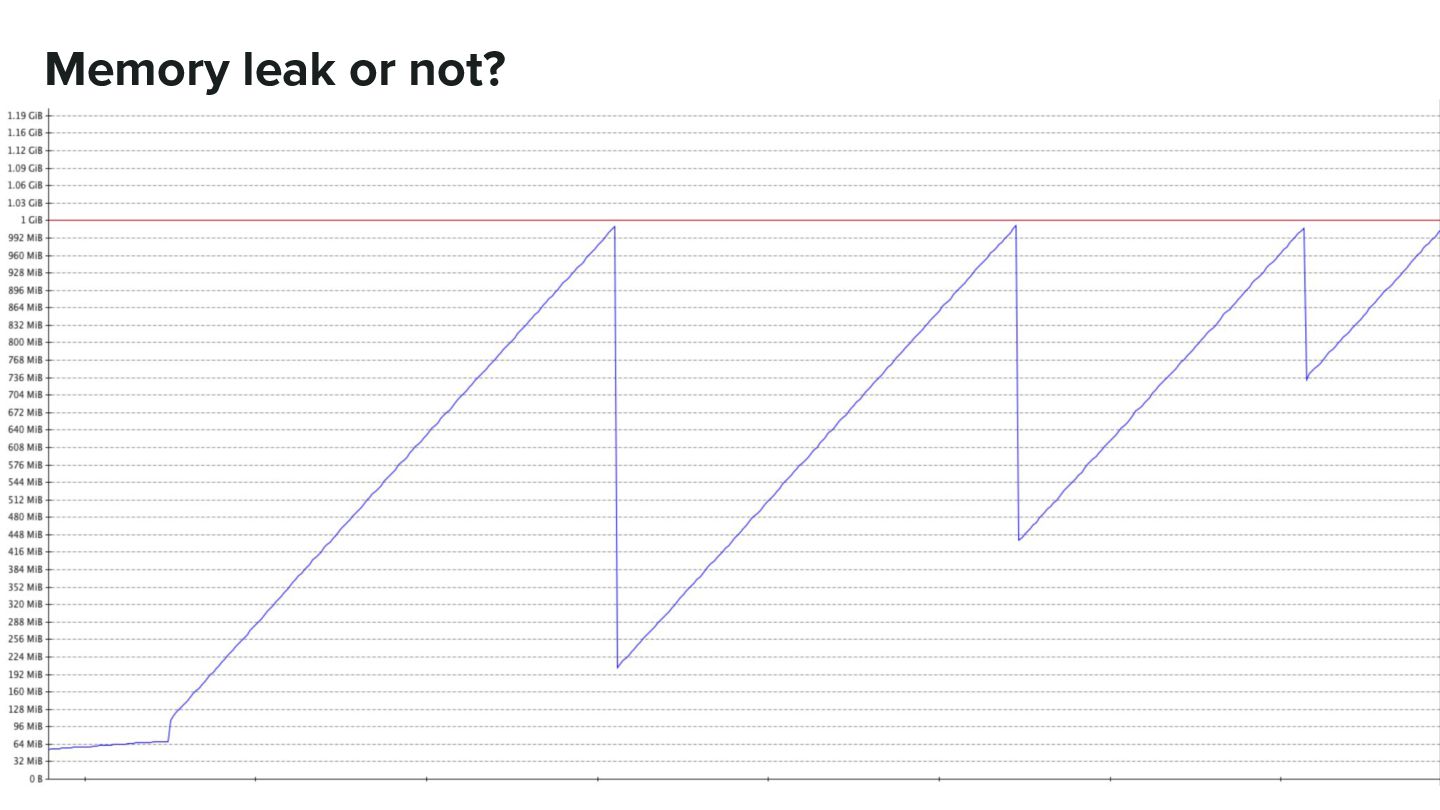
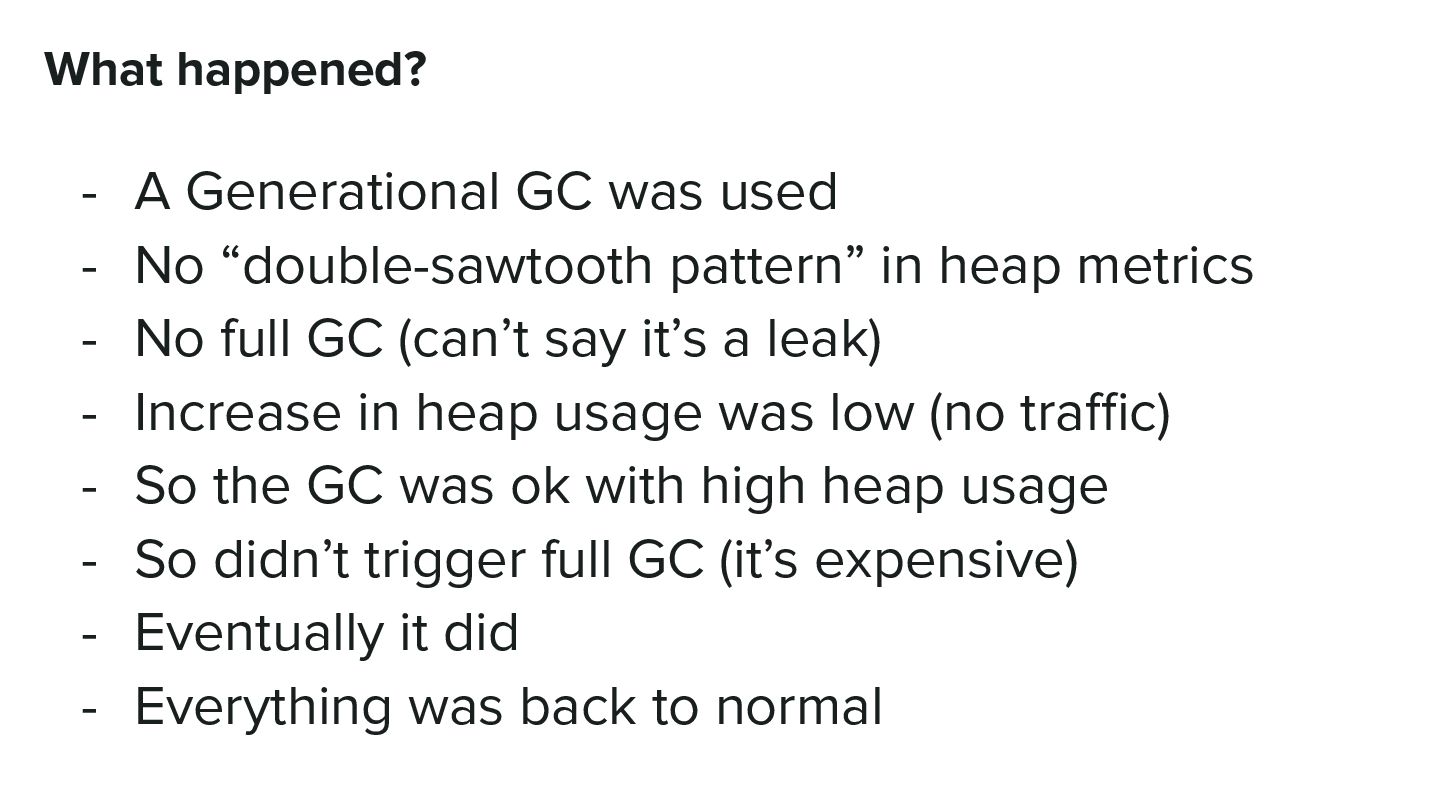
“double-sawtooth pattern” in heap metrics - No full GC (can’t say it’s a leak) - Increase in heap usage was low (no traffic) - So the GC was ok with high heap usage - So didn’t trigger full GC (it’s expensive) - Eventually it did - Everything was back to normal
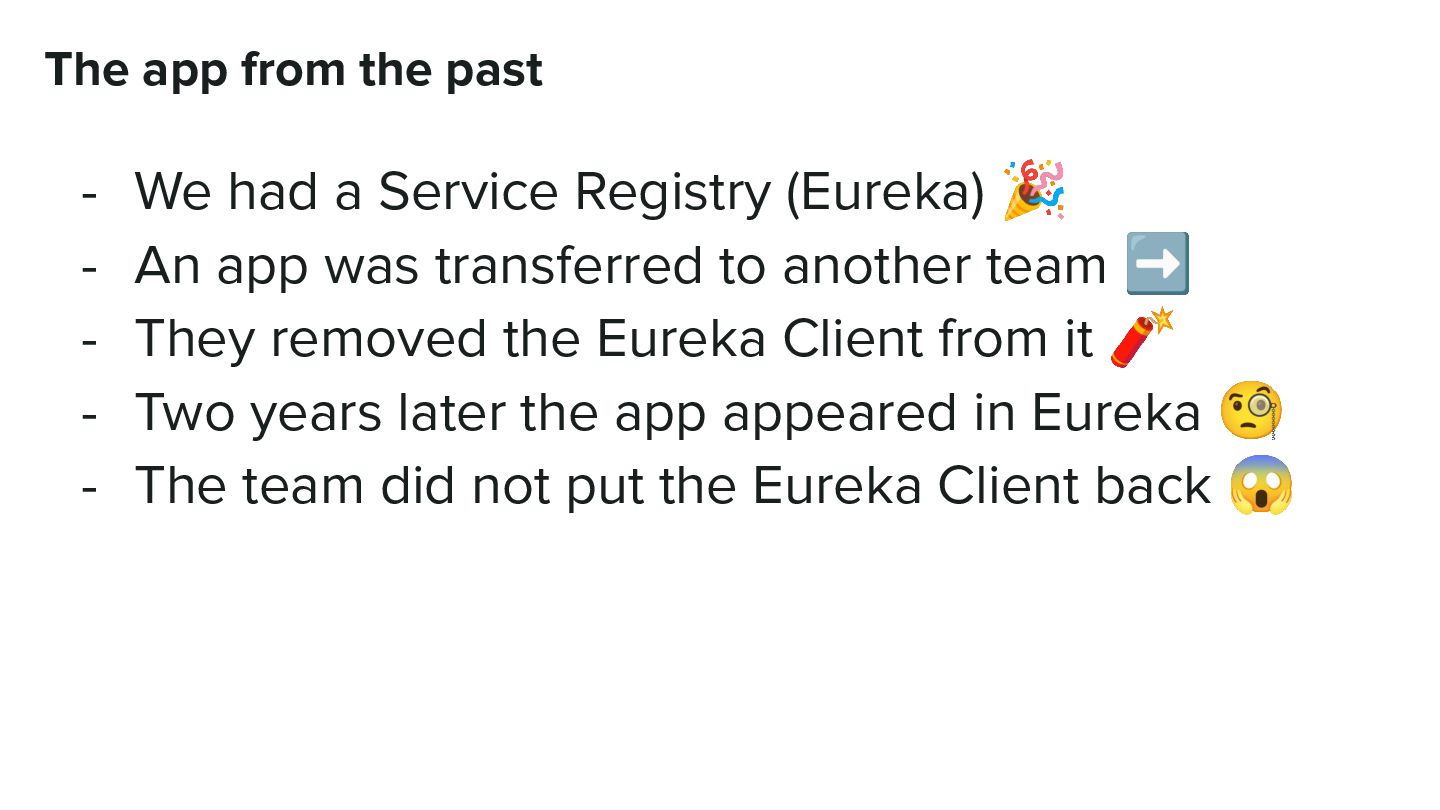
Registry (Eureka) 🎉 - An app was transferred to another team ➡ - They removed the Eureka Client from it 🧨 - Two years later the app appeared in Eureka 🧐 - The team did not put the Eureka Client back 😱
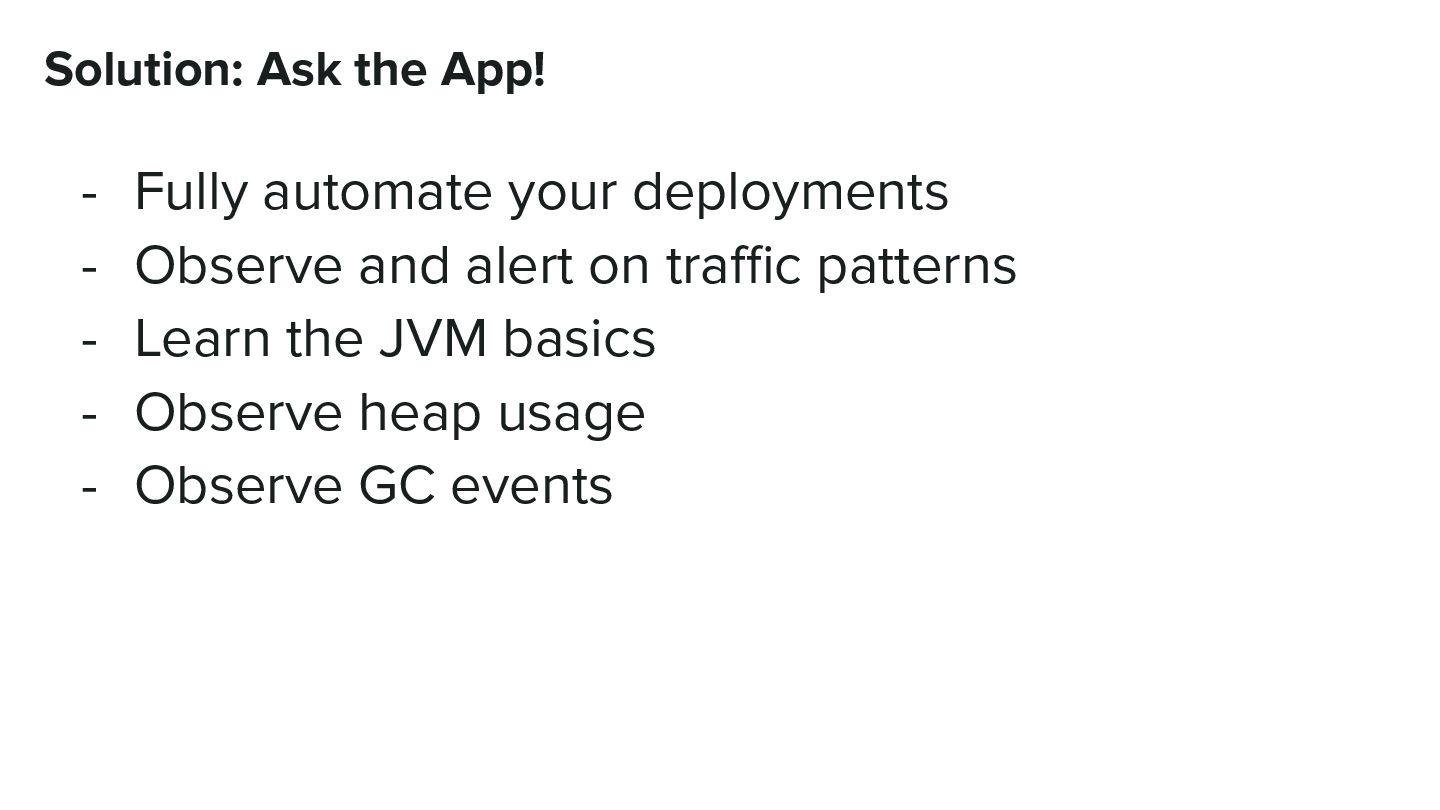
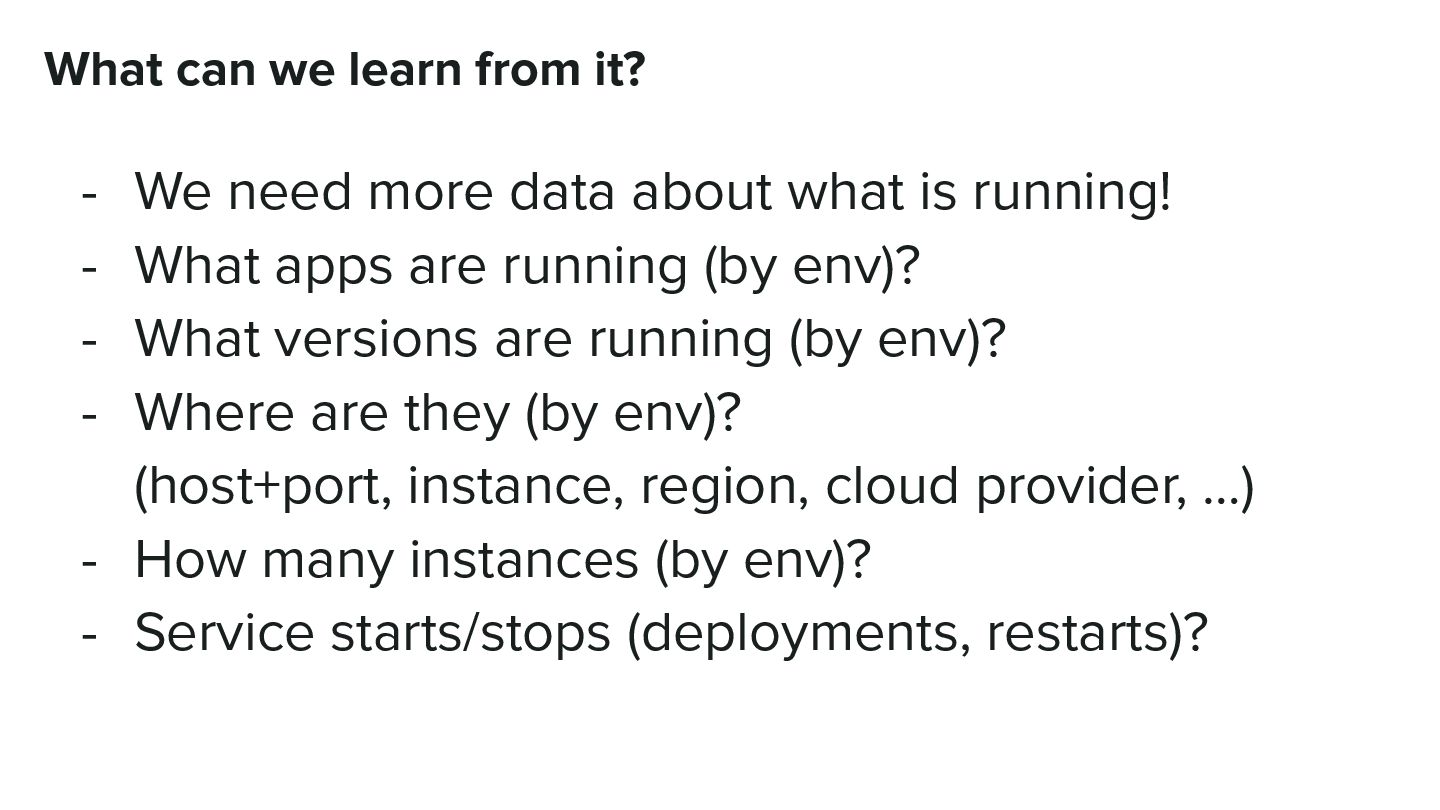
data about what is running! - What apps are running (by env)? - What versions are running (by env)? - Where are they (by env)? (host+port, instance, region, cloud provider, …) - How many instances (by env)? - Service starts/stops (deployments, restarts)?
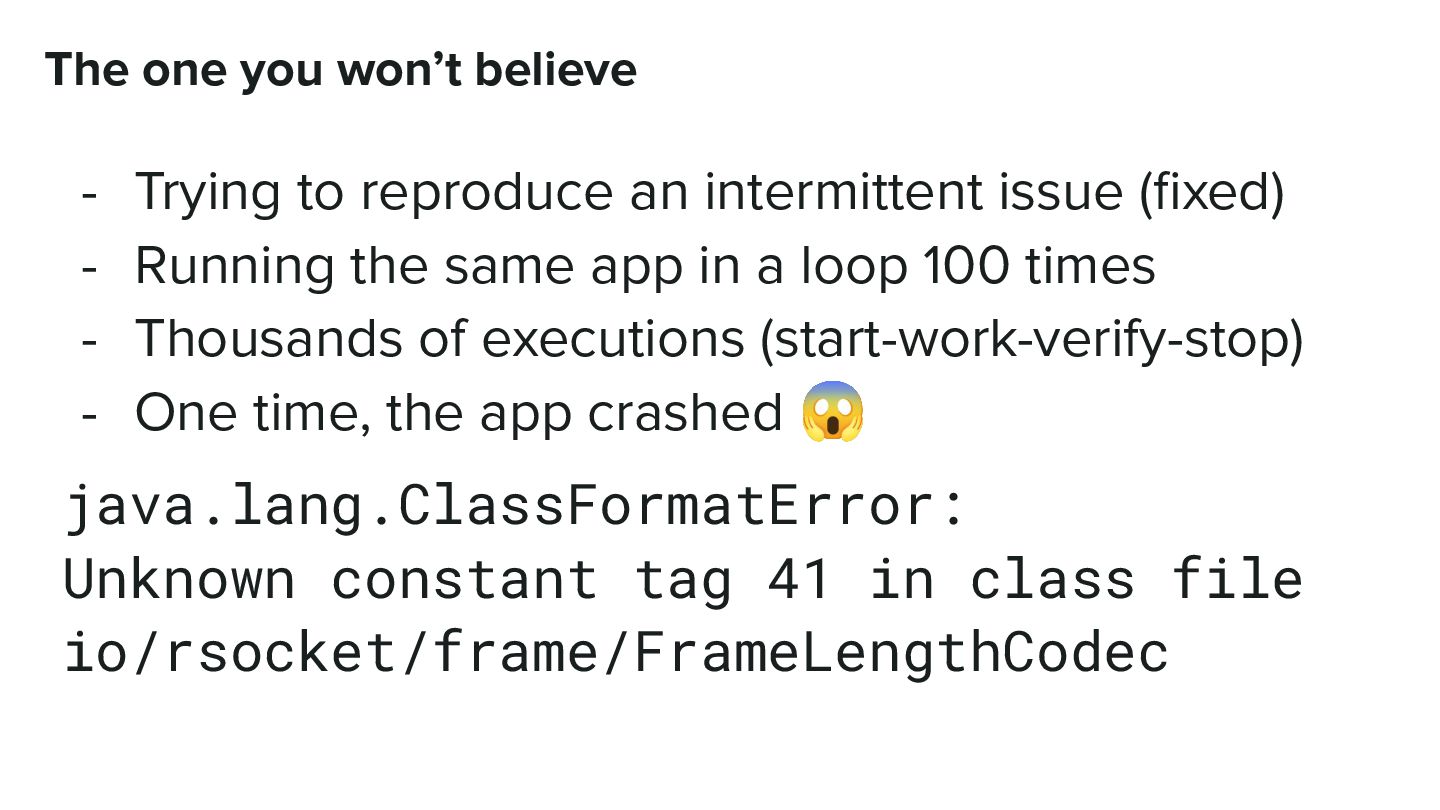
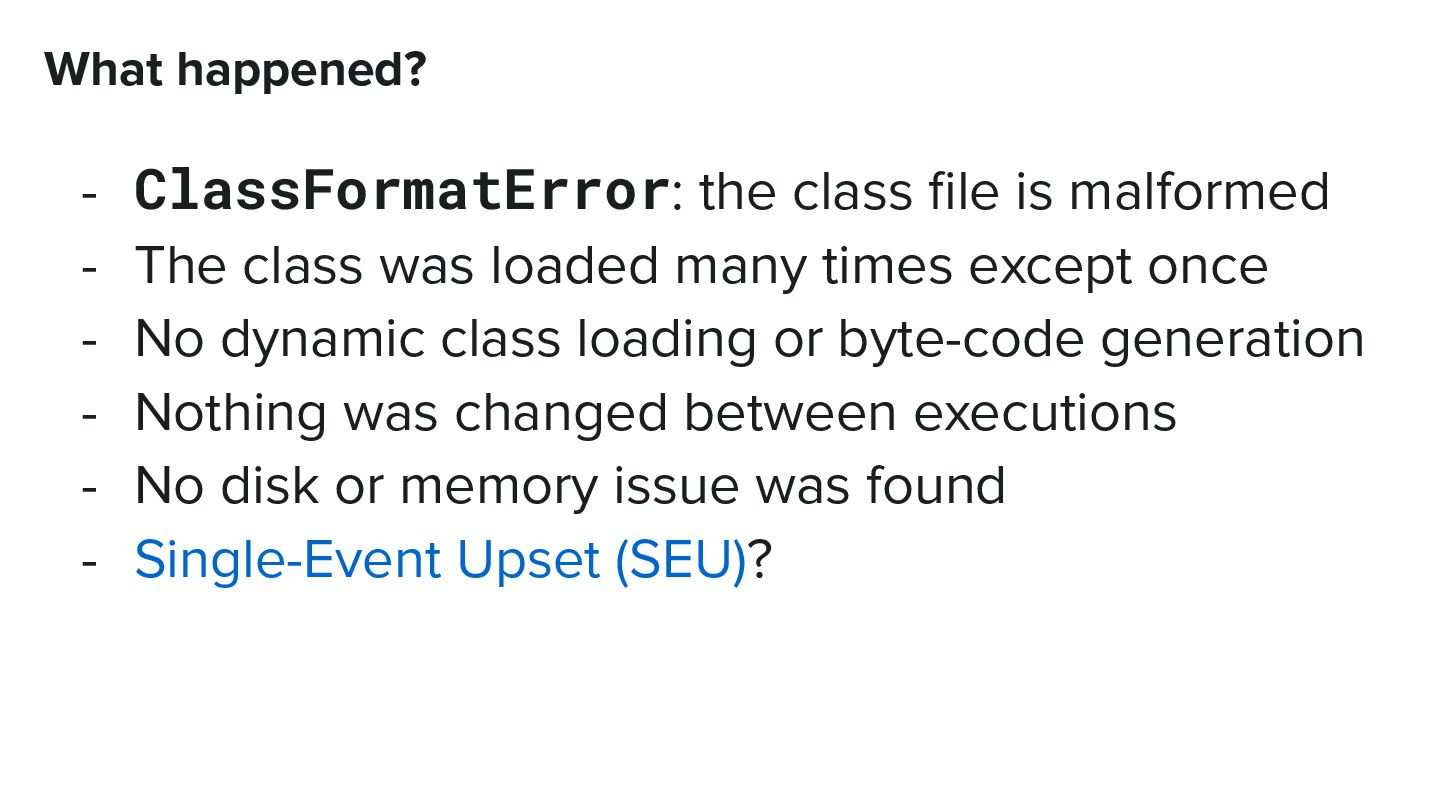
intermittent issue (fixed) - Running the same app in a loop 100 times - Thousands of executions (start-work-verify-stop) - One time, the app crashed 😱 java.lang.ClassFormatError: Unknown constant tag 41 in class file io/rsocket/frame/FrameLengthCodec
The class was loaded many times except once - No dynamic class loading or byte-code generation - Nothing was changed between executions - No disk or memory issue was found - Single-Event Upset (SEU)?
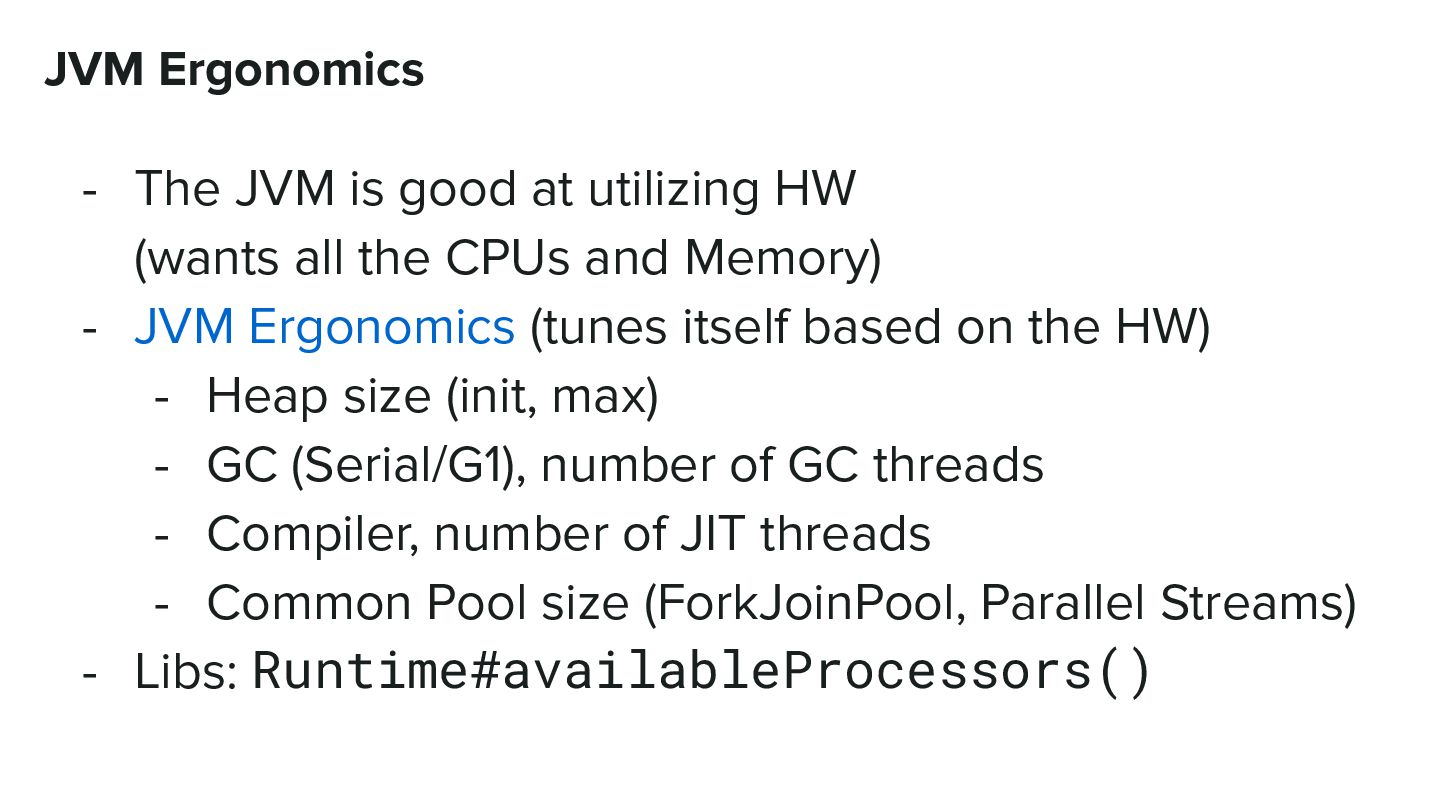
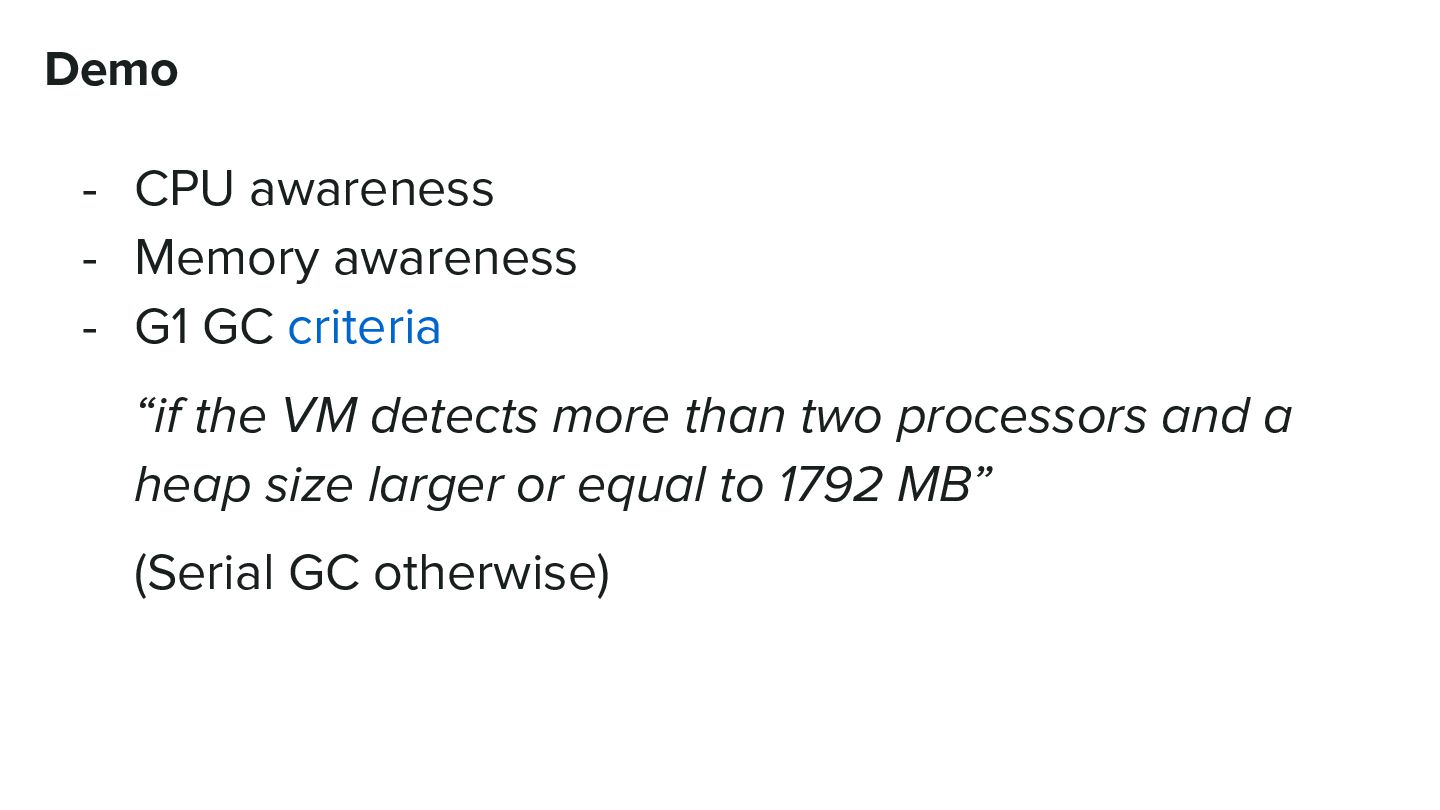
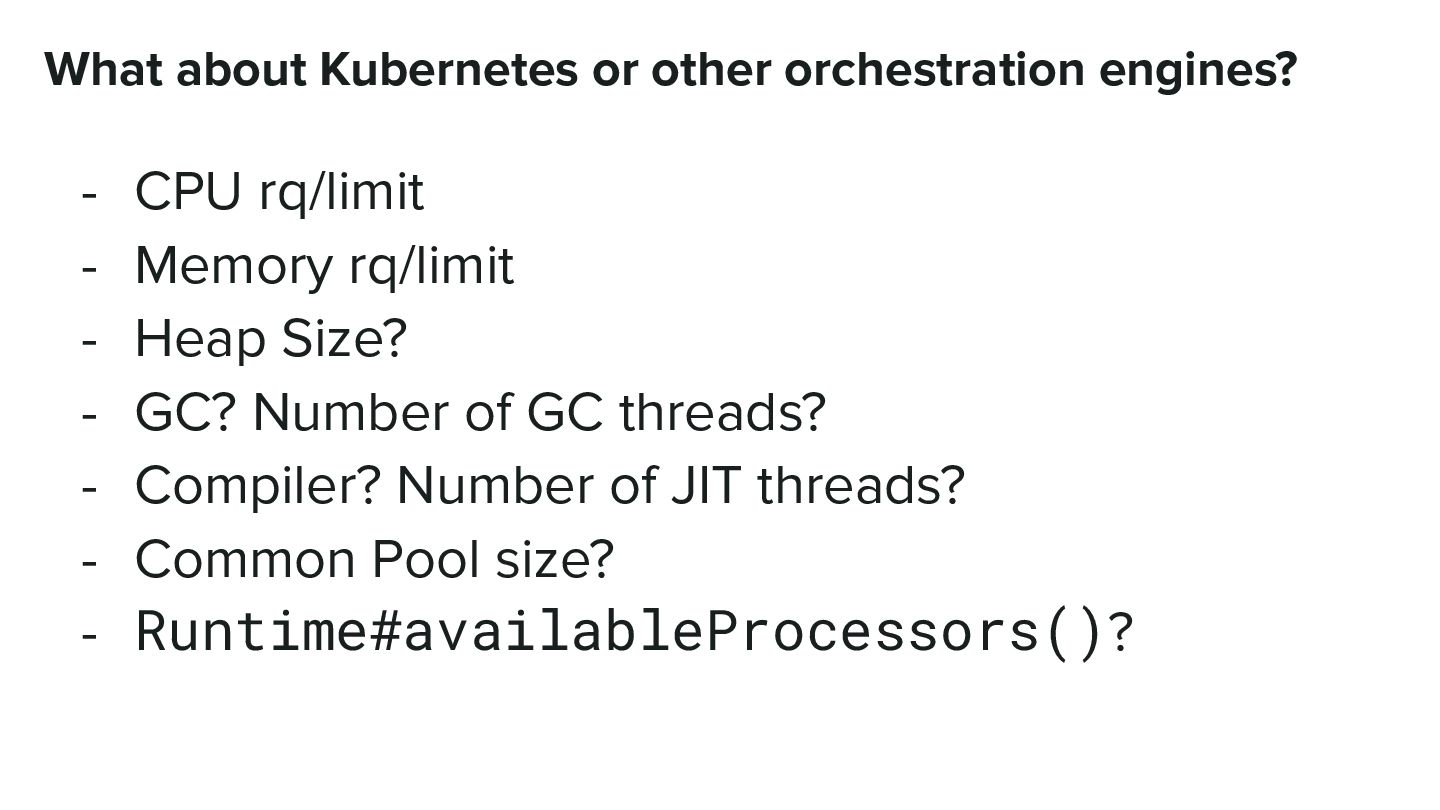
(wants all the CPUs and Memory) - JVM Ergonomics (tunes itself based on the HW) - Heap size (init, max) - GC (Serial/G1), number of GC threads - Compiler, number of JIT threads - Common Pool size (ForkJoinPool, Parallel Streams) - Libs: Runtime#availableProcessors()
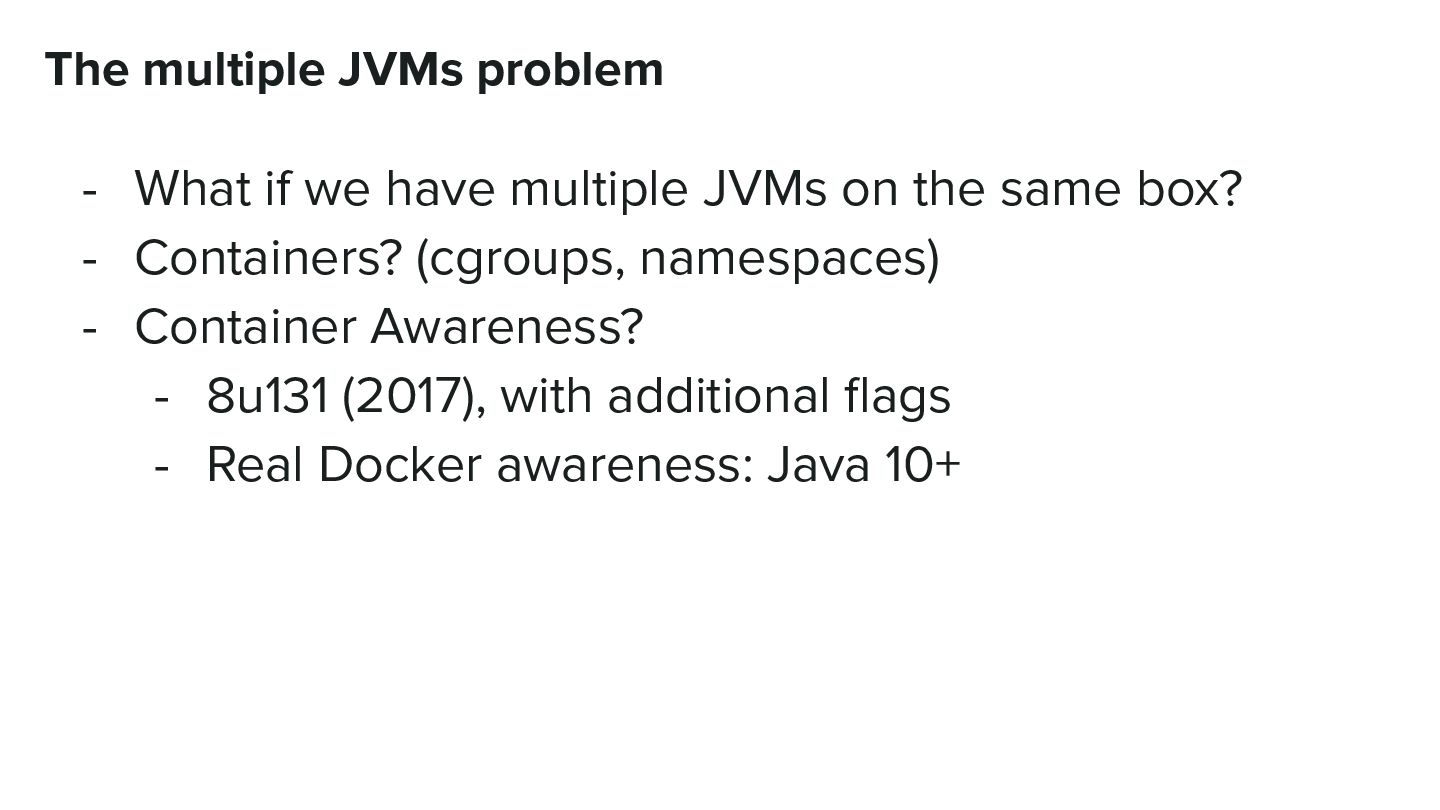
JVMs on the same box? - Containers? (cgroups, namespaces) - Container Awareness? - 8u131 (2017), with additional flags - Real Docker awareness: Java 10+
- Why watching only TP95 (or TP99) is not a good idea? - Why should you measure max? - Why avg(TP95) does not make sense? - What is high cardinality? - What problems can it cause in metrics?