problem across platforms, species, and tissues Kevin Yip Lab Director of the Center of Data Science and A.I. Sanford Burnham Prebys Medical Discovery Institute Journal club 7/8/26
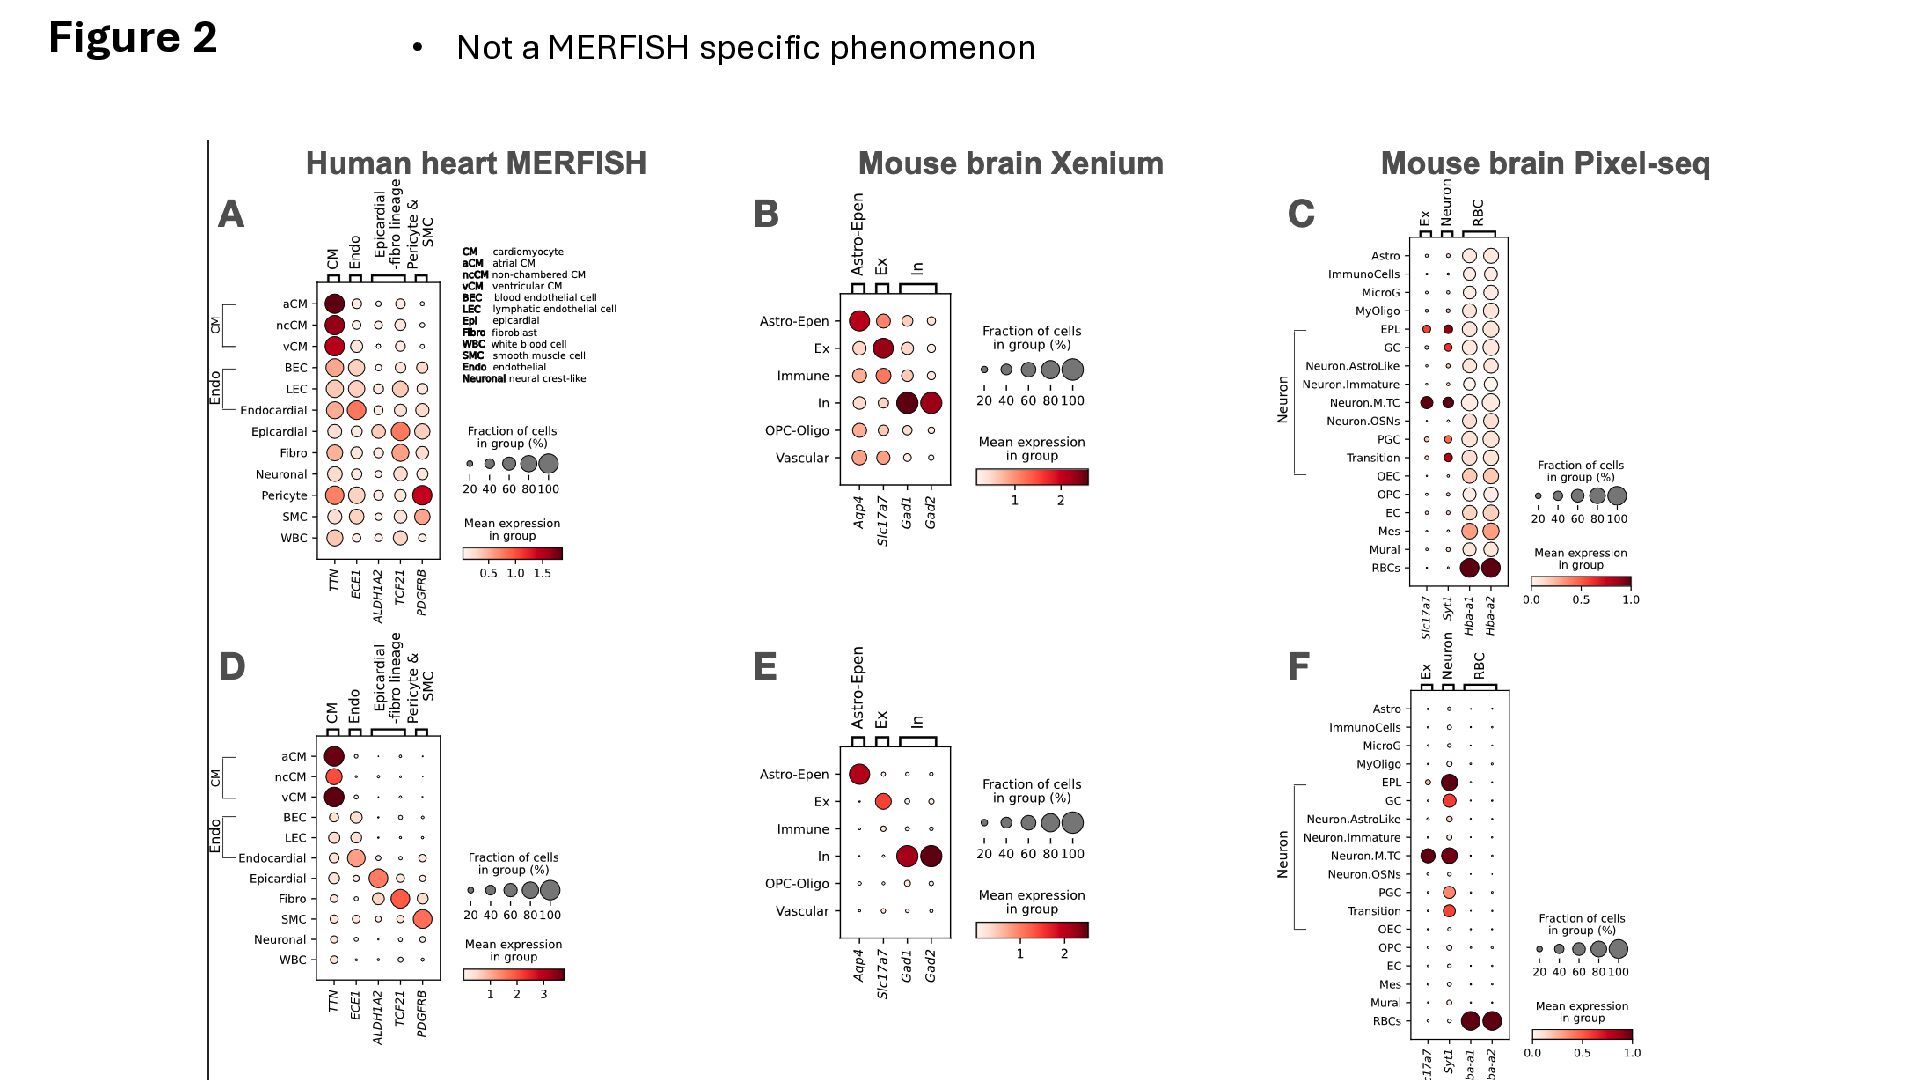
in cell-types that they are not expected to be expressed. • Paper claims to show this is due to ‘transcript leakage’, transcripts from neighboring cells essentially spread out spatially • Genes vary in their leakage properties, necessitating a leakage- specific computational method
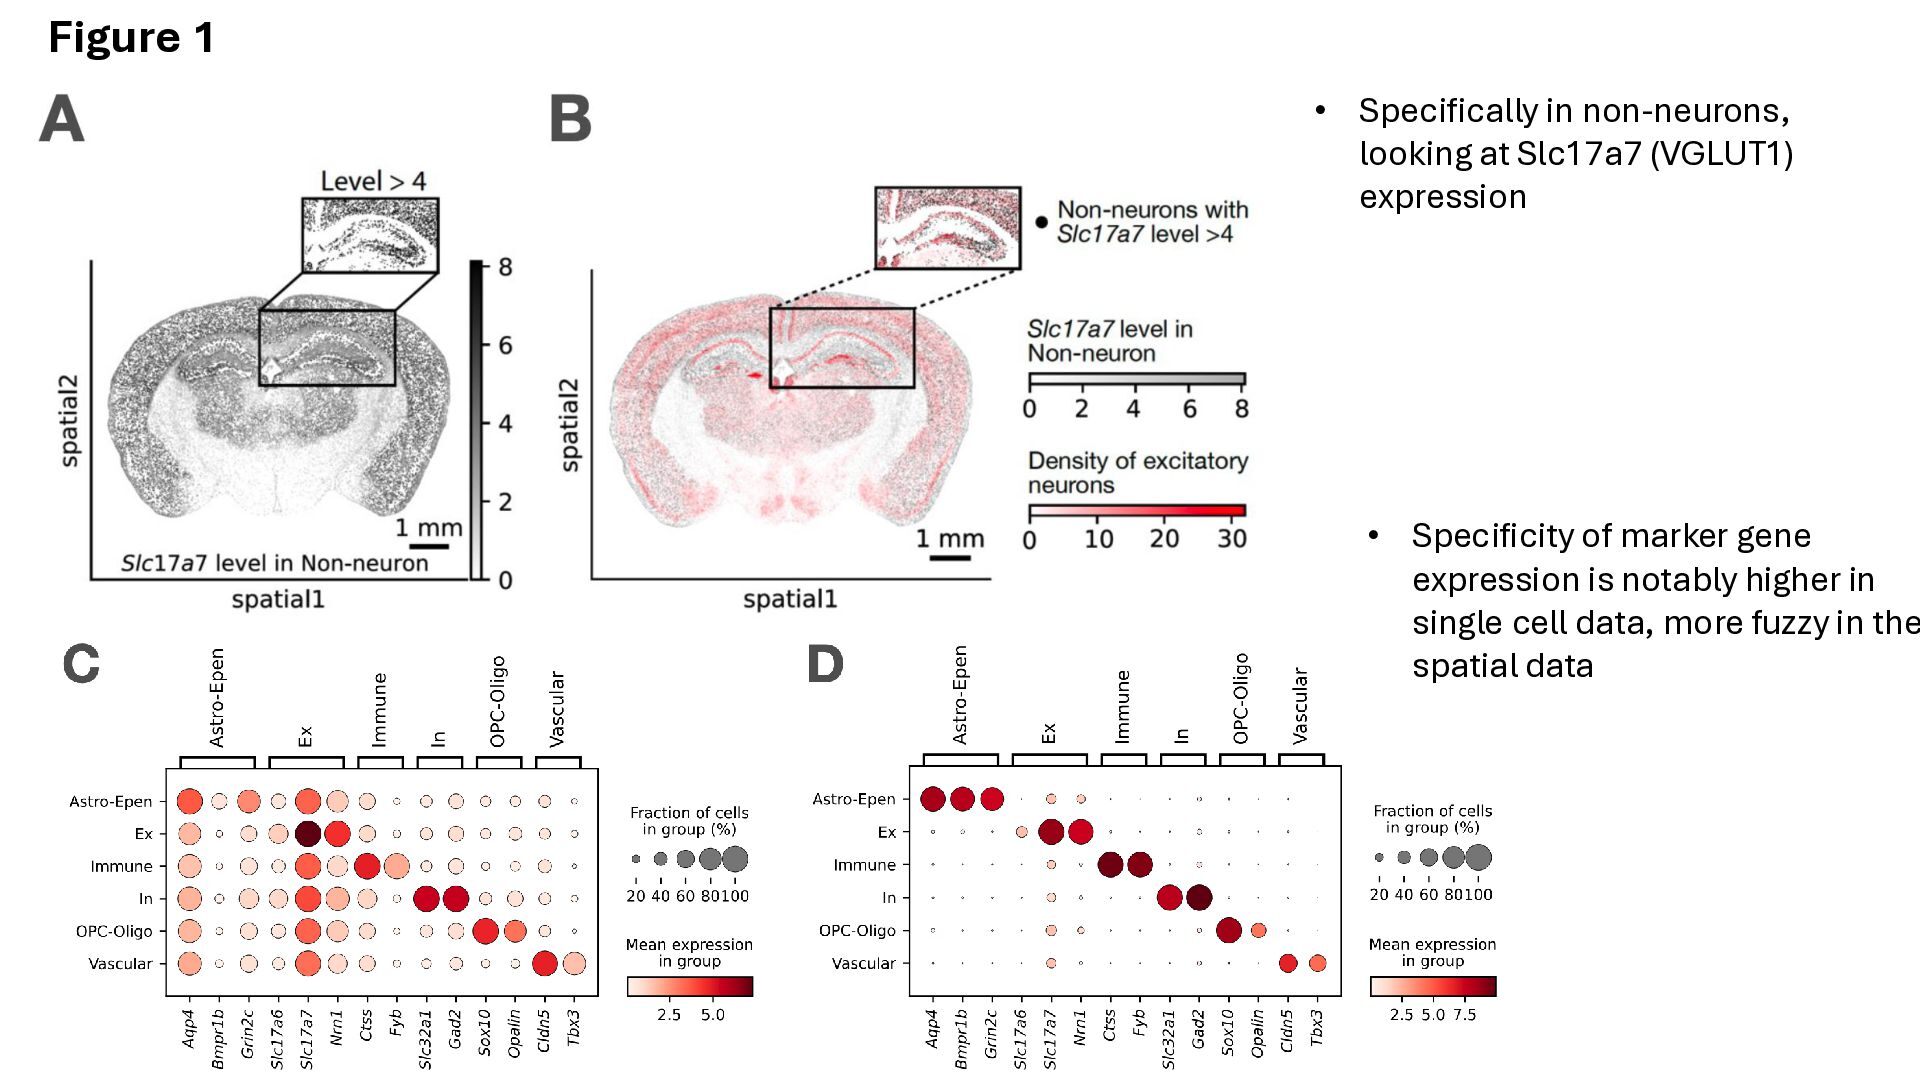
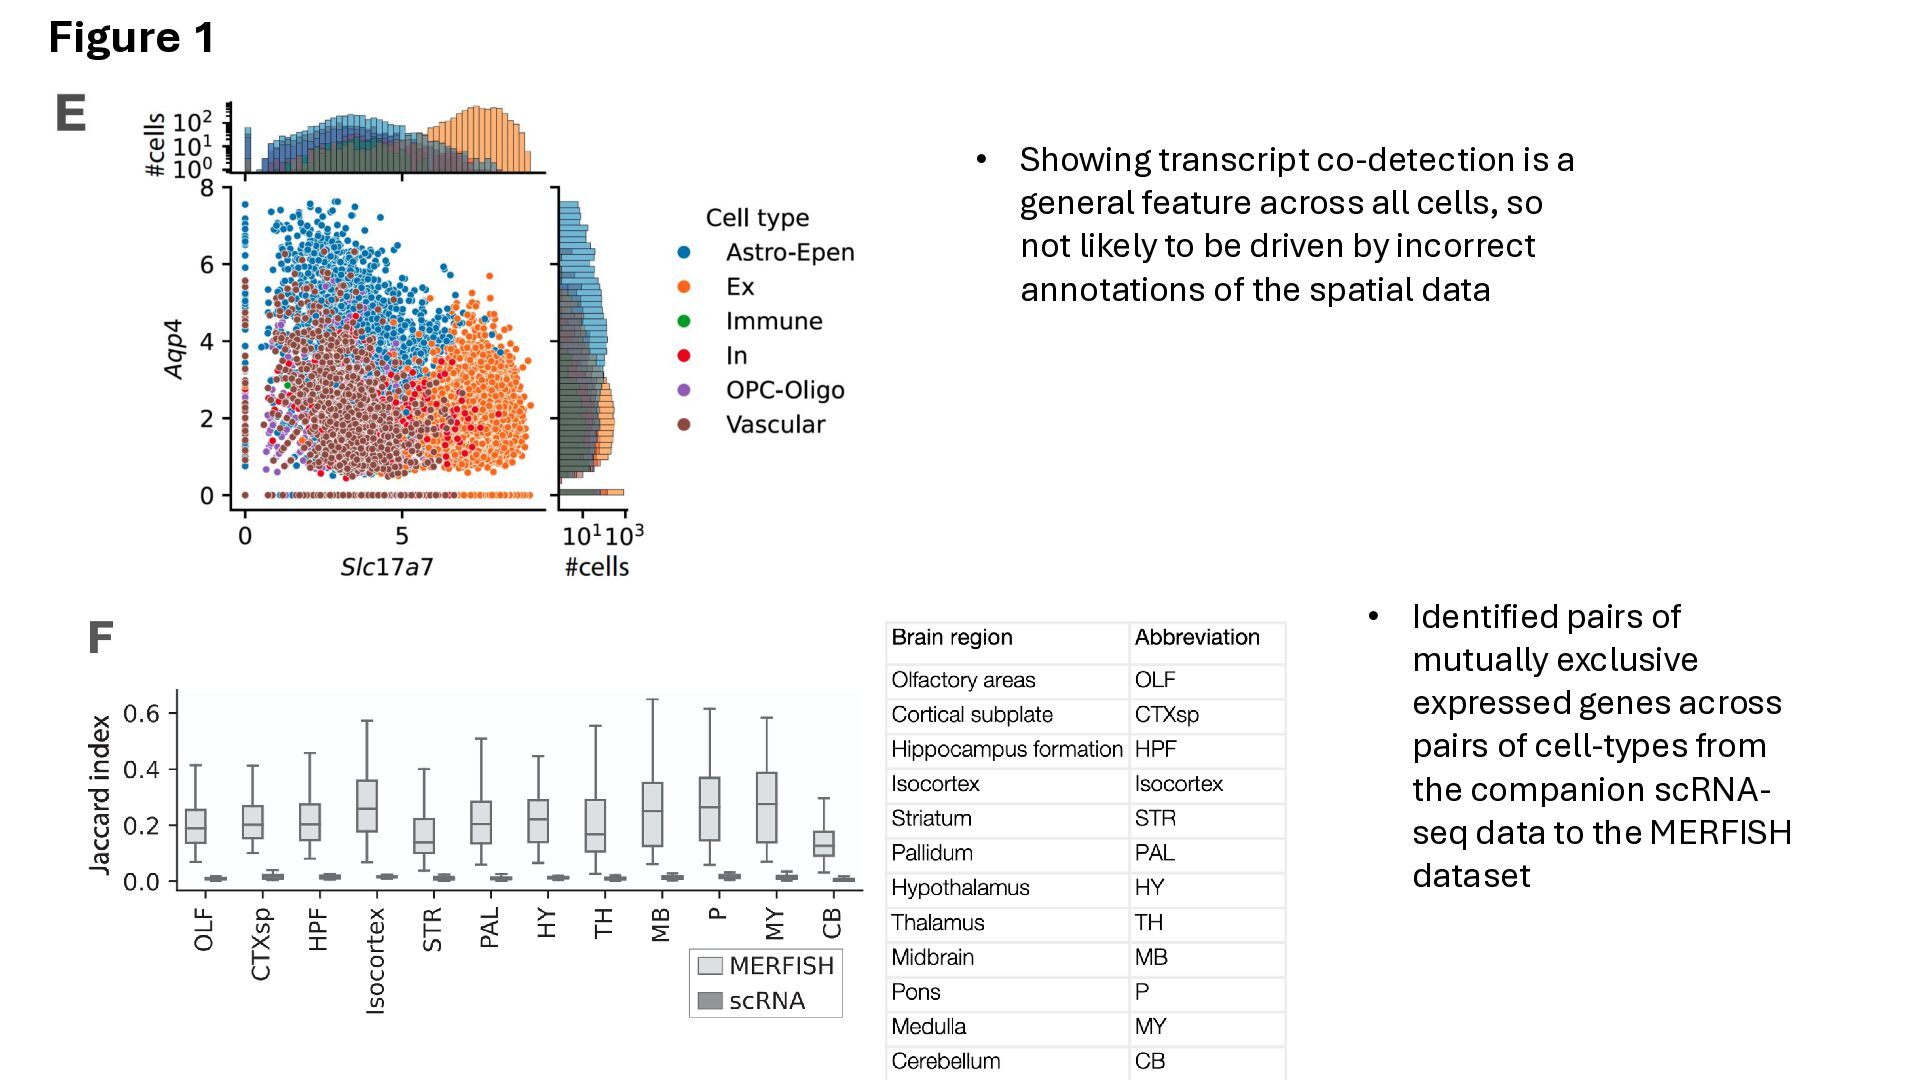
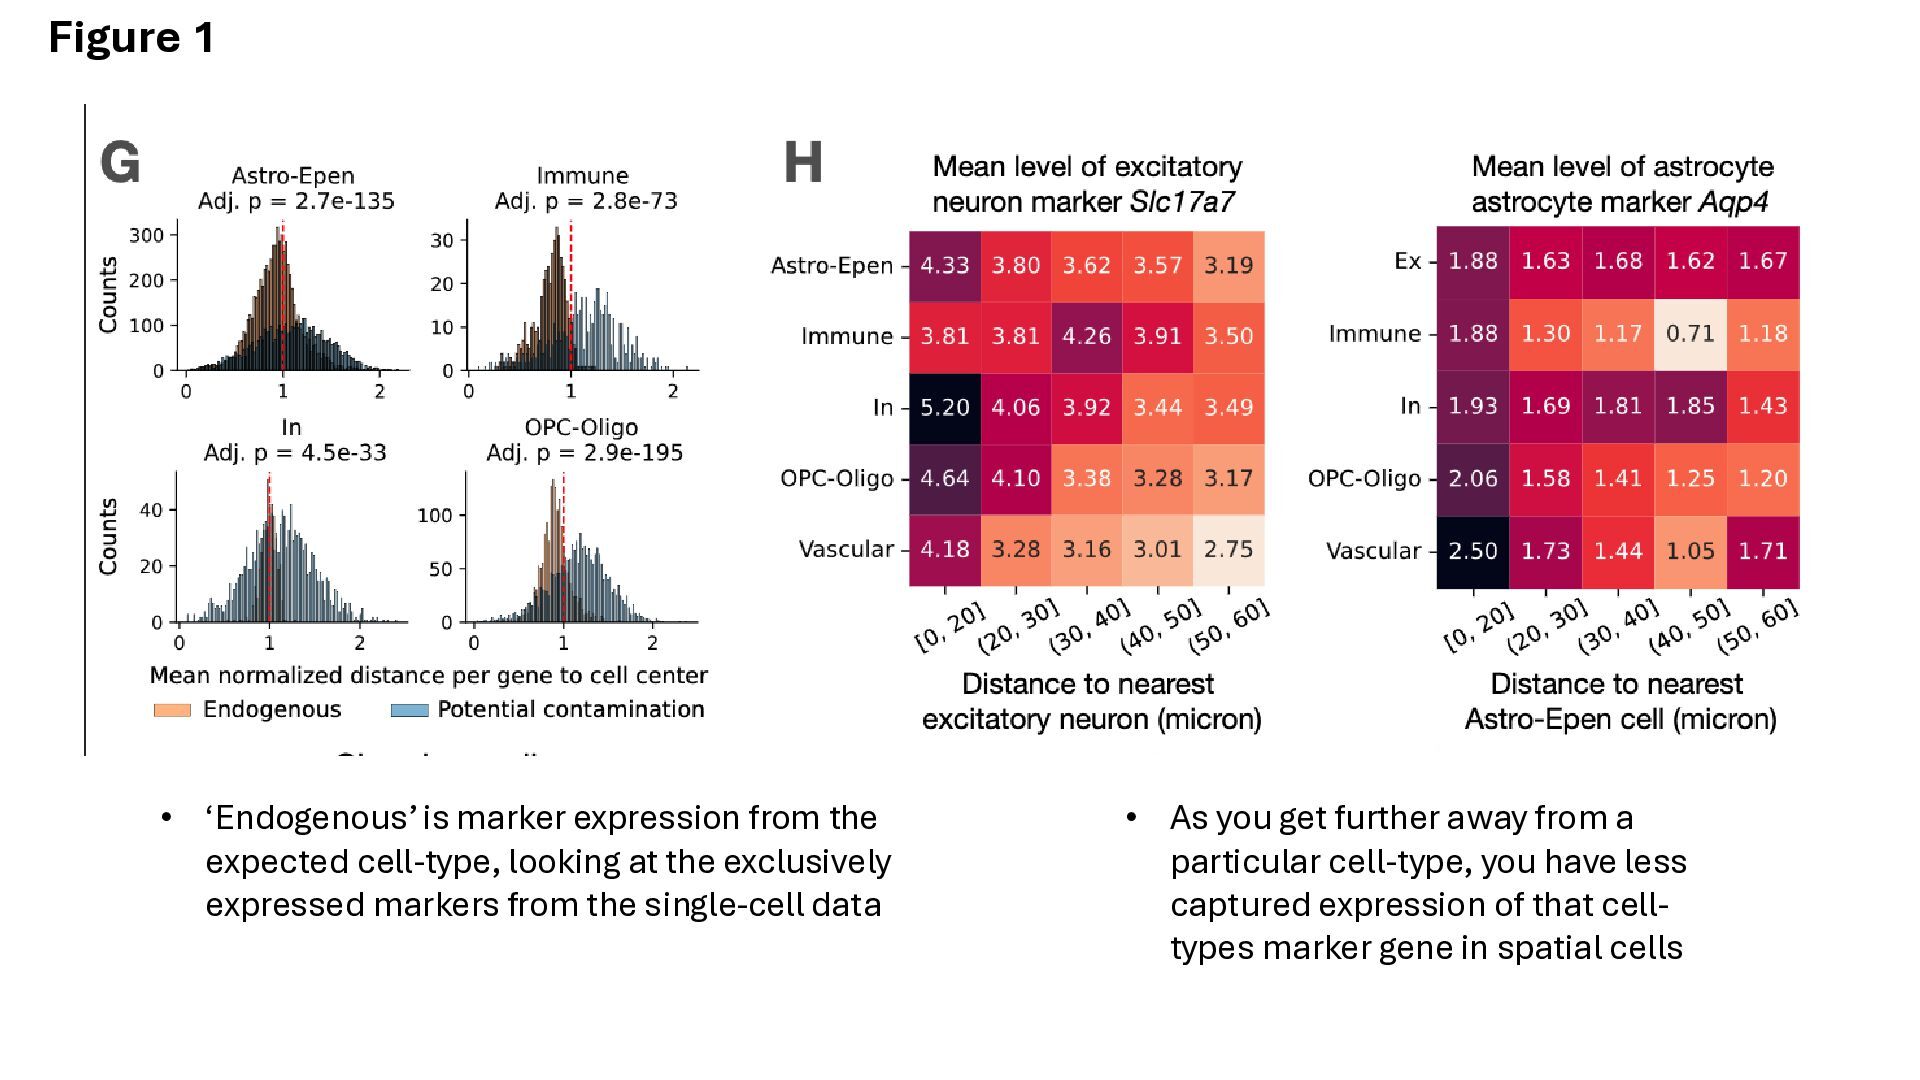
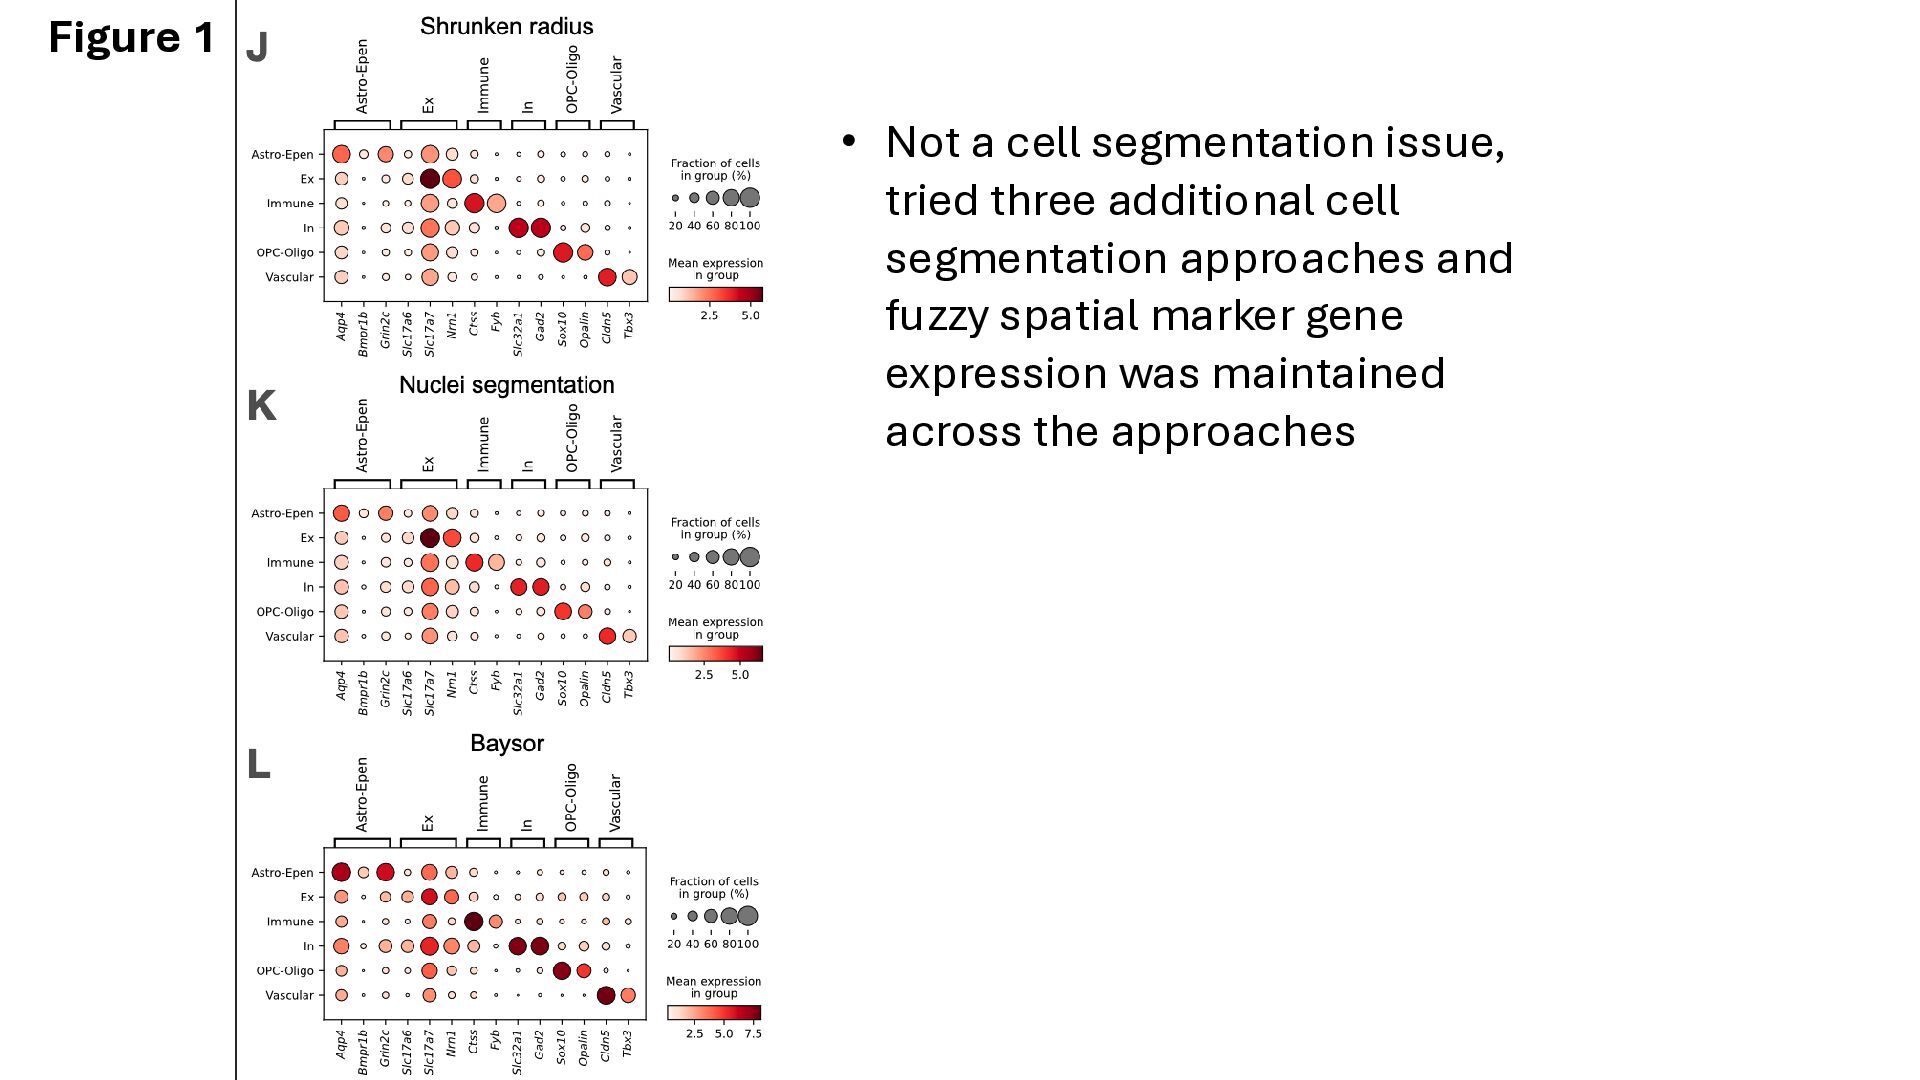
of cell-types from the companion scRNA- seq data to the MERFISH dataset • Showing transcript co-detection is a general feature across all cells, so not likely to be driven by incorrect annotations of the spatial data Figure 1
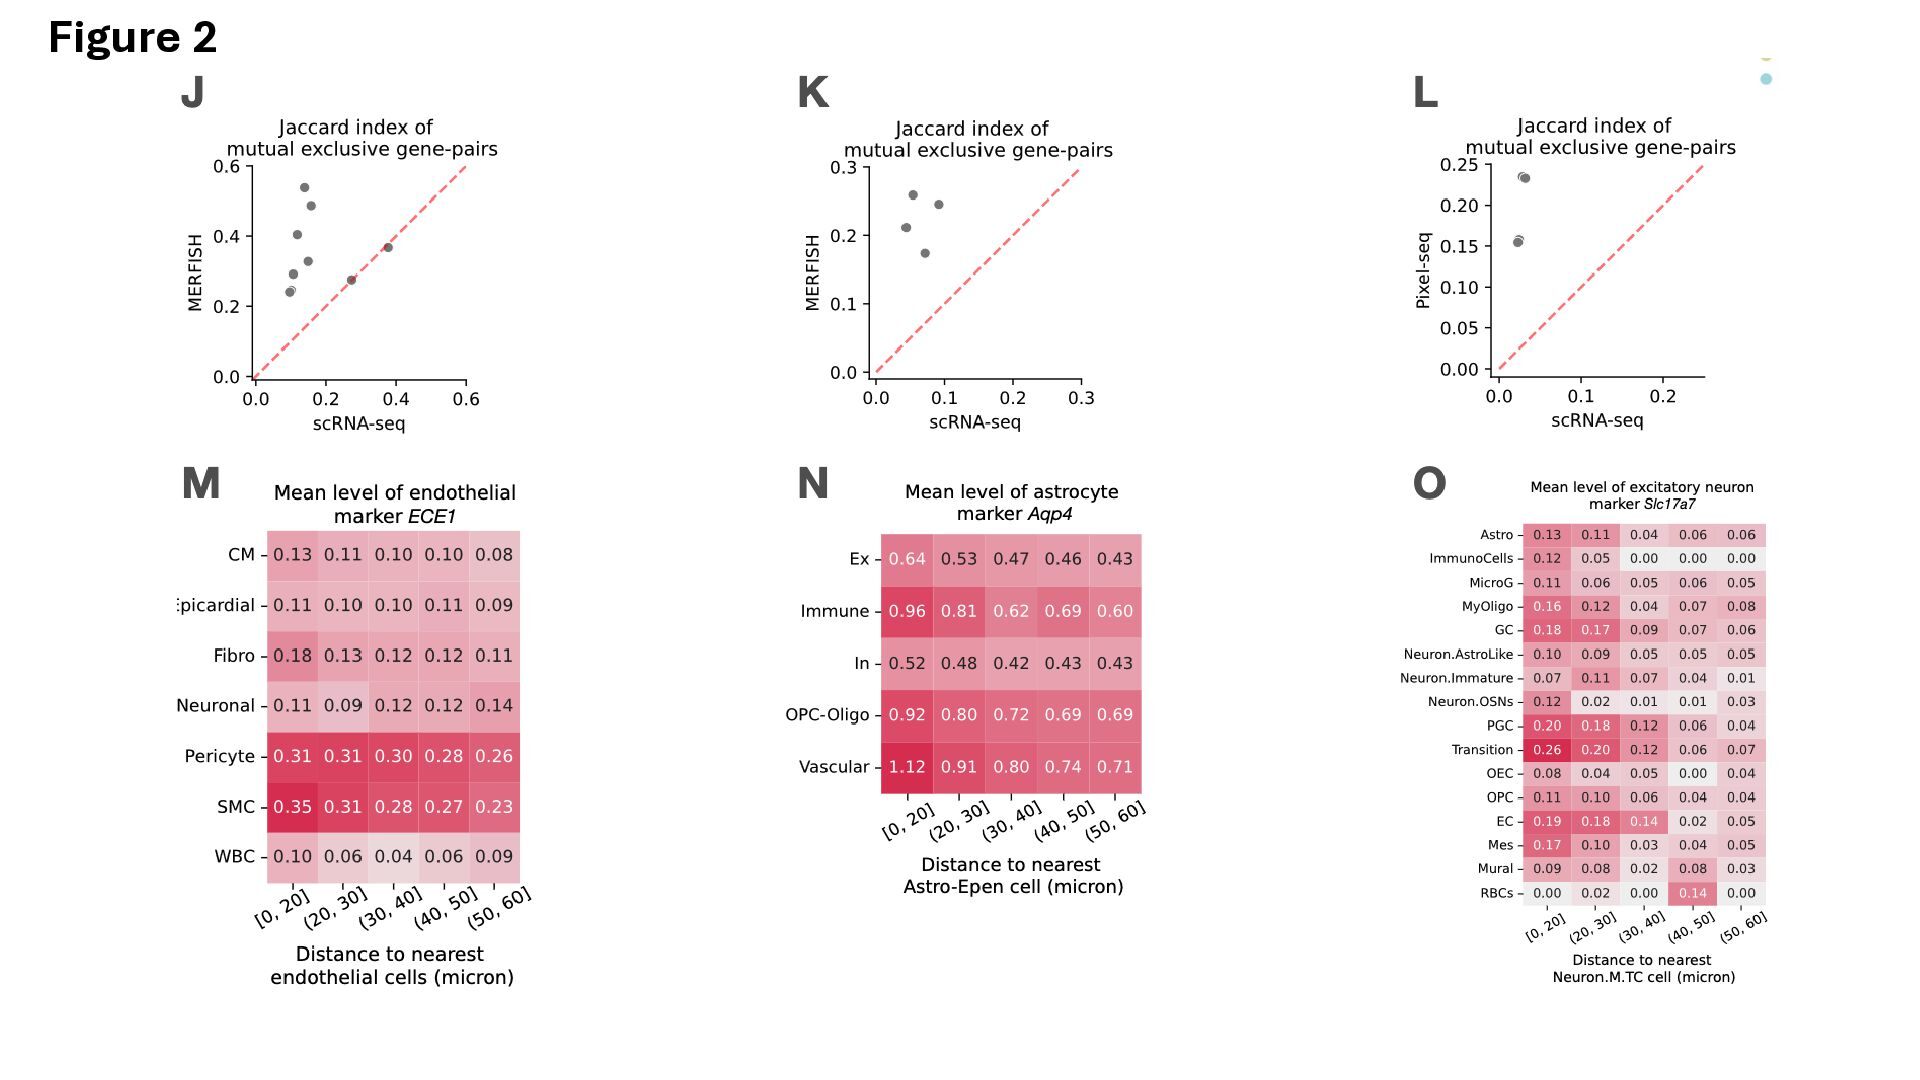
particular cell-type, you have less captured expression of that cell- types marker gene in spatial cells • ‘Endogenous’ is marker expression from the expected cell-type, looking at the exclusively expressed markers from the single-cell data
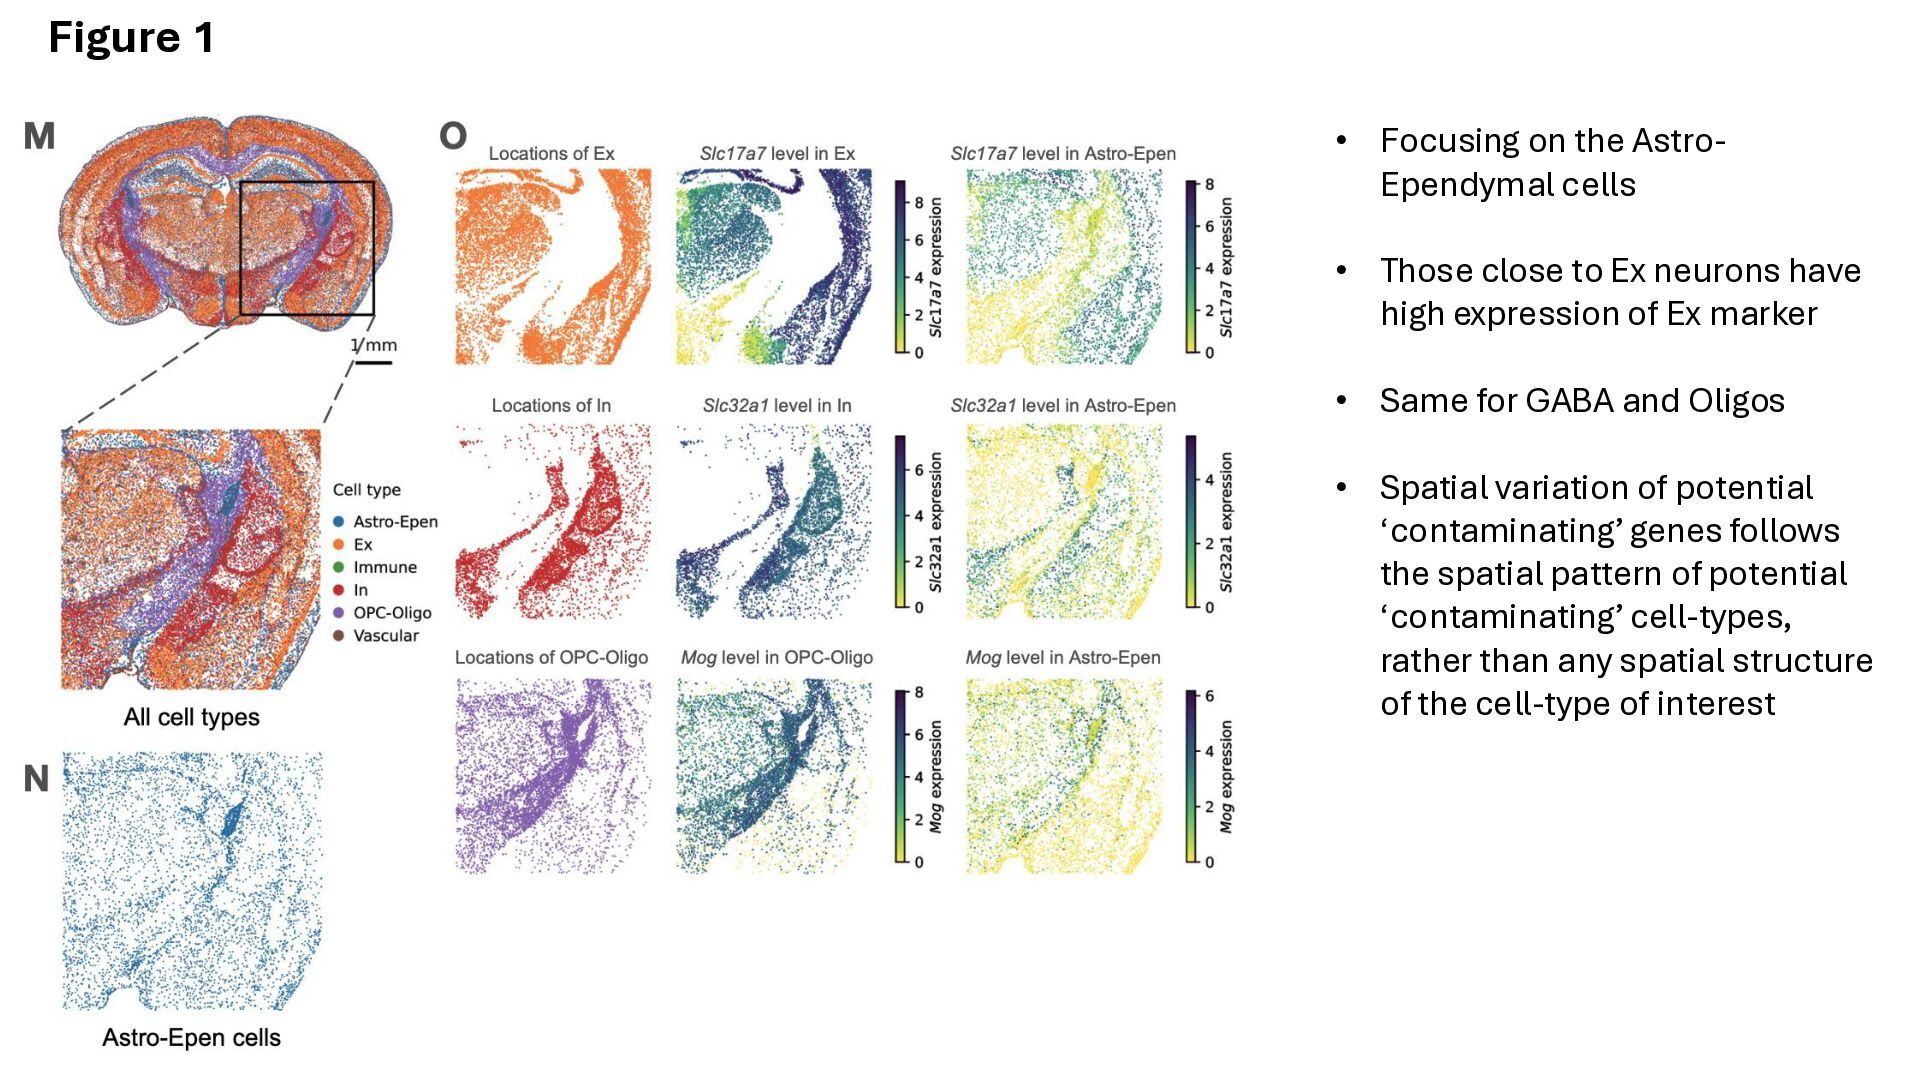
to Ex neurons have high expression of Ex marker • Same for GABA and Oligos • Spatial variation of potential ‘contaminating’ genes follows the spatial pattern of potential ‘contaminating’ cell-types, rather than any spatial structure of the cell-type of interest Figure 1
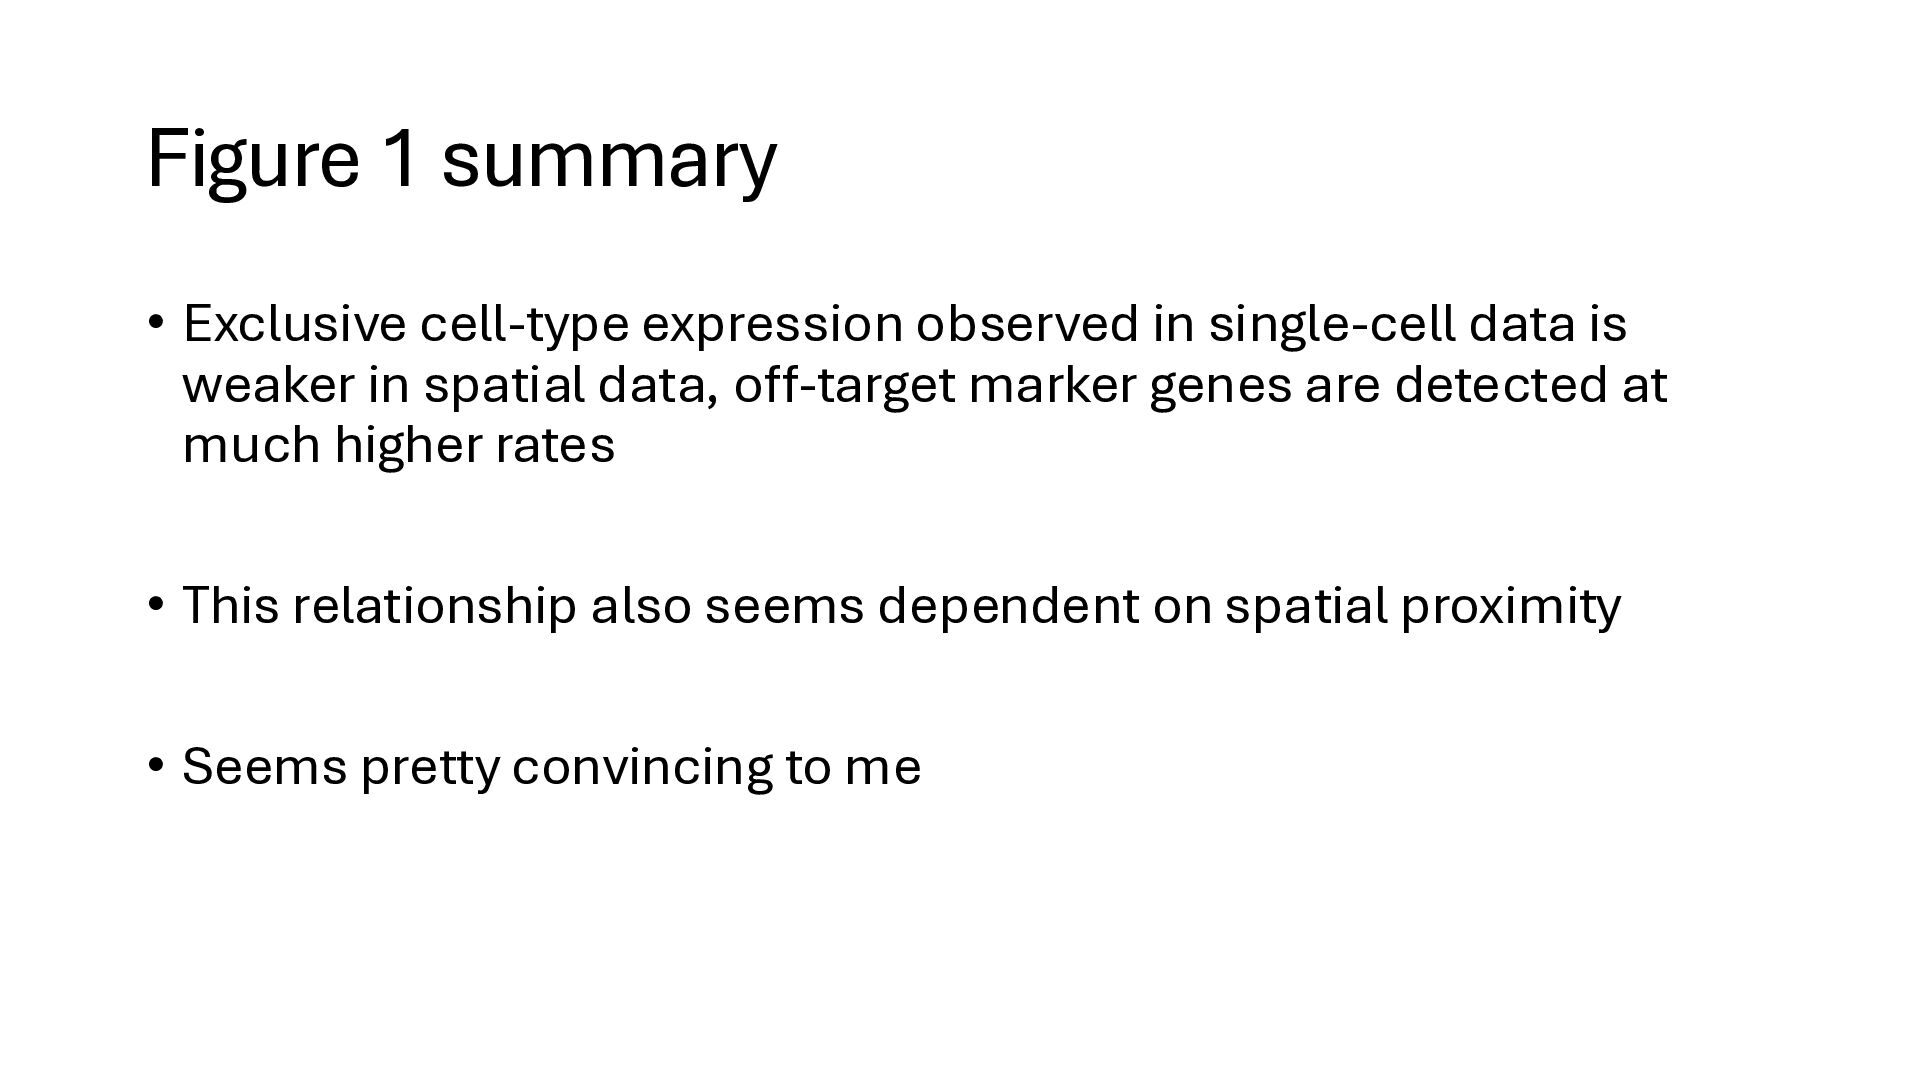
data is weaker in spatial data, off-target marker genes are detected at much higher rates • This relationship also seems dependent on spatial proximity • Seems pretty convincing to me
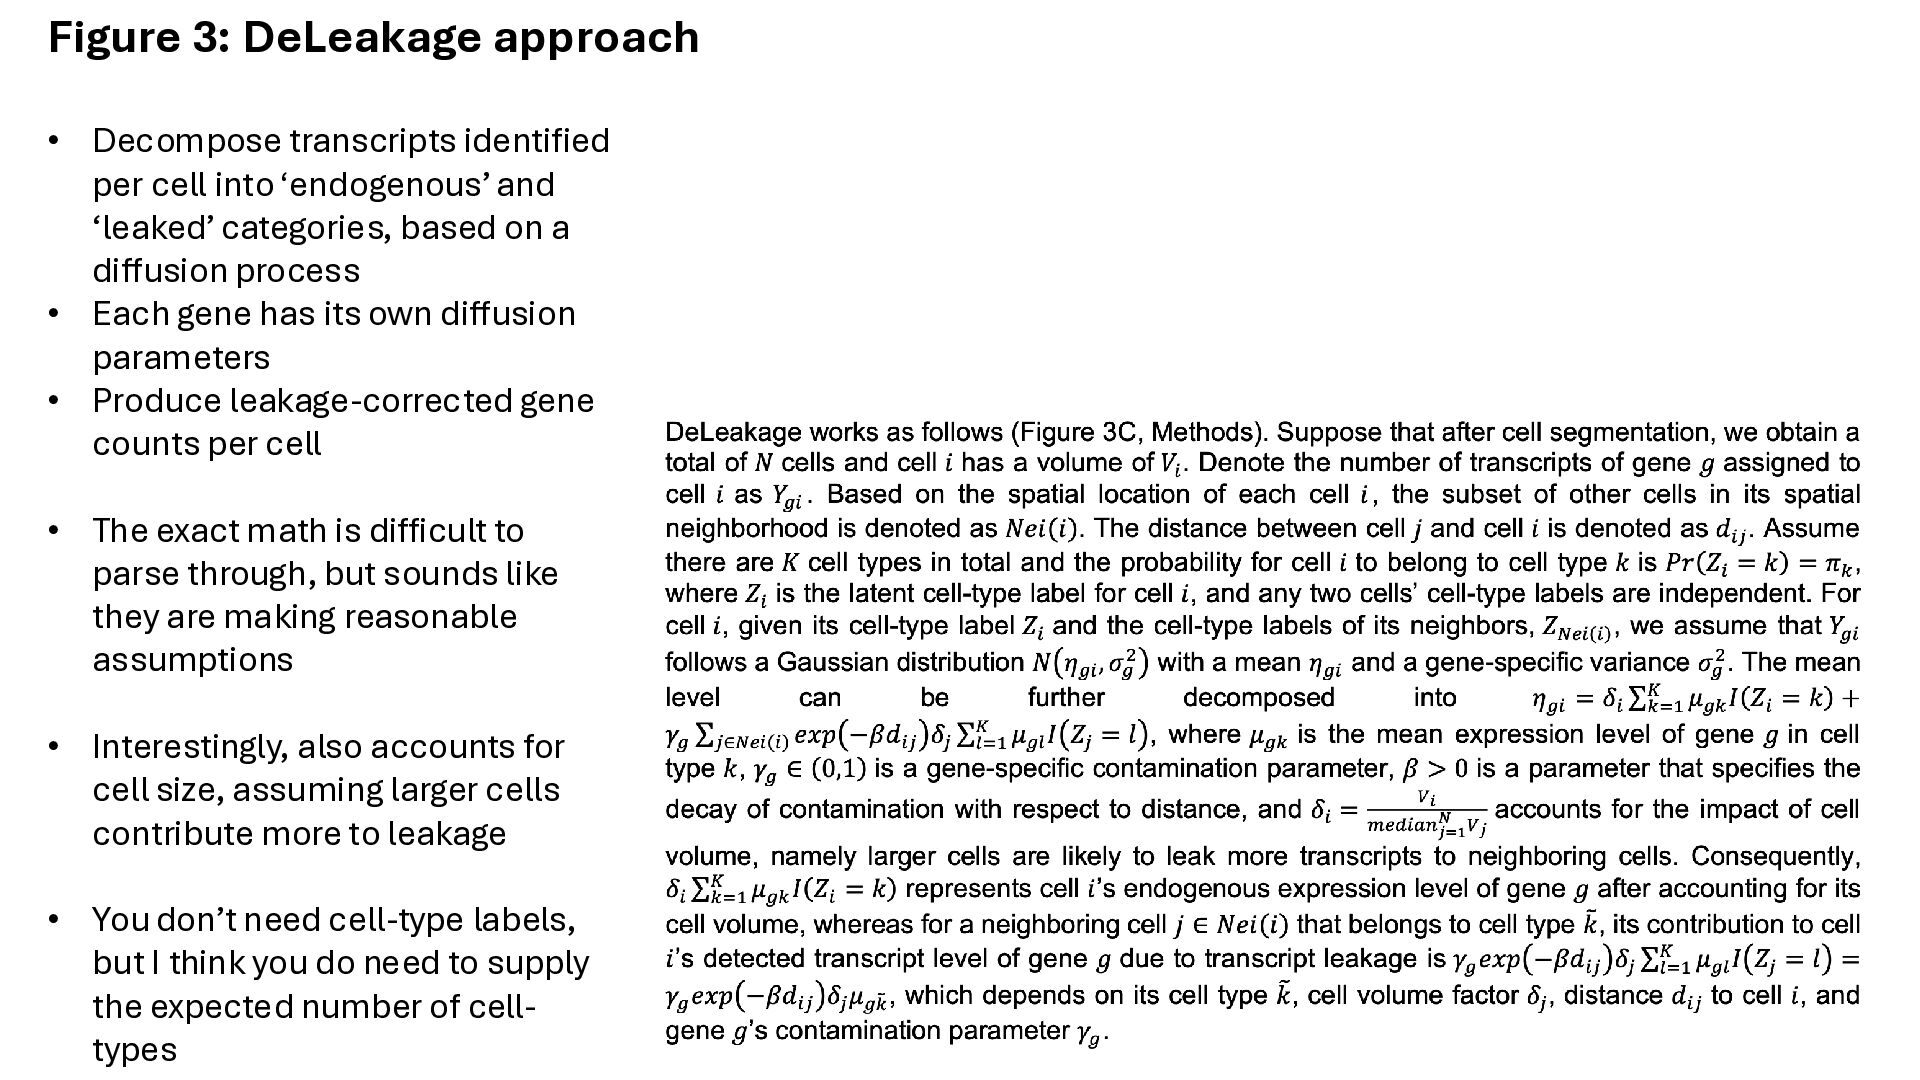
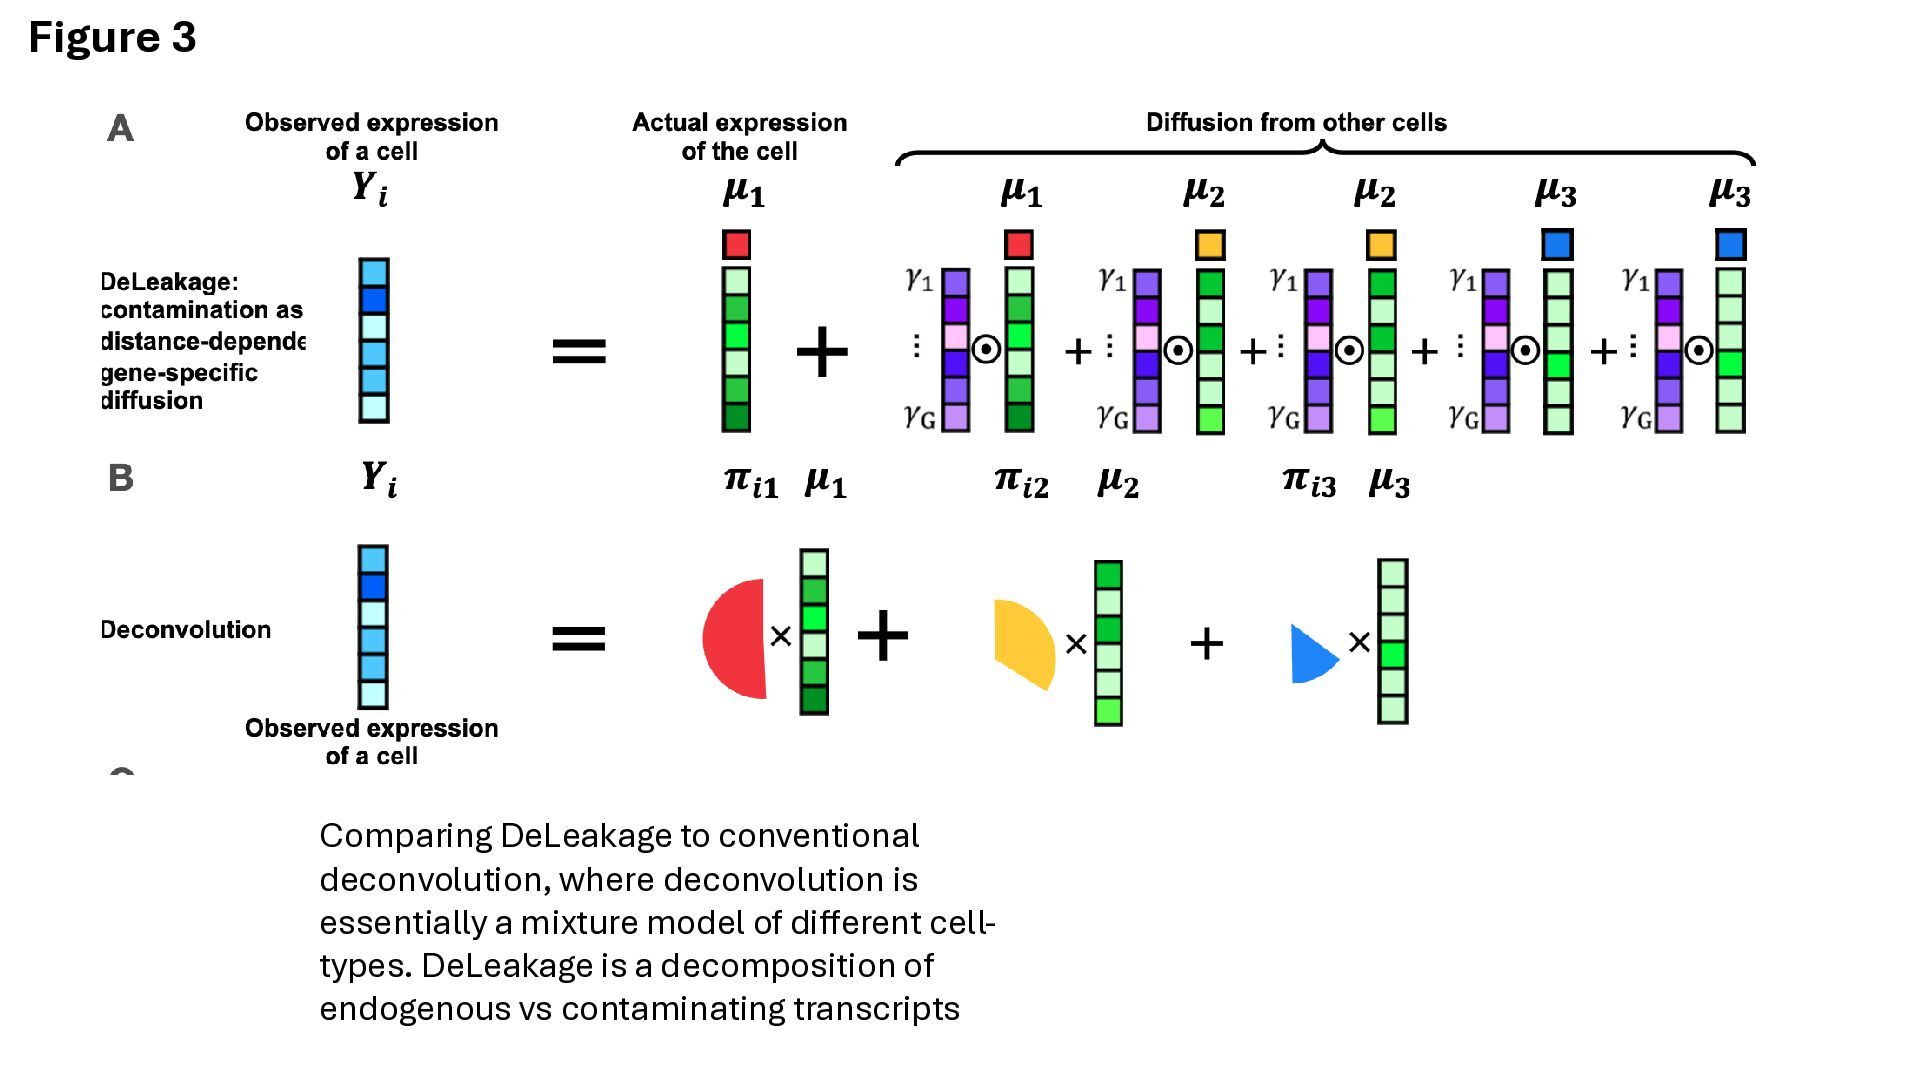
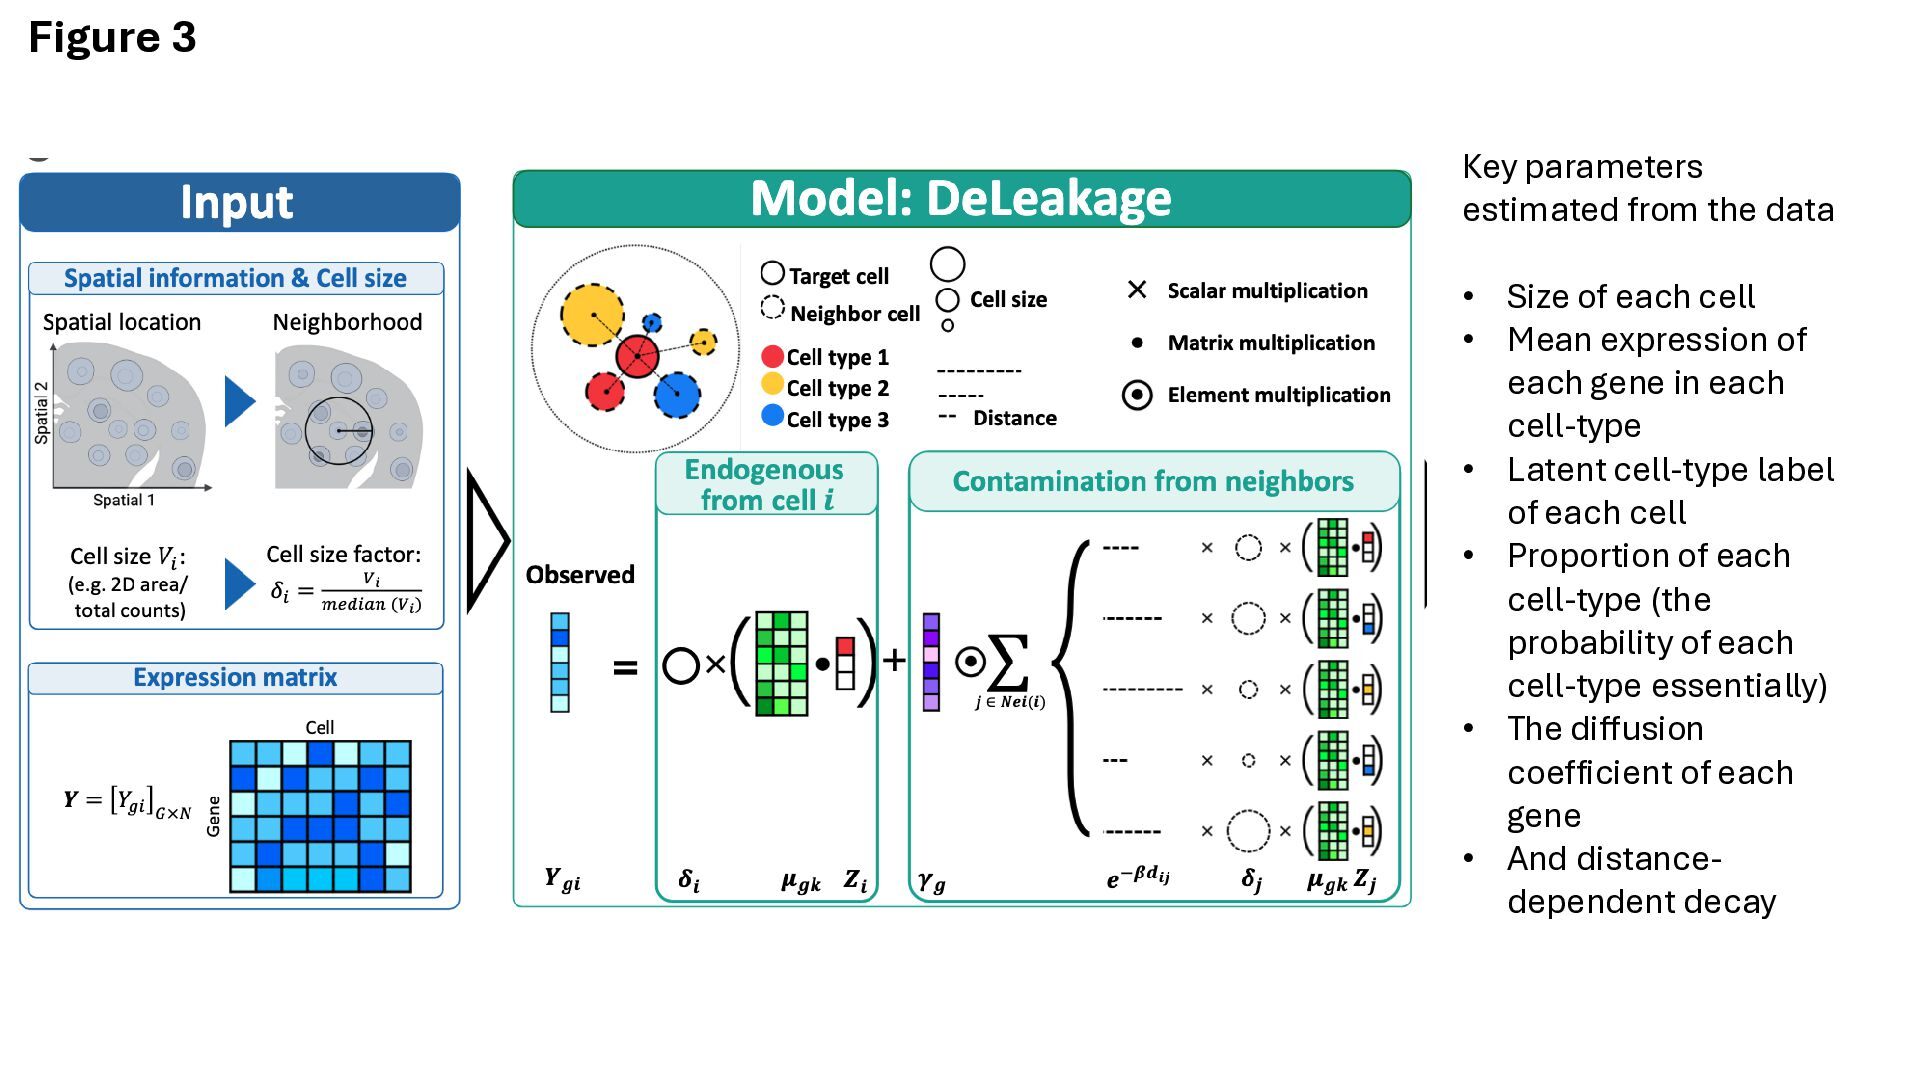
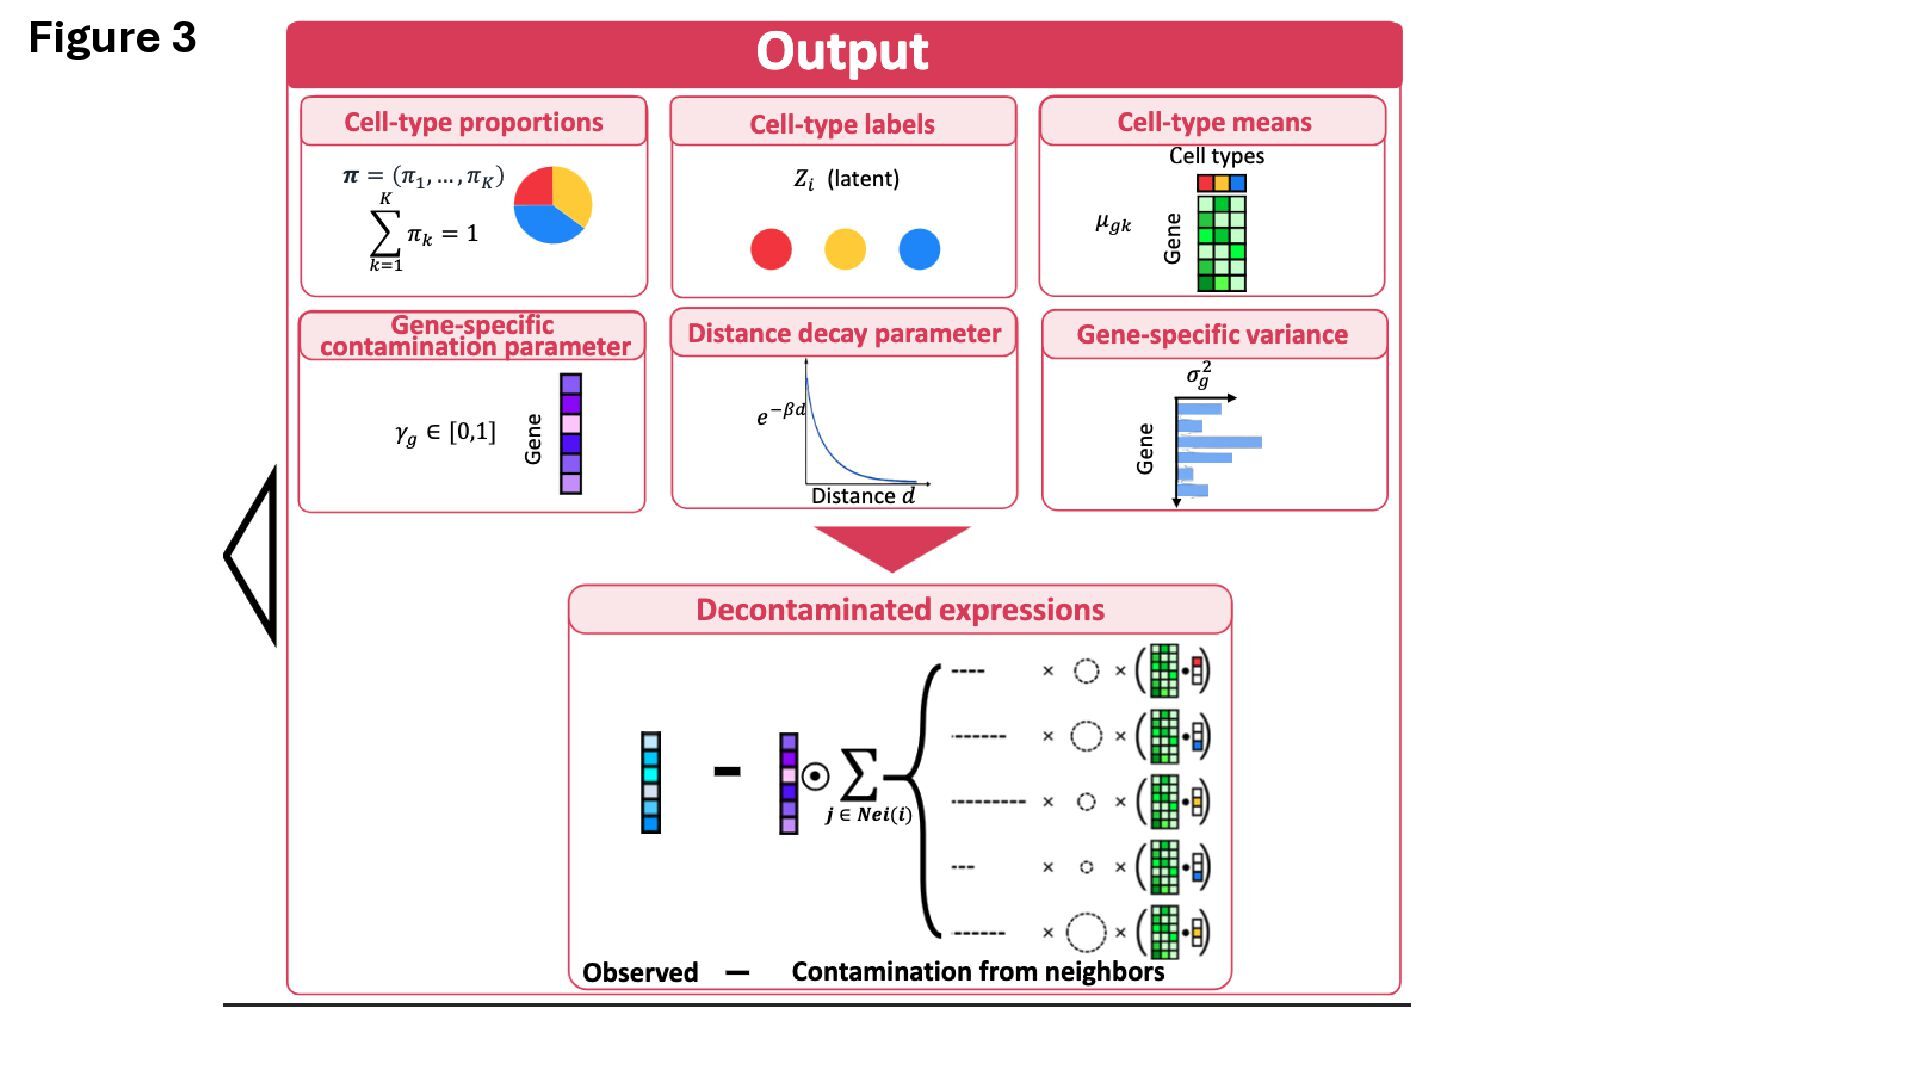
into ‘endogenous’ and ‘leaked’ categories, based on a diffusion process • Each gene has its own diffusion parameters • Produce leakage-corrected gene counts per cell • The exact math is difficult to parse through, but sounds like they are making reasonable assumptions • Interestingly, also accounts for cell size, assuming larger cells contribute more to leakage • You don’t need cell-type labels, but I think you do need to supply the expected number of cell- types
of each cell • Mean expression of each gene in each cell-type • Latent cell-type label of each cell • Proportion of each cell-type (the probability of each cell-type essentially) • The diffusion coefficient of each gene • And distance- dependent decay
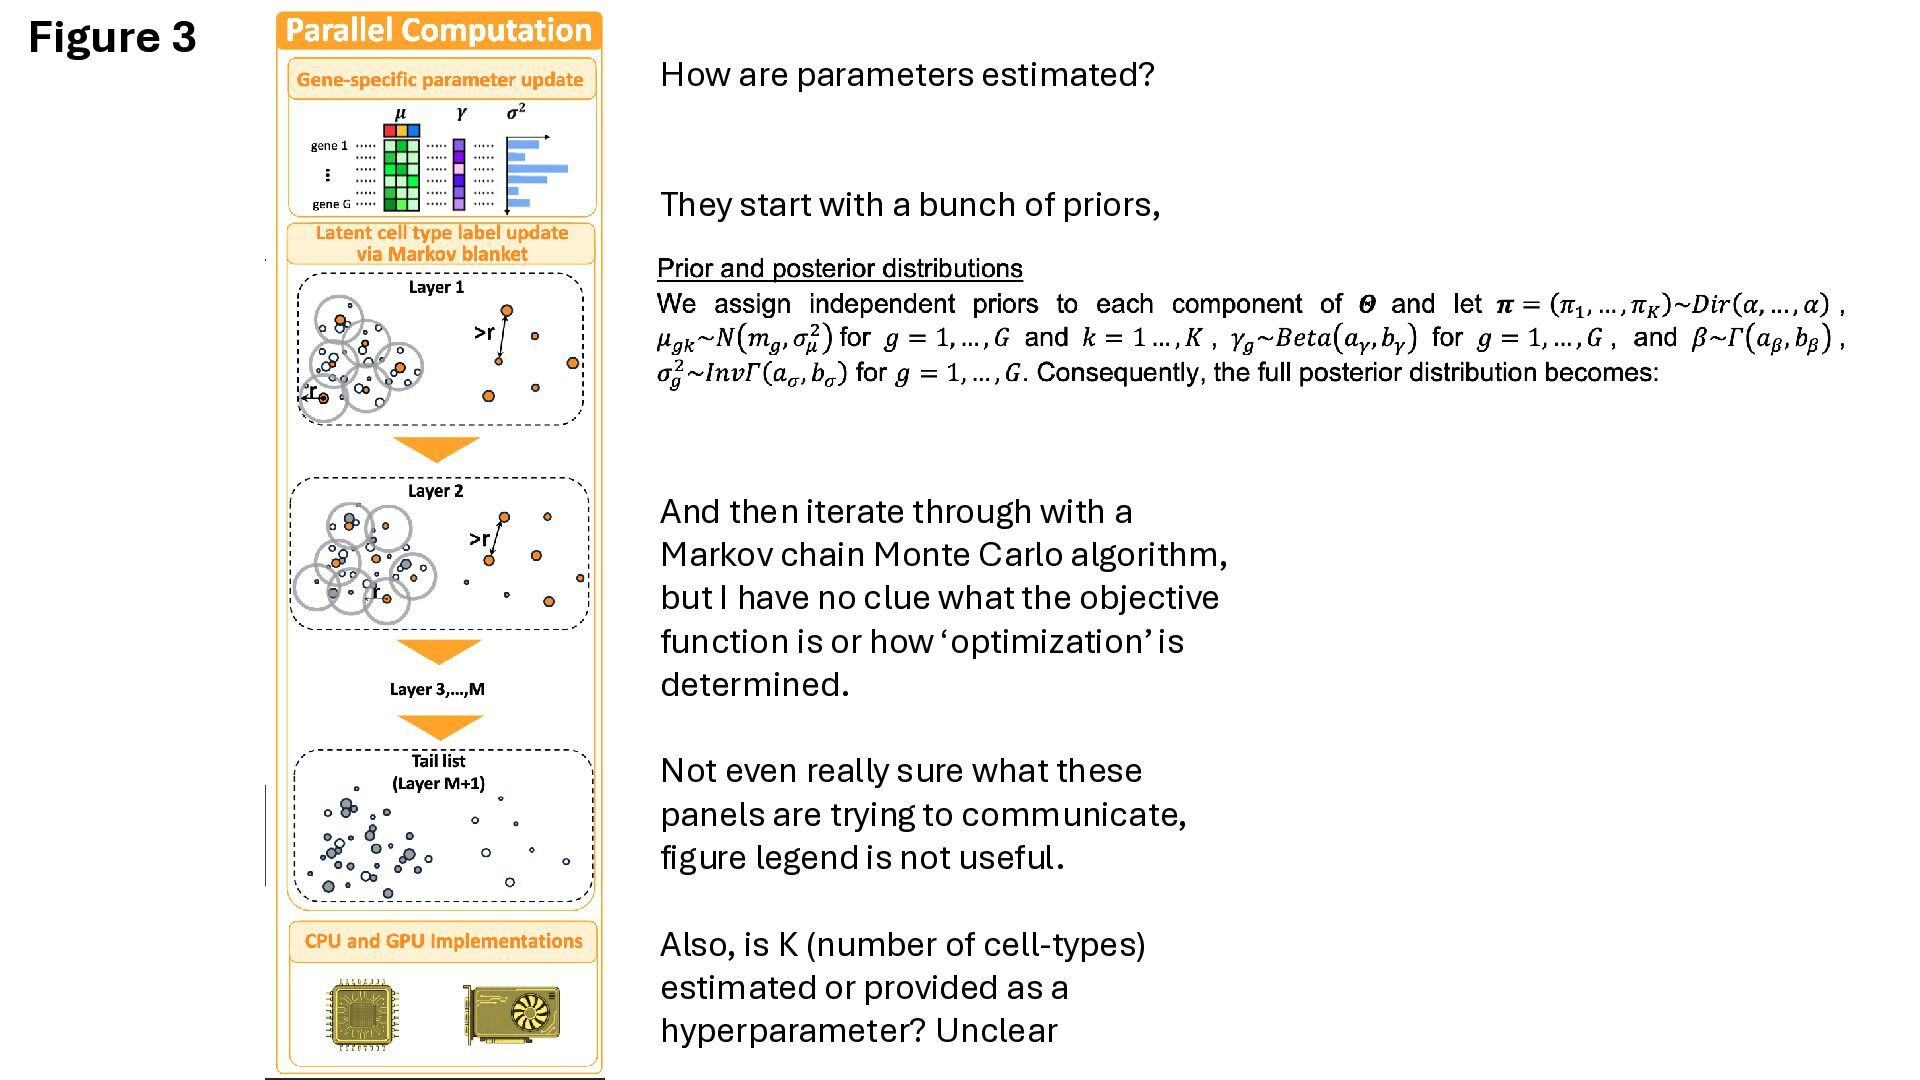
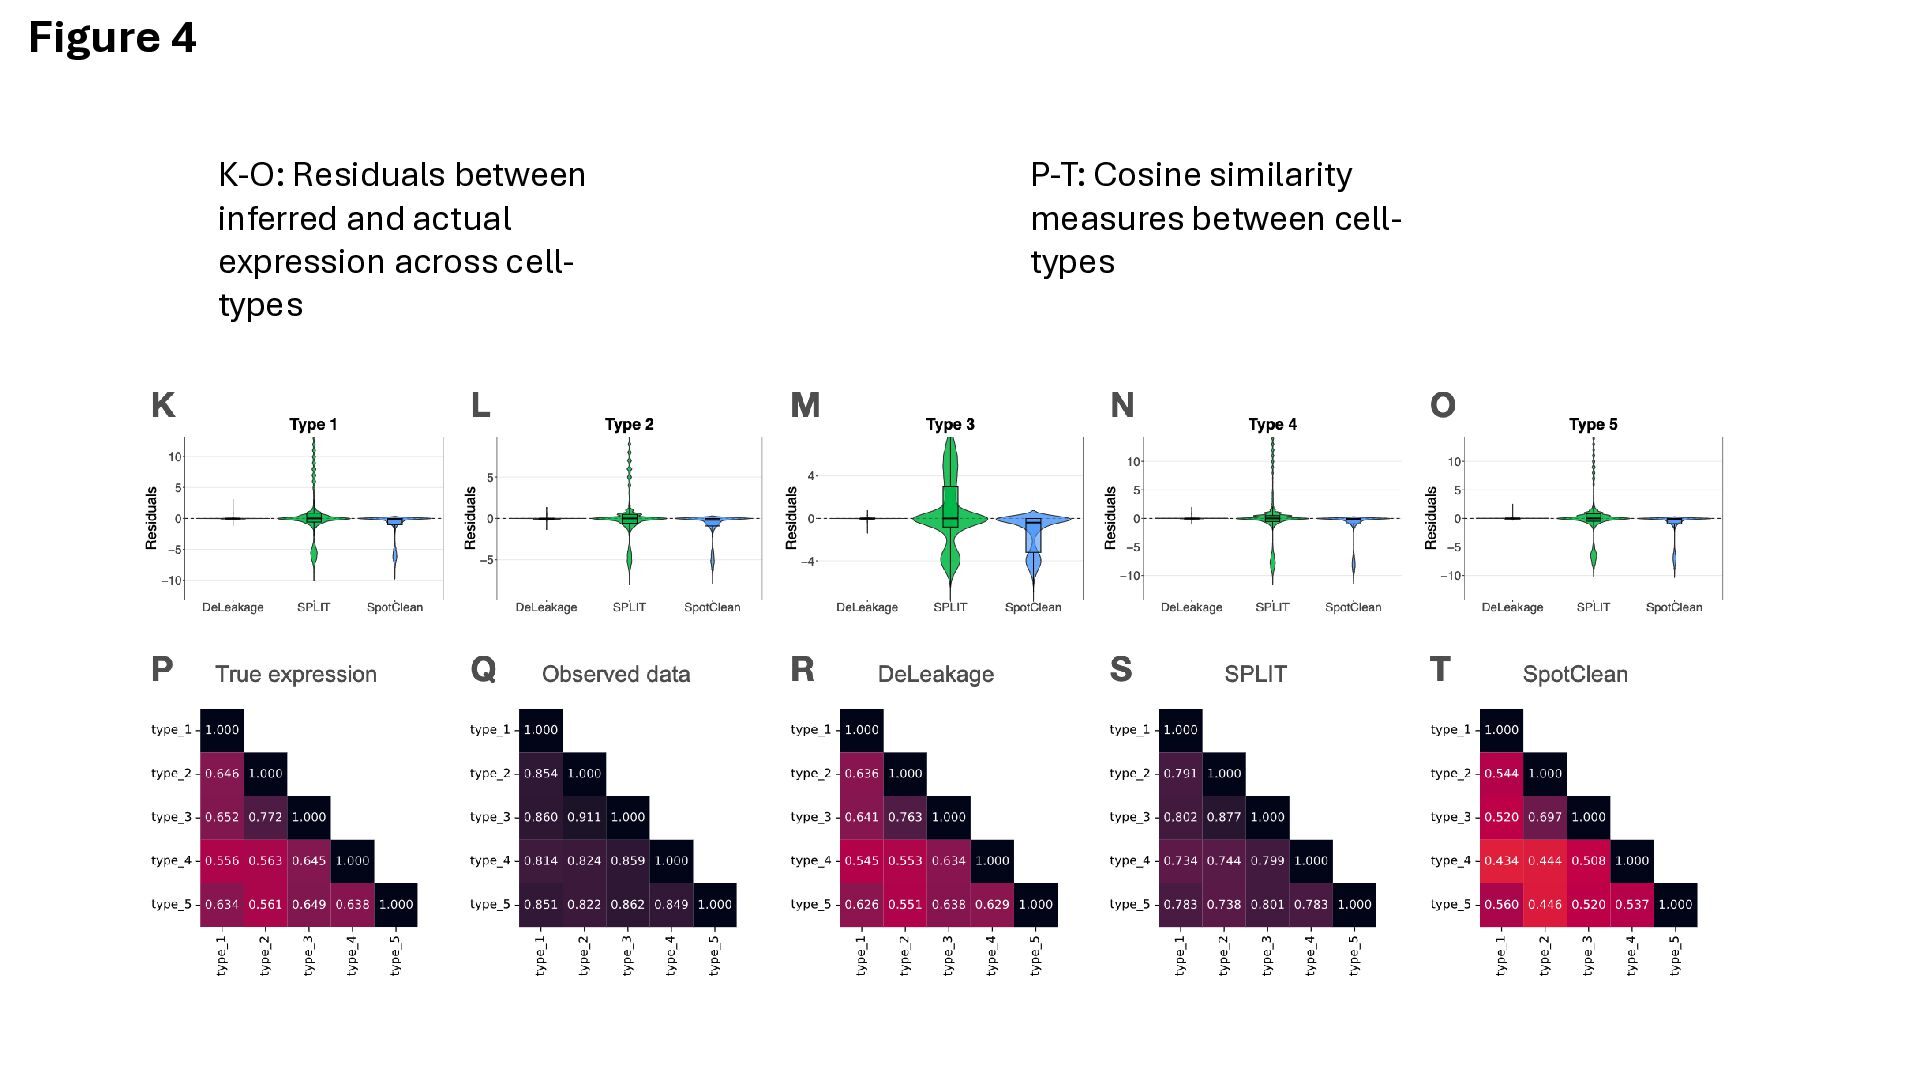
bunch of priors, And then iterate through with a Markov chain Monte Carlo algorithm, but I have no clue what the objective function is or how ‘optimization’ is determined. Not even really sure what these panels are trying to communicate, figure legend is not useful. Also, is K (number of cell-types) estimated or provided as a hyperparameter? Unclear
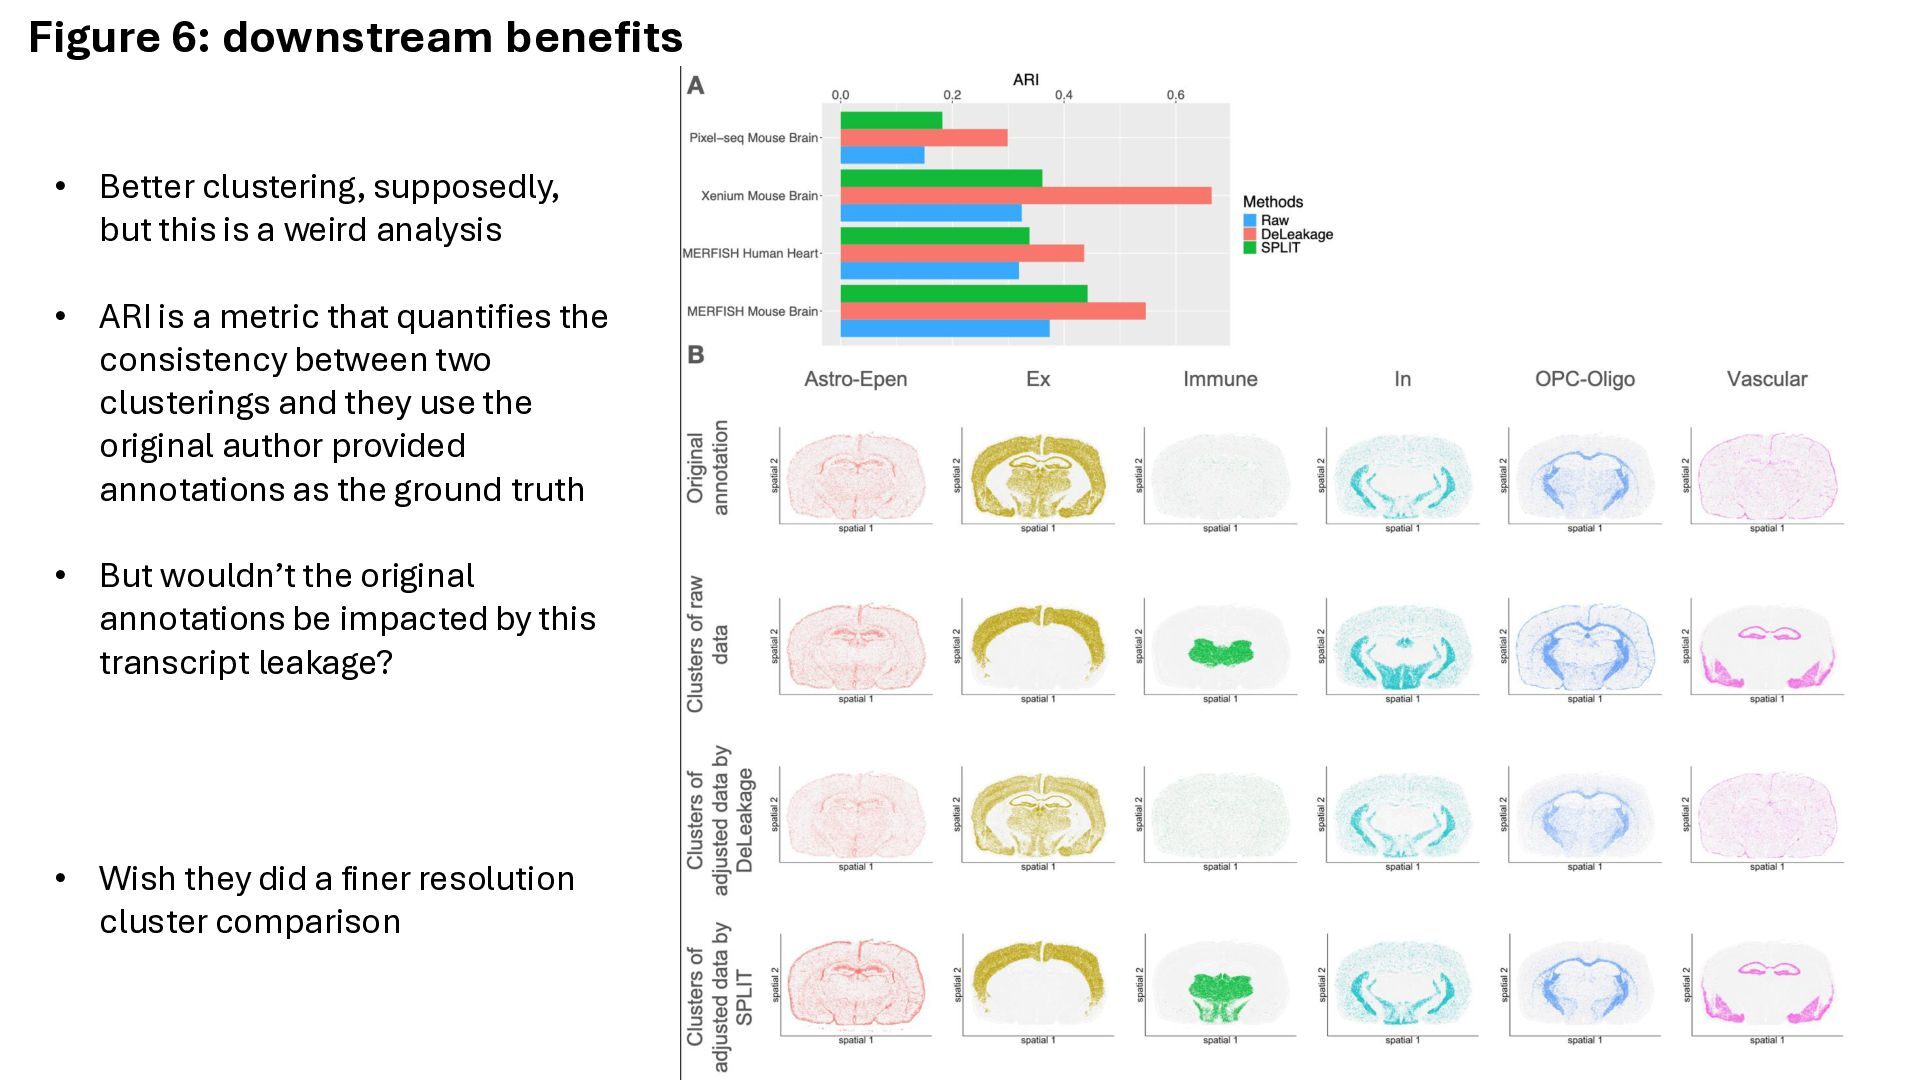
is a weird analysis • ARI is a metric that quantifies the consistency between two clusterings and they use the original author provided annotations as the ground truth • But wouldn’t the original annotations be impacted by this transcript leakage? • Wish they did a finer resolution cluster comparison
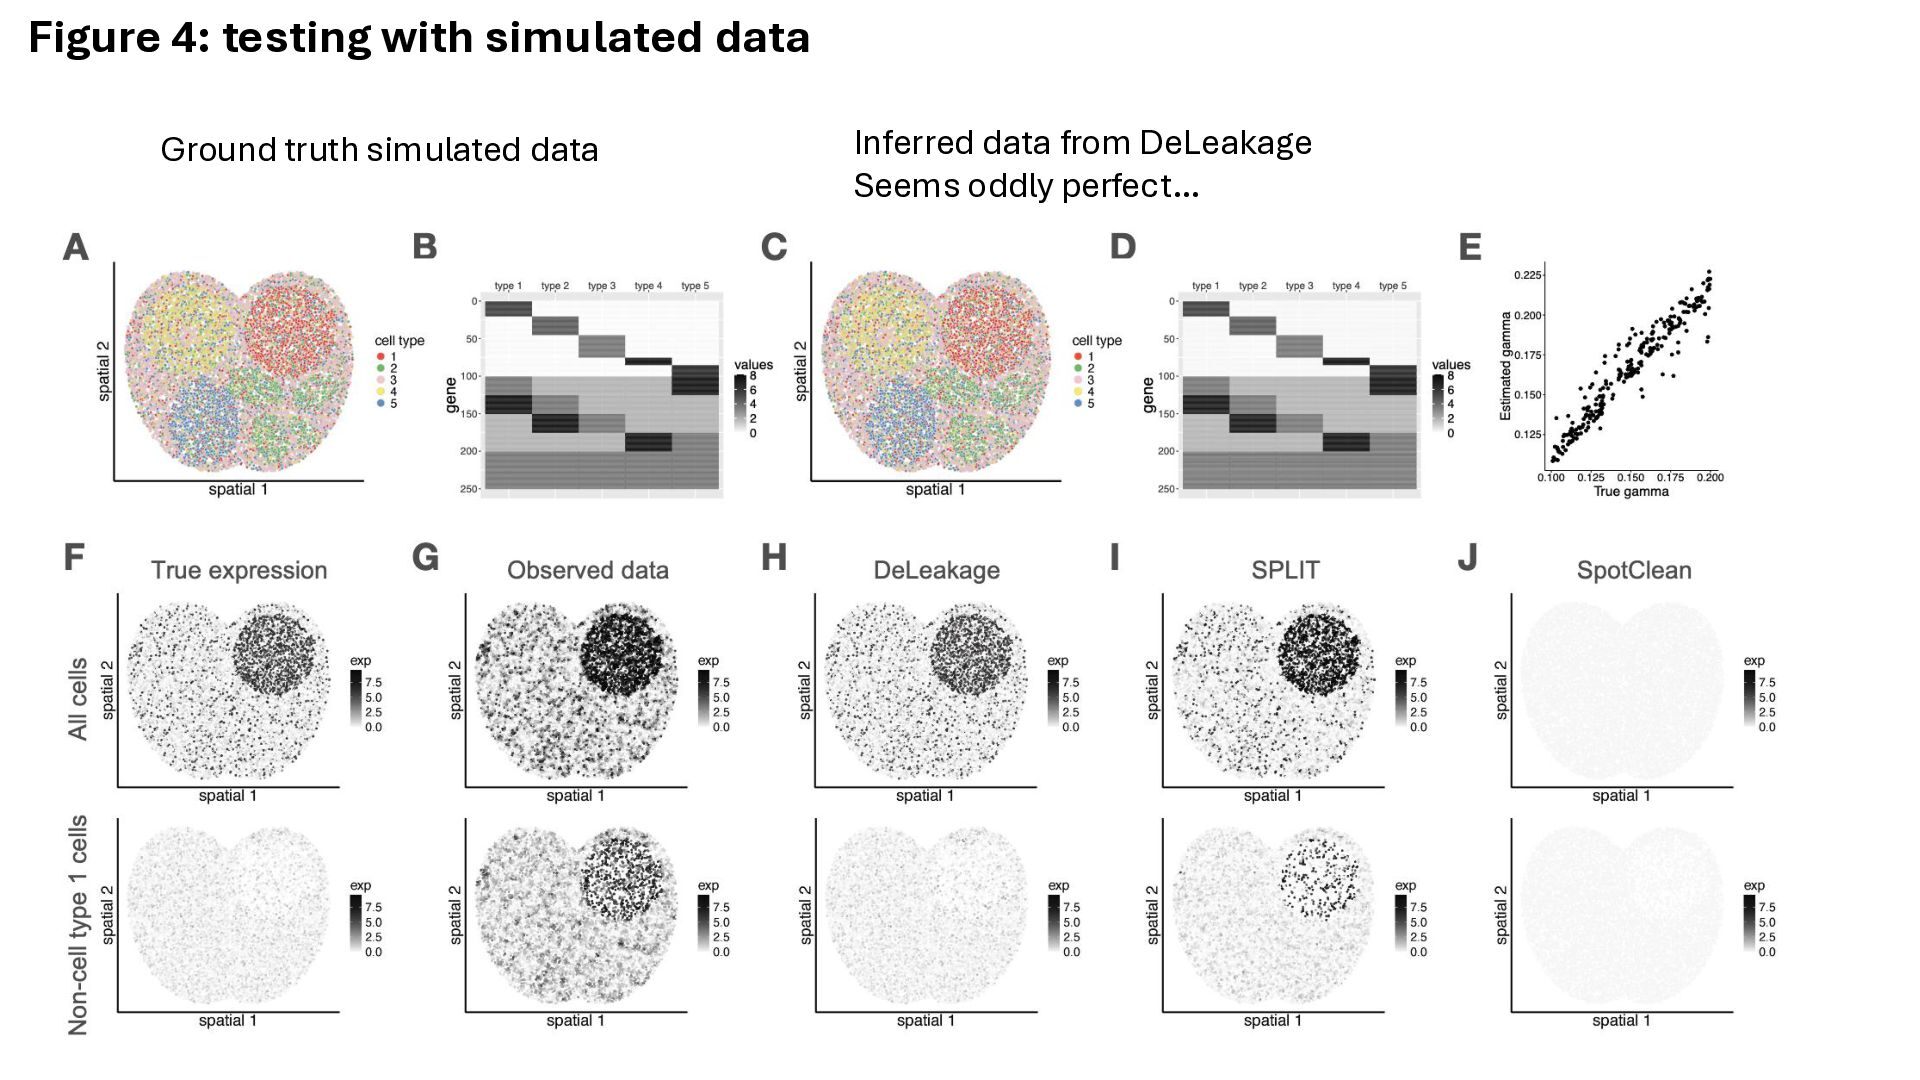
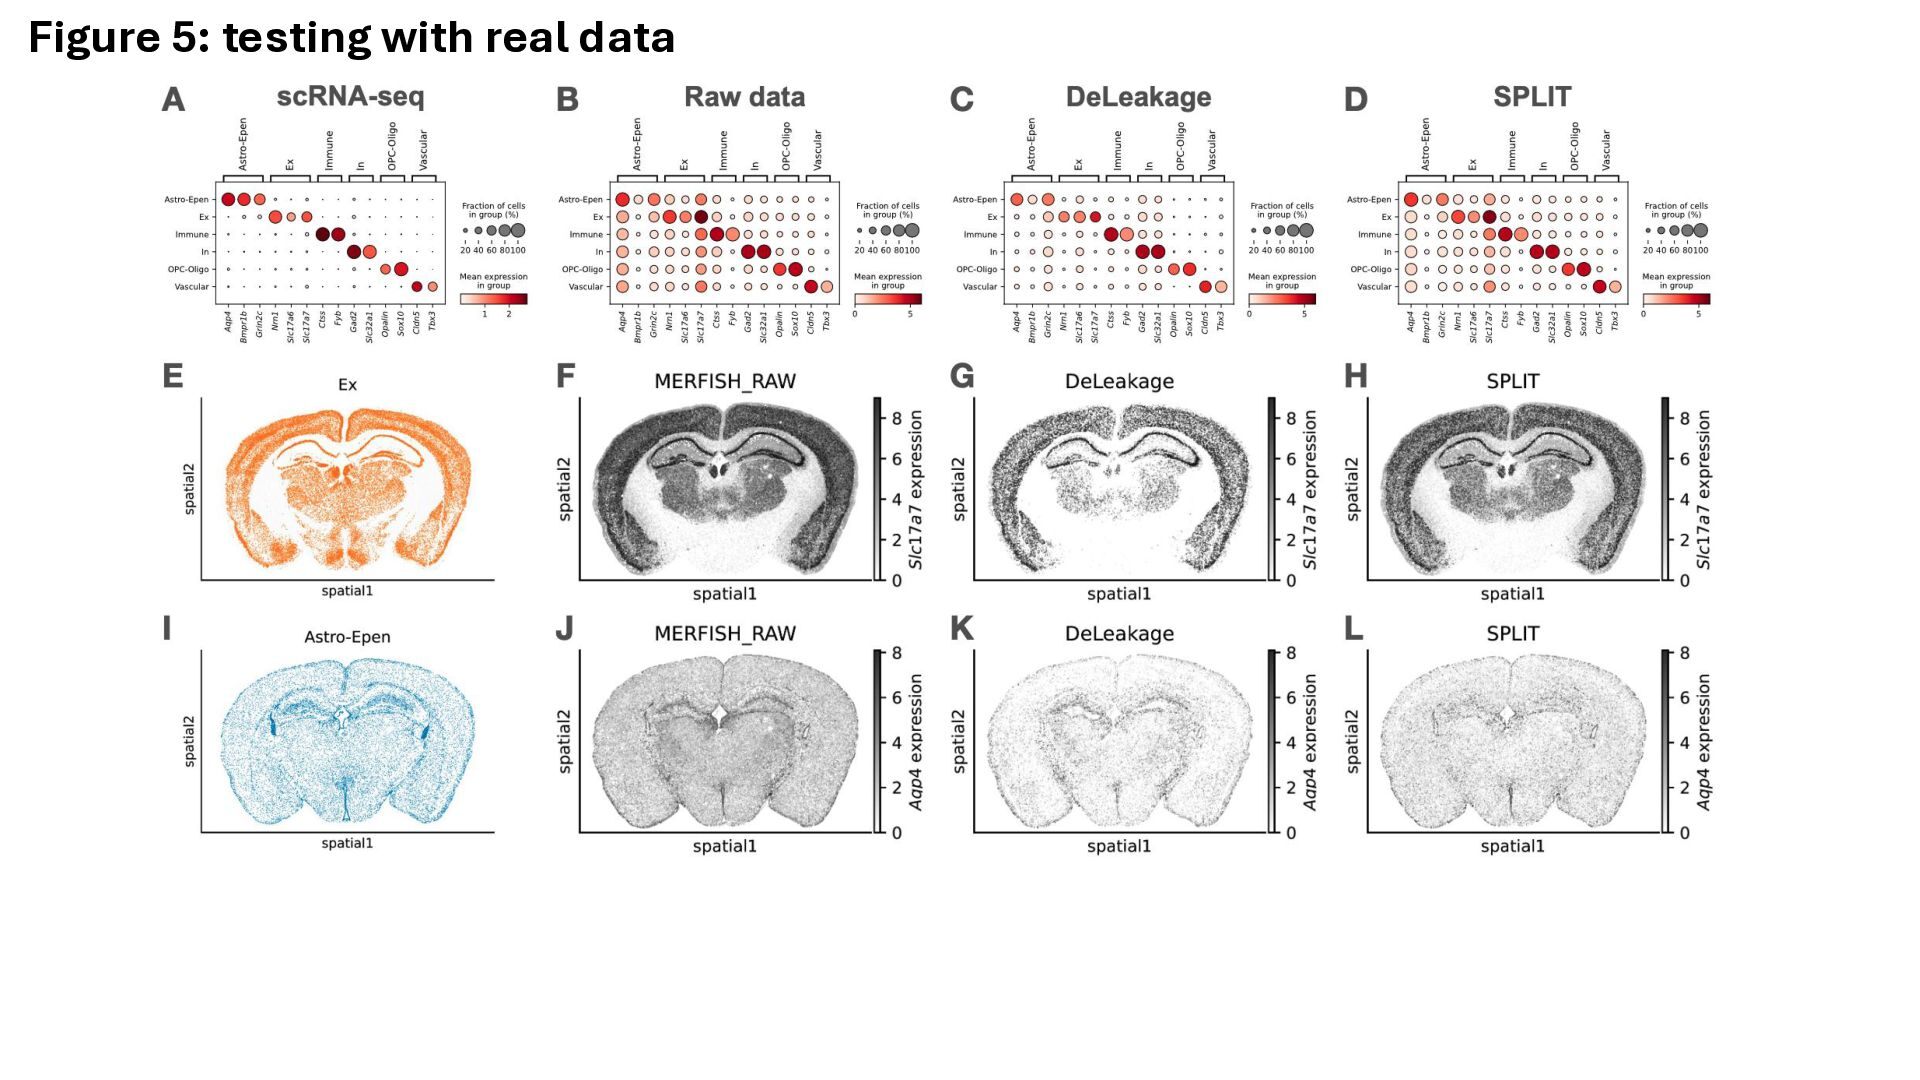
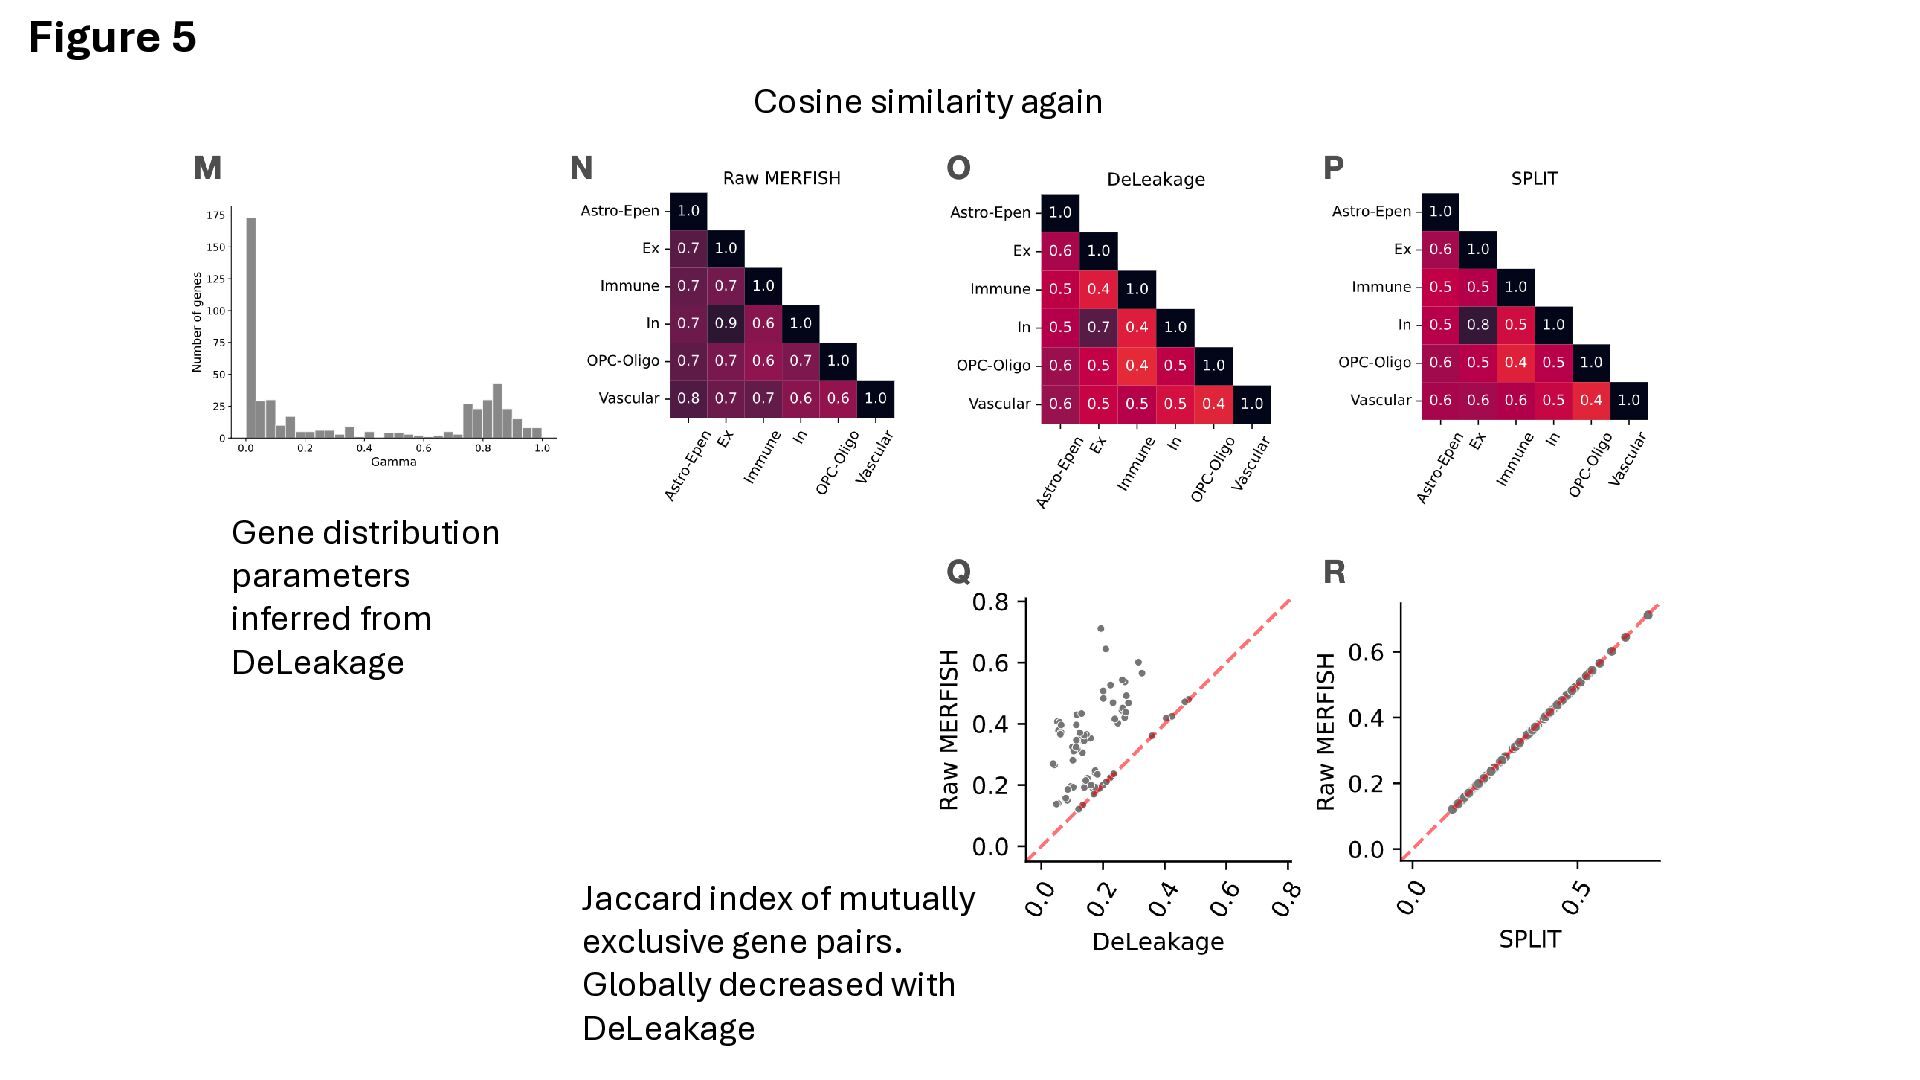
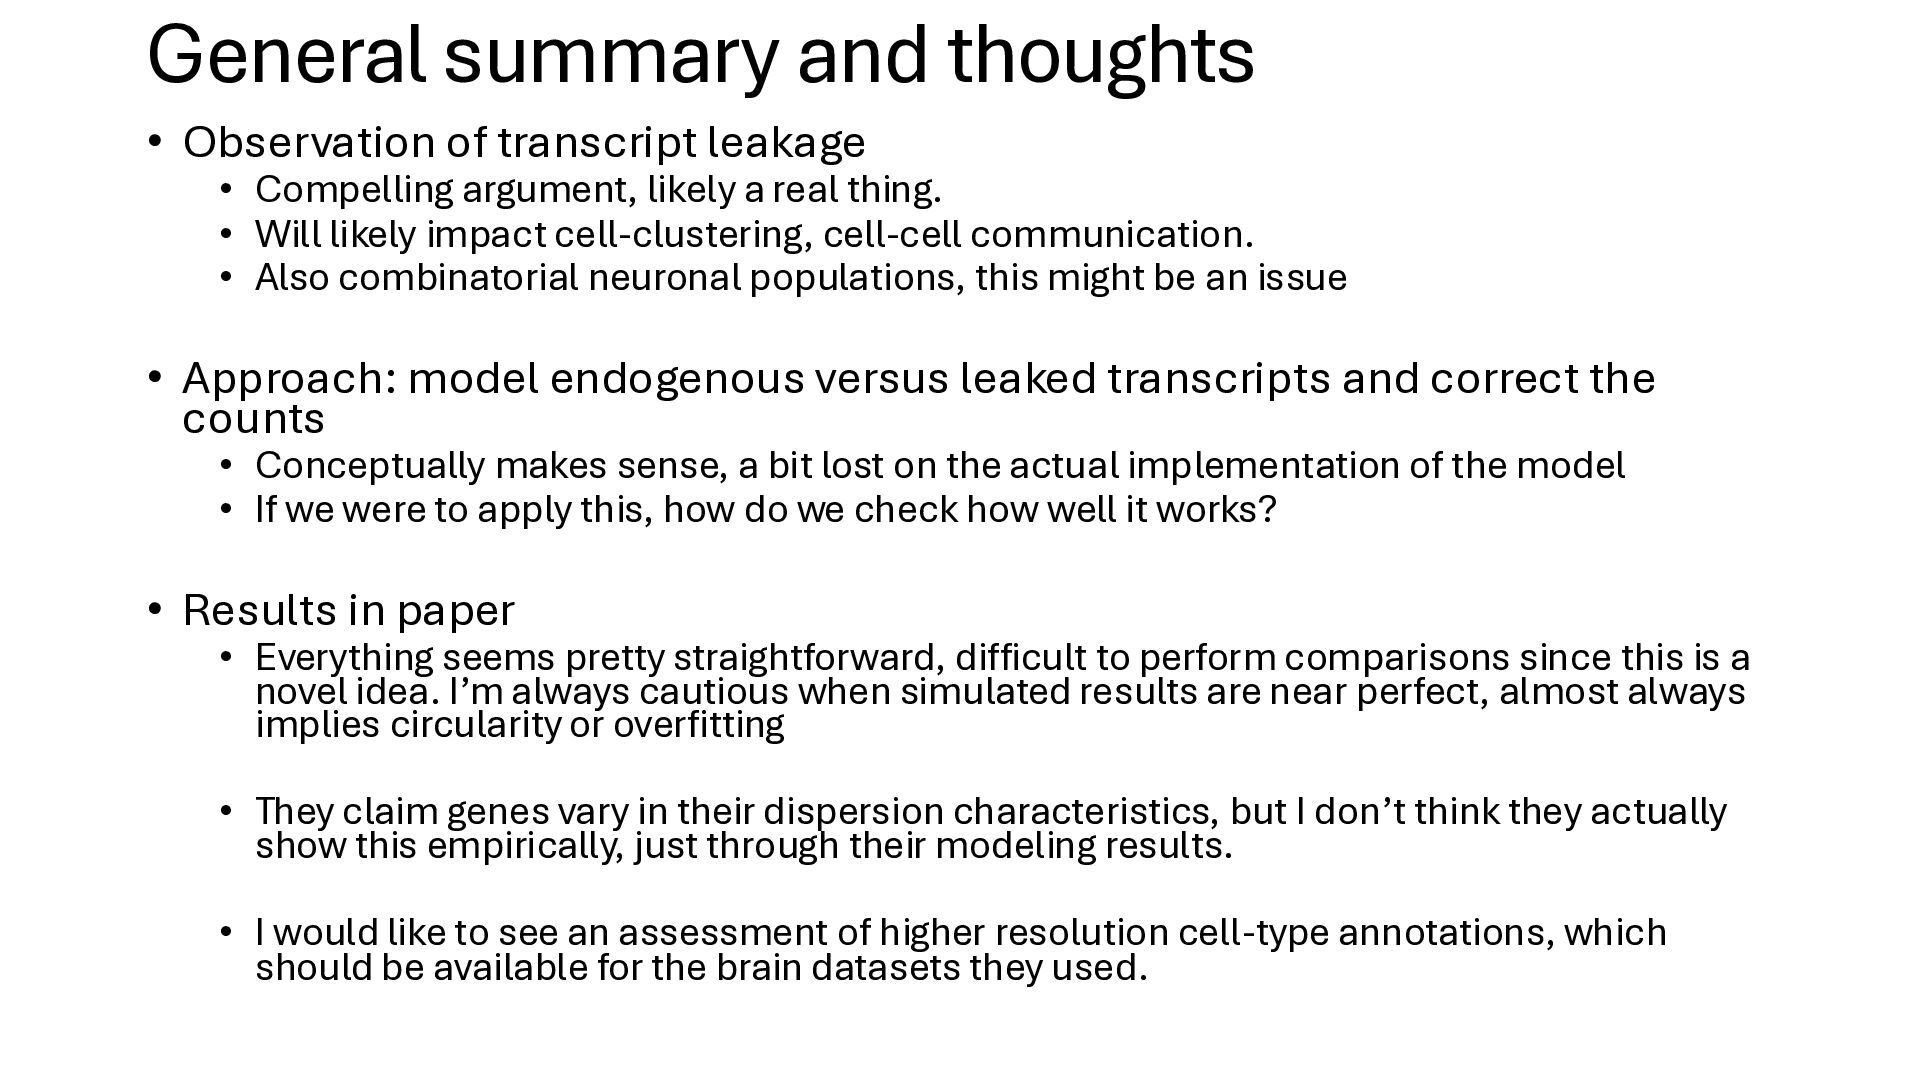
Compelling argument, likely a real thing. • Will likely impact cell-clustering, cell-cell communication. • Also combinatorial neuronal populations, this might be an issue • Approach: model endogenous versus leaked transcripts and correct the counts • Conceptually makes sense, a bit lost on the actual implementation of the model • If we were to apply this, how do we check how well it works? • Results in paper • Everything seems pretty straightforward, difficult to perform comparisons since this is a novel idea. I’m always cautious when simulated results are near perfect, almost always implies circularity or overfitting • They claim genes vary in their dispersion characteristics, but I don’t think they actually show this empirically, just through their modeling results. • I would like to see an assessment of higher resolution cell-type annotations, which should be available for the brain datasets they used.


 jonathanmwerner
 sonatard
 leimatthew05
 holman
 inesmontani
 dougneiner
 mongodb
 palkan
 csswizardry
 panda_program
 quramy
 tessaabrams