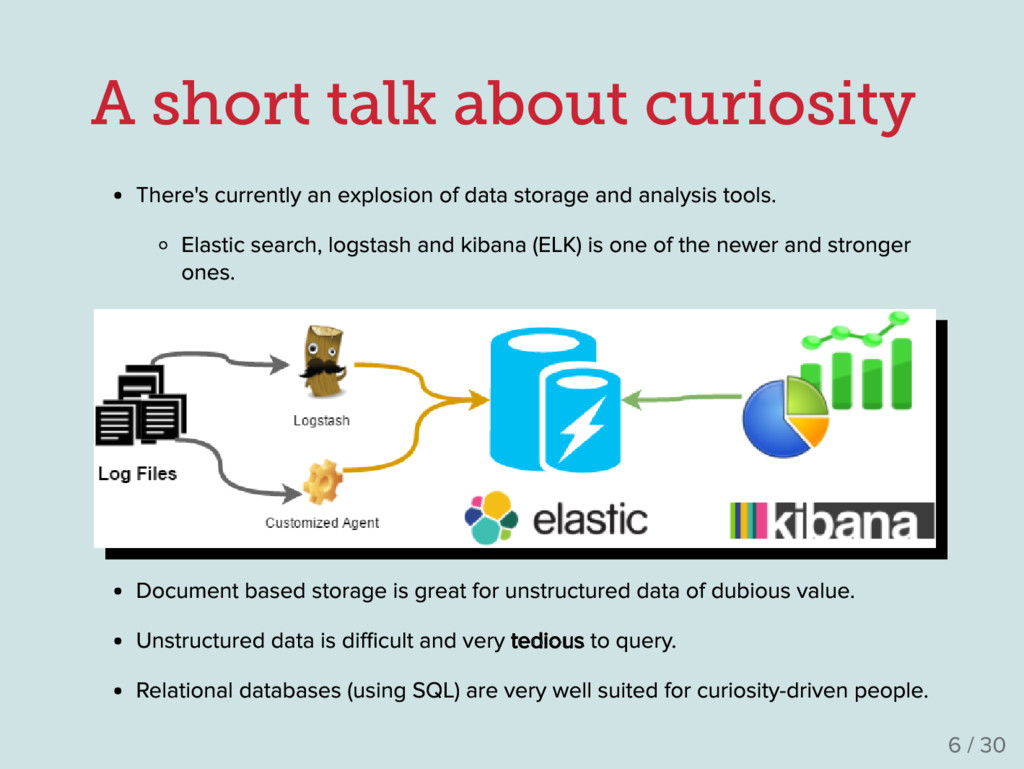
of data storage and analysis tools . Elastic search , logstash and kibana (ELK ) is one of the newer and stronger ones . Document based storage is great for unstructured data of dubious value . Unstructured data is di fficult and very tedious to query . Relational databases (using SQL ) are very well suited for curiosity -driven people . 6 / 30
complete BI suite . Mondrian : An open -source OLAP server , owned by Pentaho . Only the server , no visualization tools . Saiku : A very good and intuitive interface for Mondrian . I highly recommend this . Disadvantages They all require training or experience to get them running correctly . Full of data warehousing terminology (cubes , hyper cubes , dimensions , metrics ...) Require knowledge of yet another query language (MDX ) 8 / 30
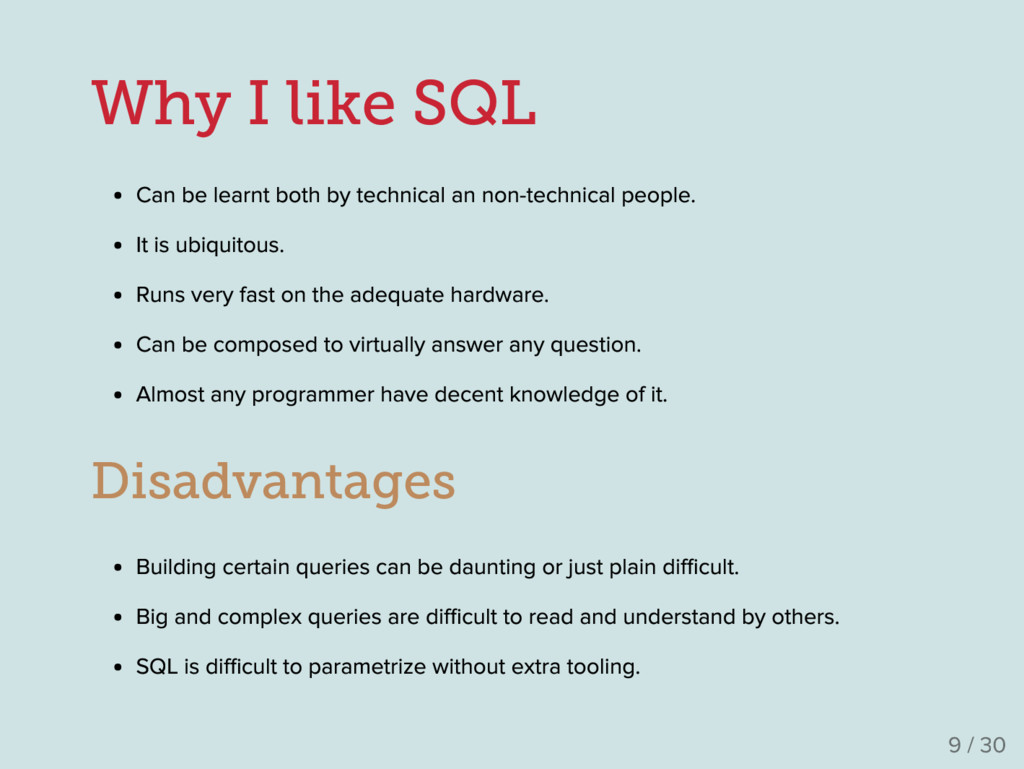
an non -technical people . It is ubiquitous . Runs very fast on the adequate hardware . Can be composed to virtually answer any question . Almost any programmer have decent knowledge of it . Disadvantages Building certain queries can be daunting or just plain di fficult . Big and complex queries are di fficult to read and understand by others . SQL is di fficult to parametrize without extra tooling . 9 / 30
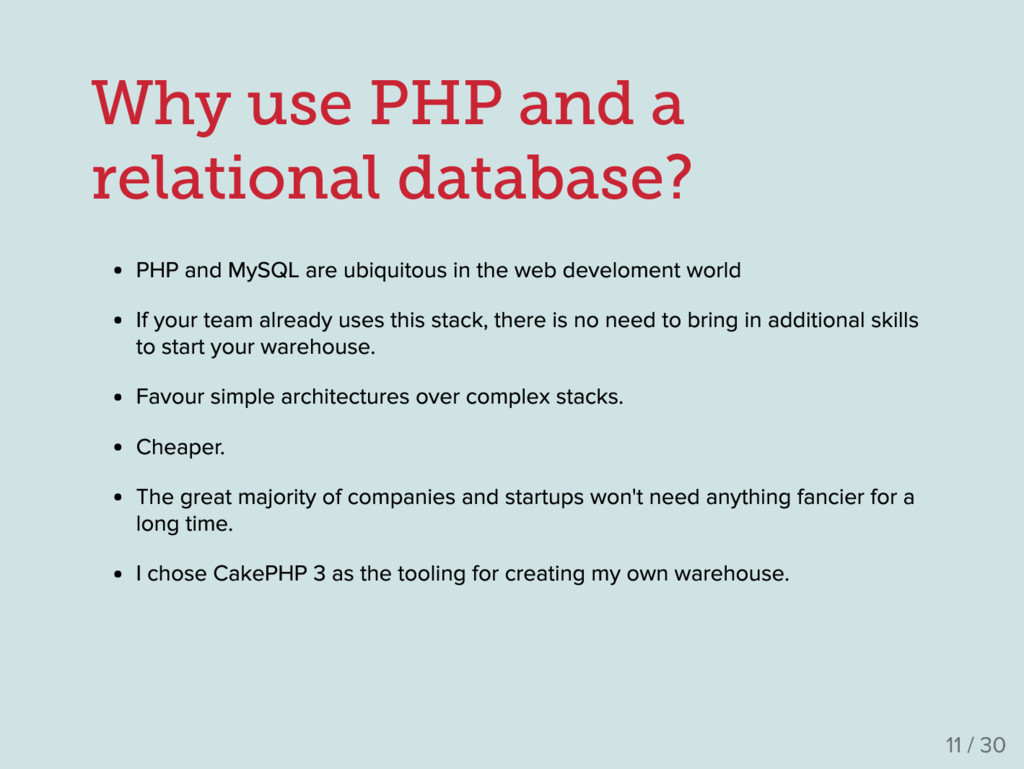
are ubiquitous in the web develoment world If your team already uses this stack , there is no need to bring in additional skills to start your warehouse . Favour simple architectures over complex stacks . Cheaper . The great majority of companies and startups won 't need anything fancier for a long time . I chose CakePHP 3 as the tooling for creating my own warehouse . 11 / 30
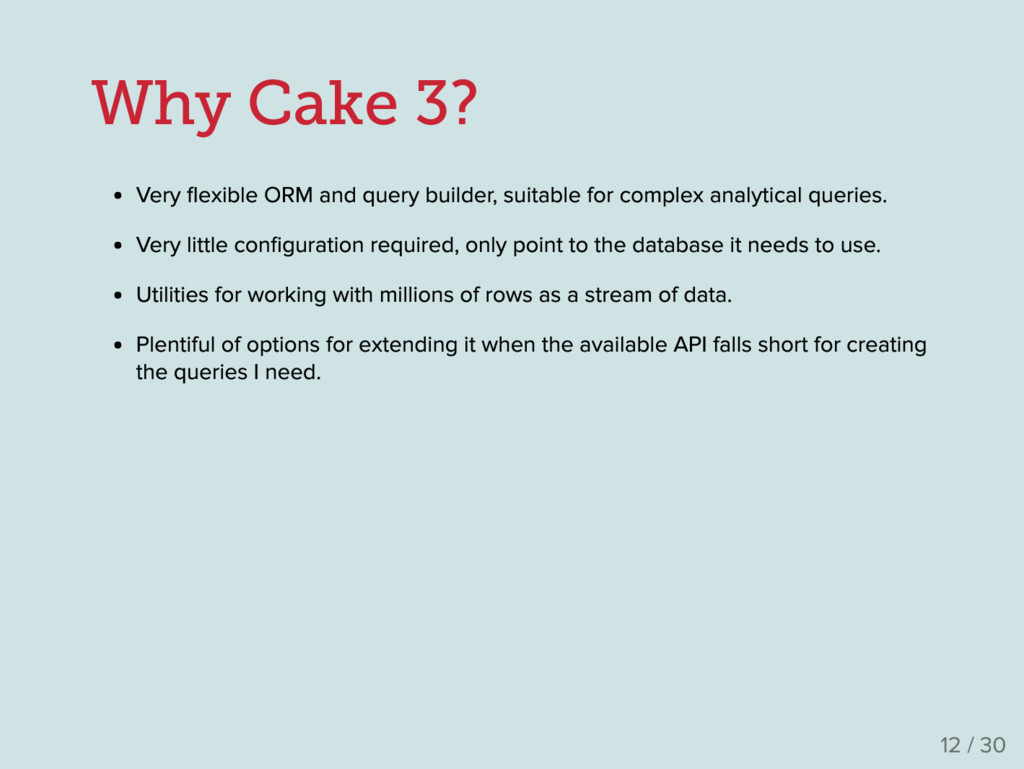
suitable for complex analytical queries . Very little con figuration required , only point to the database it needs to use . Utilities for working with millions of rows as a stream of data . Plentiful of options for extending it when the available API falls short for creating the queries I need . 12 / 30
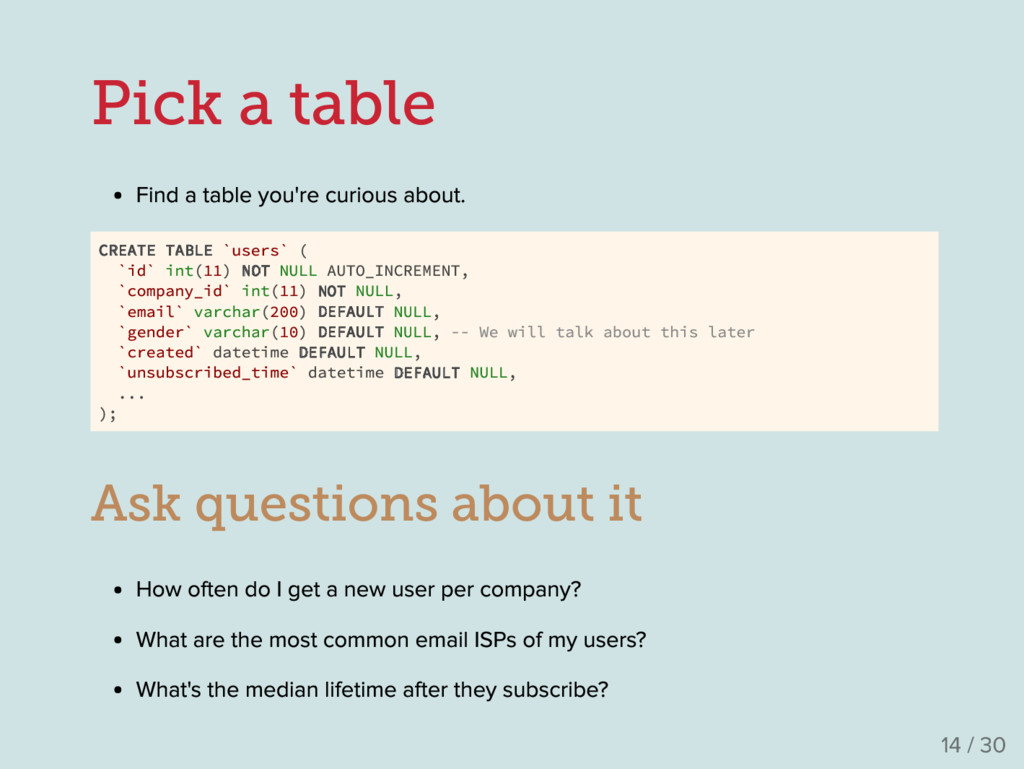
. CREATE TABLE `users` ( `id` int(11) NOT NULL AUTO_INCREMENT, `company_id` int(11) NOT NULL, `email` varchar(200) DEFAULT NULL, `gender` varchar(10) DEFAULT NULL, -- We will talk about this later `created` datetime DEFAULT NULL, `unsubscribed_time` datetime DEFAULT NULL, ... ); Ask questions about it How often do I get a new user per company ? What are the most common email ISPs of my users ? What 's the median lifetime after they subscribe ? 14 / 30
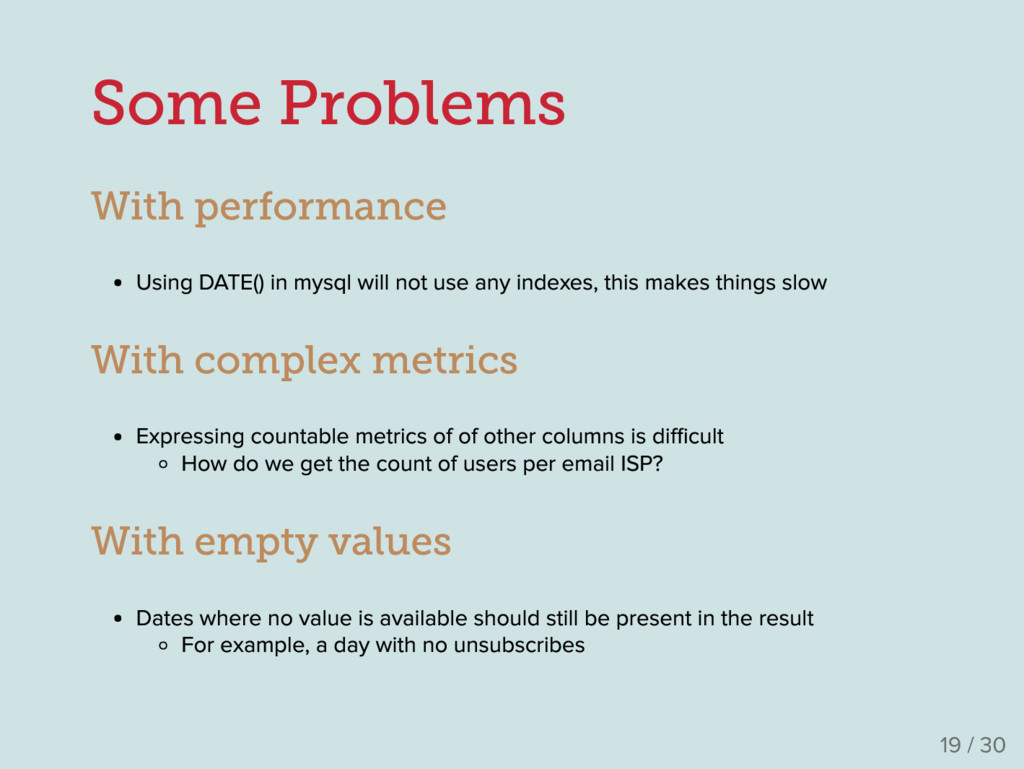
not use any indexes , this makes things slow With complex metrics Expressing countable metrics of of other columns is di fficult How do we get the count of users per email ISP ? With empty values Dates where no value is available should still be present in the result For example , a day with no unsubscribes 19 / 30
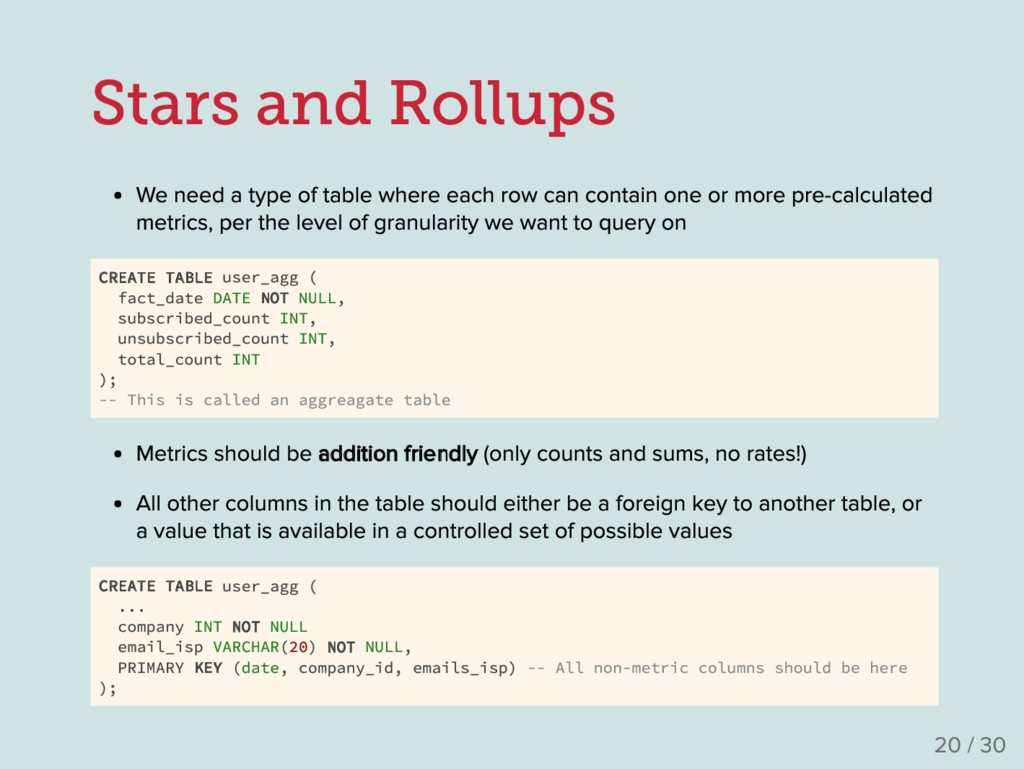
each row can contain one or more pre -calculated metrics , per the level of granularity we want to query on CREATE TABLE user_agg ( fact_date DATE NOT NULL, subscribed_count INT, unsubscribed_count INT, total_count INT ); -- This is called an aggreagate table Metrics should be addition friendly (only counts and sums , no rates !) All other columns in the table should either be a foreign key to another table , or a value that is available in a controlled set of possible values CREATE TABLE user_agg ( ... company INT NOT NULL email_isp VARCHAR(20) NOT NULL, PRIMARY KEY (date, company_id, emails_isp) -- All non-metric columns should be here ); 20 / 30
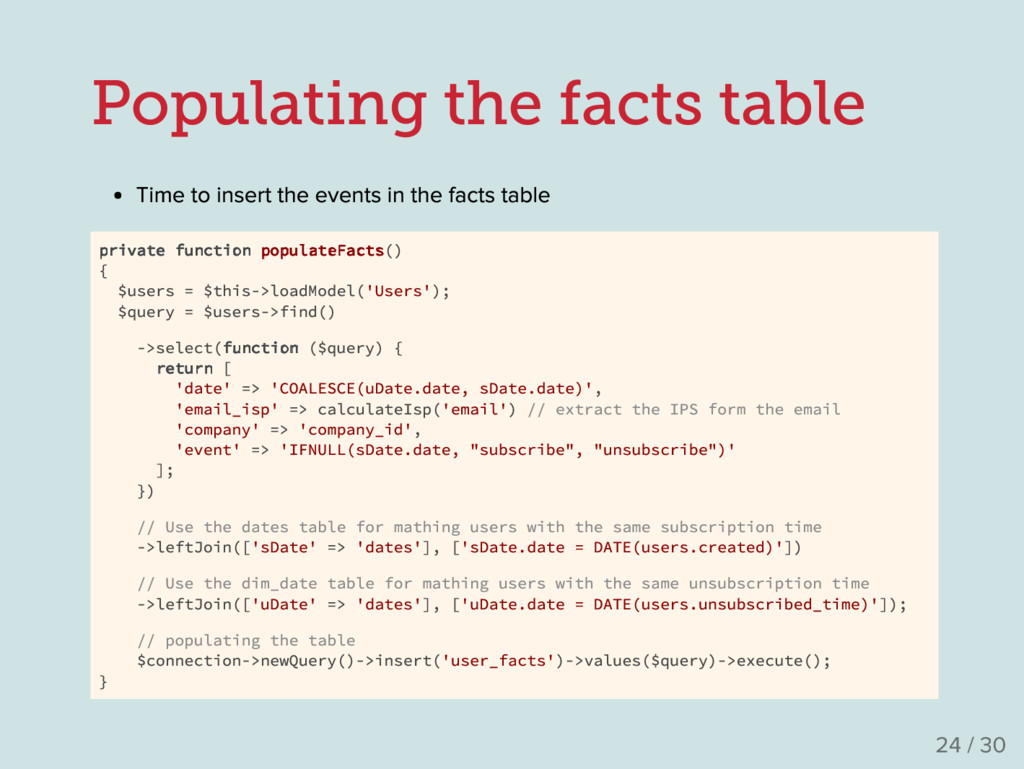
the facts table private function populateFacts() { $users = $this->loadModel('Users'); $query = $users->find() ->select(function ($query) { return [ 'date' => 'COALESCE(uDate.date, sDate.date)', 'email_isp' => calculateIsp('email') // extract the IPS form the email 'company' => 'company_id', 'event' => 'IFNULL(sDate.date, "subscribe", "unsubscribe")' ]; }) // Use the dates table for mathing users with the same subscription time ->leftJoin(['sDate' => 'dates'], ['sDate.date = DATE(users.created)']) // Use the dim_date table for mathing users with the same unsubscription time ->leftJoin(['uDate' => 'dates'], ['uDate.date = DATE(users.unsubscribed_time)']); // populating the table $connection->newQuery()->insert('user_facts')->values($query)->execute(); } 24 / 30
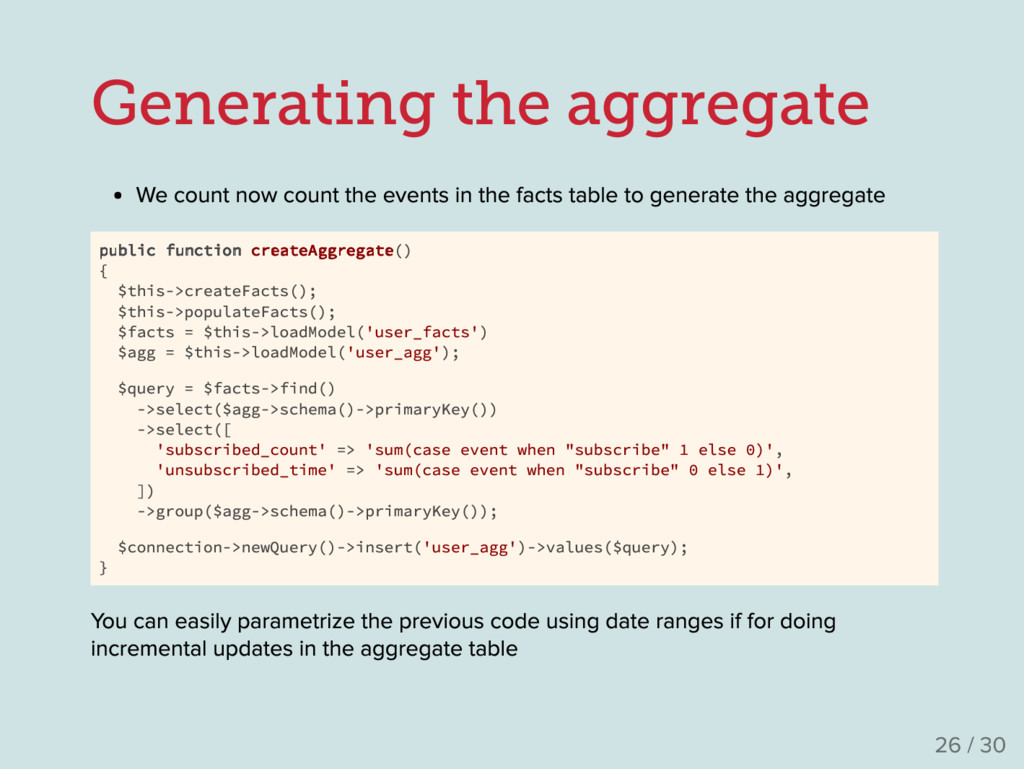
the facts table to generate the aggregate public function createAggregate() { $this->createFacts(); $this->populateFacts(); $facts = $this->loadModel('user_facts') $agg = $this->loadModel('user_agg'); $query = $facts->find() ->select($agg->schema()->primaryKey()) ->select([ 'subscribed_count' => 'sum(case event when "subscribe" 1 else 0)', 'unsubscribed_time' => 'sum(case event when "subscribe" 0 else 1)', ]) ->group($agg->schema()->primaryKey()); $connection->newQuery()->insert('user_agg')->values($query); } Y ou can easily parametrize the previous code using date ranges if for doing incremental updates in the aggregate table 26 / 30
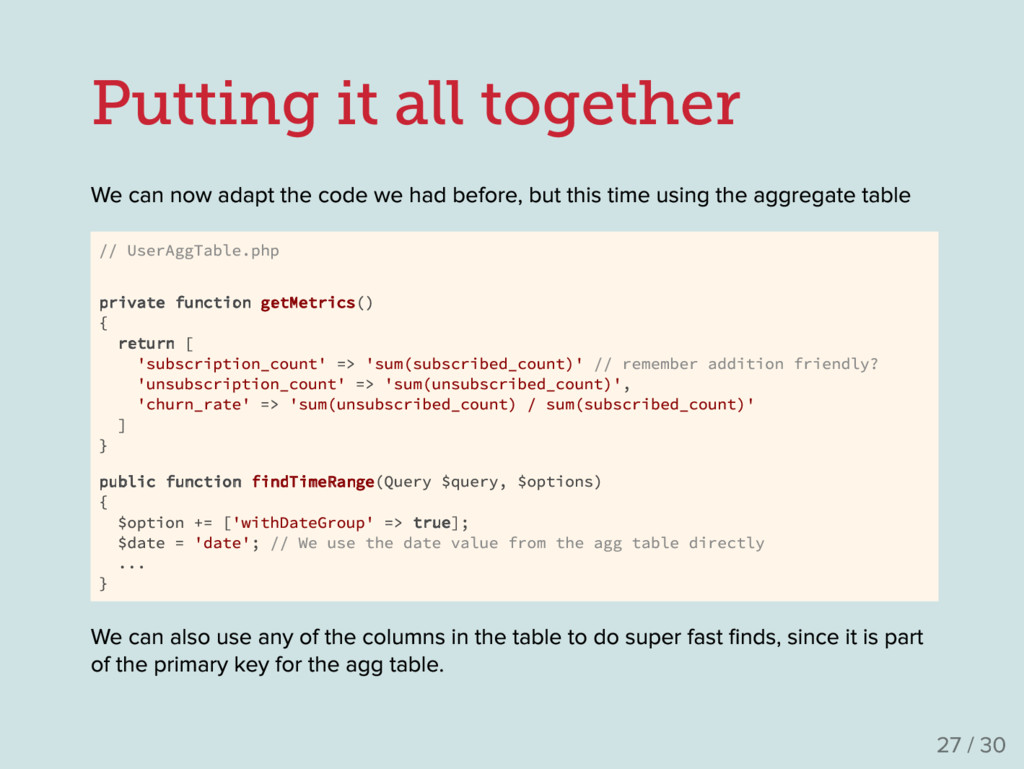
we had before , but this time using the aggregate table // UserAggTable.php private function getMetrics() { return [ 'subscription_count' => 'sum(subscribed_count)' // remember addition friendly? 'unsubscription_count' => 'sum(unsubscribed_count)', 'churn_rate' => 'sum(unsubscribed_count) / sum(subscribed_count)' ] } public function findTimeRange(Query $query, $options) { $option += ['withDateGroup' => true]; $date = 'date'; // We use the date value from the agg table directly ... } We can also use any of the columns in the table to do super fast finds , since it is part of the primary key for the agg table . 27 / 30
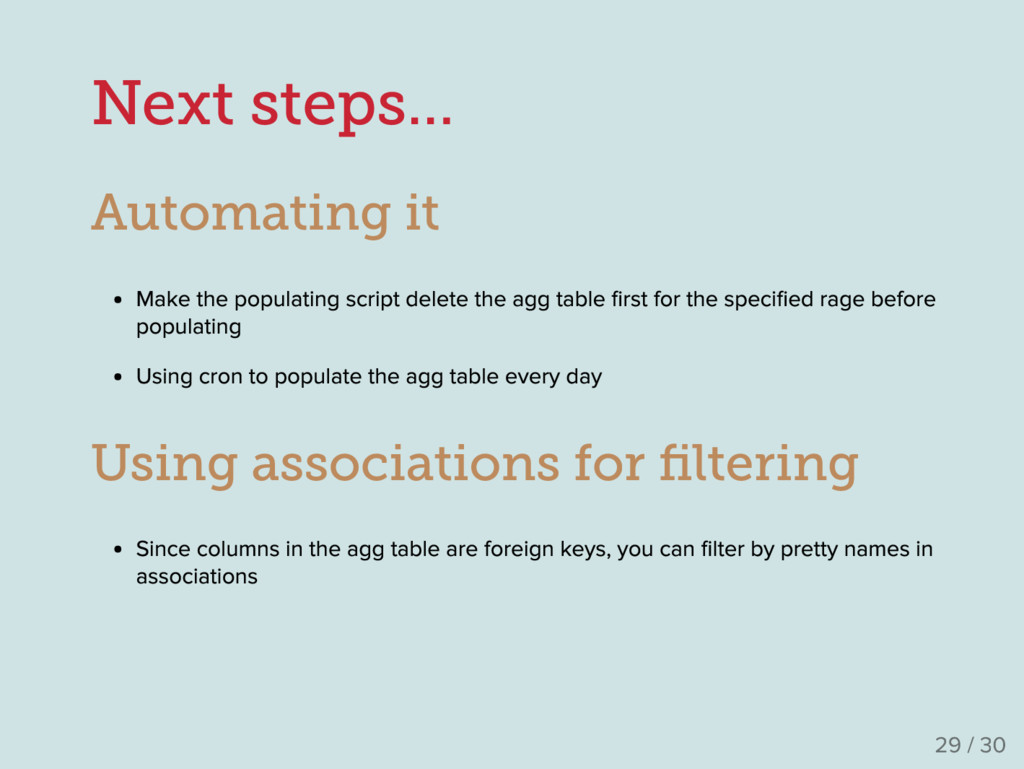
agg table first for the speci fied rage before populating Using cron to populate the agg table every day Using associations for filtering Since columns in the agg table are foreign keys , you can filter by pretty names in associations 29 / 30
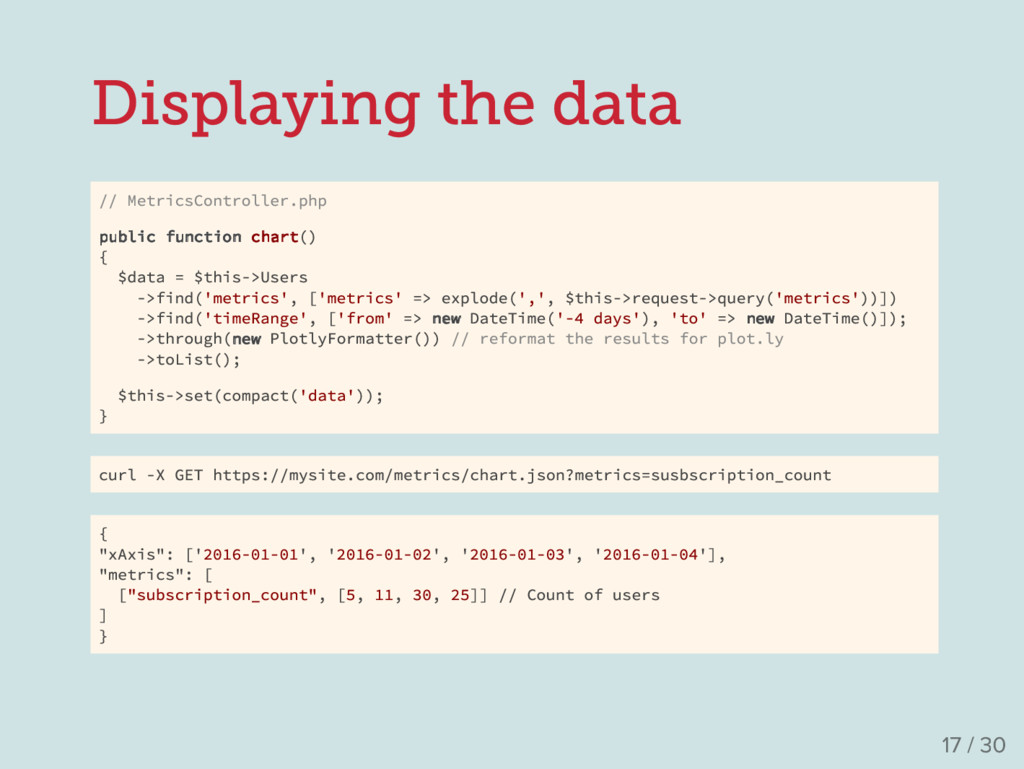
![Displaying the data var traces = []; ajaxResponse.forEach((metric) => {](https://files.speakerdeck.com/presentations/56e87b81722c434cbbb7e05ccdda783f/slide_17.jpg)