Upgrade to Pro — share decks privately, control downloads, hide ads and more …

Allstate Purchase Prediction Challenge on Kaggle

Allstate Purchase Prediction Challenge on Kaggle

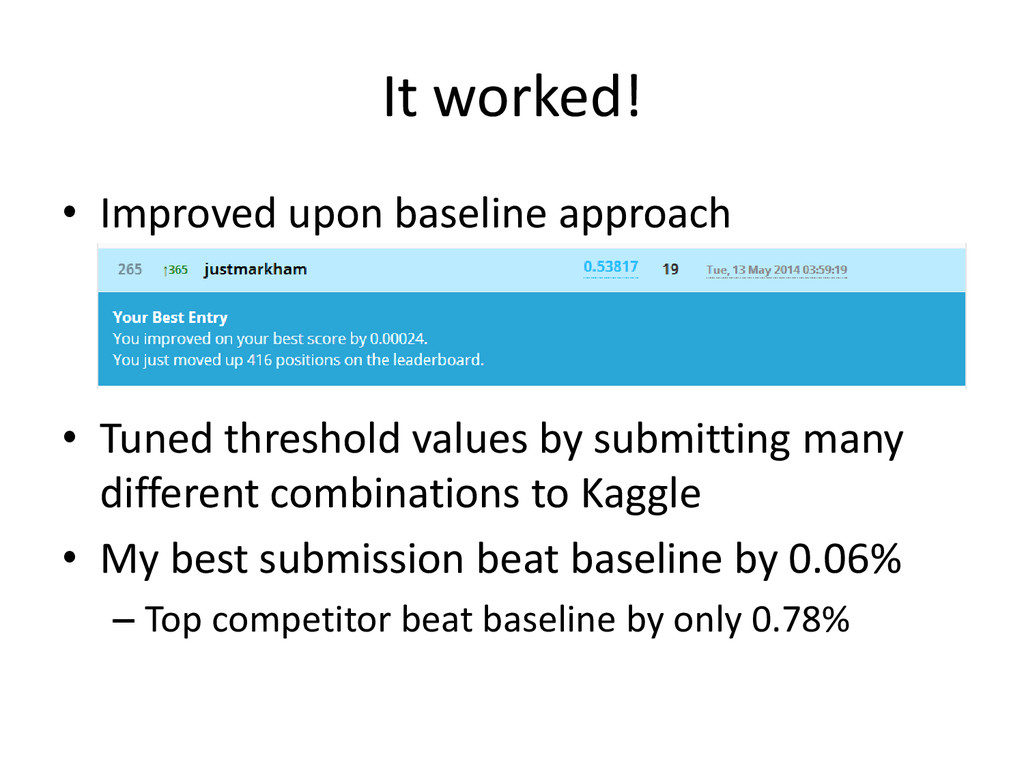
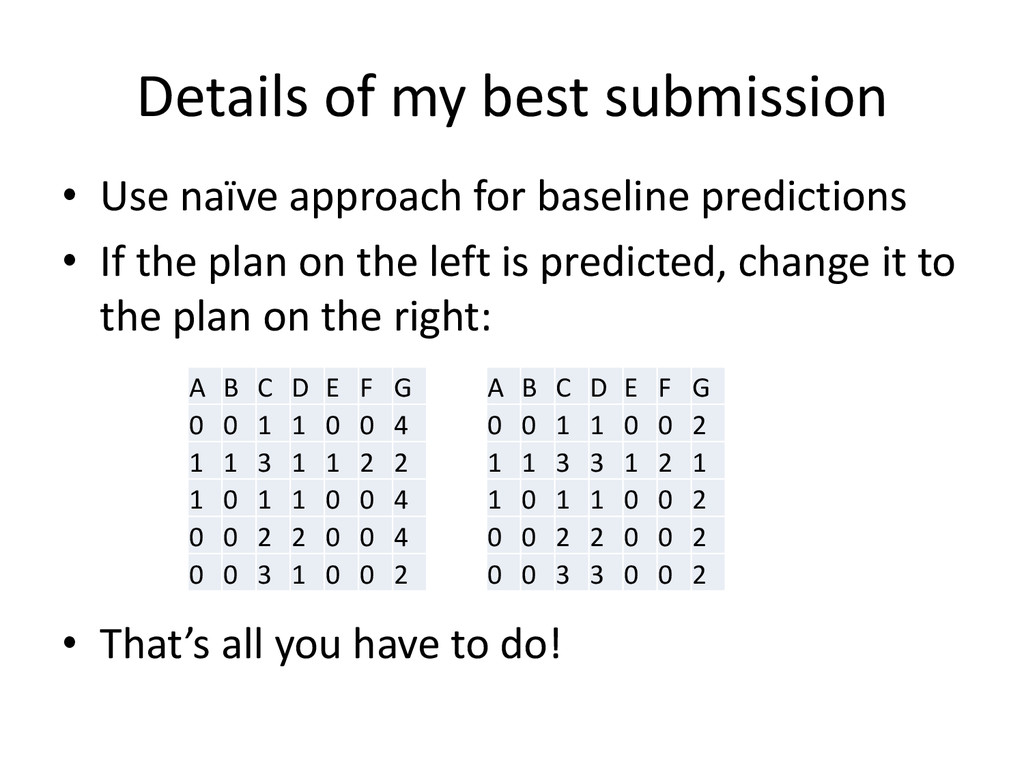
This is a presentation I gave about my participation in Kaggle's "Allstate Purchase Prediction Challenge."

Presentation recording: http://youtu.be/HGr1yQV3Um0

Blog post: http://dataschool.io/kaggle-allstate-purchase-prediction-challenge/

Project paper and code: https://github.com/justmarkham/kaggle-allstate

Competition website: http://www.kaggle.com/c/allstate-purchase-prediction-challenge

Kevin Markham

May 19, 2014
Tweet

More Decks by Kevin Markham

Other Decks in Research

Transcript

  1. Agenda • What is the competition goal? • Why is

    this difficult? • What data do we have? • What can we learn from the data? • Can machine learning help? • What worked? • What did I learn? • Did I profit? ($25K prize for first place!)
  2. What is the competition goal? • Machine learning competition run

    by Kaggle – “Machine learning” = computers learning patterns from data • Sponsored by Allstate (insurance company) • Goal: Predict which car insurance options a customer will buy
  3. Problem context • There are 7 car insurance options, each

    with 2 to 4 possible values • Values are identified by number (0, 1, 2, etc.) • A “quote” consists of a single combination of those 7 options • Customers review one or more quotes before making their purchase
  4. Example • One customer’s quote history (in order): • What

    did they purchase? A B C D E F G Quote 1 0 0 1 1 0 0 2 Quote 2 1 0 3 3 1 0 1 Quote 3 1 0 1 1 1 0 1 Quote 4 2 0 1 1 1 0 1 Quote 5 2 0 1 1 1 0 1 Quote 6 2 0 1 1 1 0 1 Quote 7 2 0 1 1 1 0 2 Purchase 2 0 1 1 1 0 2
  5. Another example • This one should be easy: • What

    did they purchase? A B C D E F G Quote 1 1 1 3 3 0 2 2 Quote 2 1 1 4 3 0 2 2 Quote 3 1 1 4 3 0 2 2 Quote 4 1 1 4 3 0 2 2 Quote 5 1 1 4 3 0 2 2 Quote 6 1 1 4 3 0 2 2 Purchase 2 1 4 3 0 1 2
  6. How does the competition work? • “Training data”: – 97,009

    customers – Complete quote history plus purchase • “Test data”: – 55,716 customers – Partial quote history – Goal is to predict the purchase – Evaluation metric is prediction accuracy
  7. Why is this difficult? • 2,304 possible combinations of options

    • Your prediction is only “correct” if you get all 7 options right! – No “partial credit” – No feedback given on which options were wrong • Options are not identified as to their meaning
  8. Start with a naïve approach • For every customer, simply

    predict that they will purchase the last set of options they were quoted • Good news: Works pretty well (accuracy of 0.53793), and much better than random guessing (0.00043) • Bad news: Everyone figured out this strategy (46% of competitors have that identical score)
  9. Data to the rescue! • Customer data – State, location

    ID, group size, homeowner, married, risk factor, oldest person covered, youngest person covered, years covered by previous issuer, previous C option • Car data – Age, value • Additional quote data – Day, time, cost
  10. What can we learn from the data? • There are

    2,304 possible option combinations, but perhaps only a small subset are ever actually purchased? • Nope: – 1,878 unique combinations appear in training or test data – 1,522 unique combinations are purchased in training data
  11. What can we learn from the data? • The more

    quotes you have for a customer, the better the naïve strategy will work.
  12. What can we learn from the data? • Test set

    has been significantly truncated
  13. Predict based on option interactions • Use the naïve approach

    to make the “baseline” predictions • Create a list of “rules” about pairs of options, and use these rules to “fix” the baseline predictions – Example: If C=3 or C=4, choose D=3 • Result: Worse than naïve approach!
  14. Why didn’t this approach work? • These “rules” are based

    on strong patterns in the data, but patterns are not always correct • You don’t know how many of the 7 options need to be changed from the baseline • Key insight: There is a huge risk when changing any baseline prediction: – There is a 53.793% chance you will “break” a prediction that is already correct. – Balance that against the 0.043% chance that you will change an incorrect prediction to be correct!
  15. New strategy: Model stacking • It is very important to

    only change a baseline prediction if you’re sure it’s wrong. • Use a “stacked model” approach: – First, predict which customers are likely to change options after their final quote. – Then, fix the baseline predictions only for those customers.
  16. Step 1: Predict who will change • Model with logistic

    regression, random forests • Evaluate using ROC curve – Reference ROC curve (left) vs. my curve (right)
  17. Feature engineering to the rescue! • Create new features by

    transforming or combining existing features • Less noisy than the raw features (and less likely to overfit the training data) • Examples: – “family” (yes/no): married, group size > 2, youngest covered individual < 25 years old – “timeofday” (day/evening/night): 6am-3pm, 4pm- 6pm, 7pm-5am
  18. Feature engineering • Examples: – “stability”: calculation of how much

    a customer changed their plan options during the quoting process (low stability = more likely to change?) – “planfreq”: calculated frequency with which a given plan appears in the data (low planfreq = more likely to change?)
  19. Step 1 (redux): Predict who will change • Redo model,

    except with new features! • Evaluate using ROC curve – My old curve (left) vs. my new curve (right)
  20. New strategy: Precision not accuracy • Key insight: When predicting

    which customers will change, it’s much more important to optimize for precision than accuracy – Thus: minimize false positives by setting a high probability threshold • Example: – In test set, about 25,000 customers will change options after their final quote – Don’t try to find all 25,000; instead find 100 customers you are sure will change (and fix their baseline predictions)
  21. Optimizing for precision • Created a cross-validation framework to predict

    the test set precision of my model • Tuned the probability threshold for predicting change to 0.85 (rather than 0.50) – Obtained 91% cross-validated precision on training set – Also validated (somewhat) on test set
  22. Step 2: Predict new plans • For customers who I

    predict will change, two options for how to predict their new plans: – Build 1 model to predict the entire combination of 7 options at once – Build 7 models to predict each individual option, and then combine the results • Chose second option • Used random forests and single-hidden-layer neural networks
  23. Poor prediction results • In order for the 7-model approach

    to produce a correct combination of options at least 50% of the time, each model needs to be at least 90% accurate (since 0.90^7 = 0.50) • Instead, models performed with 60-80% accuracy and thus rarely predicted a completely correct combination of options
  24. Backup plan: Manual adjustments • Located 9 customers in test

    set that had a very high probability of change • Revise option combinations using my list of “rules” about unlikely combinations – Example: If C=3 or C=4, choose D=3 • Tweaked combinations by comparing against random forest model • Time intensive, but could convert into a pure machine learning model if it worked • Result: No improvement over the baseline
  25. New strategy: Locate unlikely plans • Based on a tip

    from the Kaggle forums: – Locate plans (combinations of all 7 options) that were “rarely” purchased – If those plans were predicted by the naïve approach, replace them with “more likely” alternatives • These are probably combinations of options that “don’t make sense” to most people • Note: This approach ignores all customer data!
  26. Locating and replacing unlikely plans • Determine which plans are

    “unlikely” – Calculate view count and purchase likelihood for every plan and set threshold values • Determine the best replacement plan for each unlikely plan – Tally which plans were actually purchased by those who viewed them – Calculate replacement plan commonality and set threshold value
  27. It worked! • Improved upon baseline approach • Tuned threshold

    values by submitting many different combinations to Kaggle • My best submission beat baseline by 0.06% – Top competitor beat baseline by only 0.78%
  28. Details of my best submission • Use naïve approach for

    baseline predictions • If the plan on the left is predicted, change it to the plan on the right: • That’s all you have to do! A B C D E F G 0 0 1 1 0 0 4 1 1 3 1 1 2 2 1 0 1 1 0 0 4 0 0 2 2 0 0 4 0 0 3 1 0 0 2 A B C D E F G 0 0 1 1 0 0 2 1 1 3 3 1 2 1 1 0 1 1 0 0 2 0 0 2 2 0 0 2 0 0 3 3 0 0 2
  29. Improving this approach • Stack this approach with one of

    my models – Did not succeed in improving test set accuracy • Other ideas (didn’t have time to try them): – Don’t always replace an unlikely plan – Don’t always choose the same replacement plan for an unlikely plan • Top competitors are likely using an ensemble of models that incorporates this approach
  30. Lessons Learned • Early in the competition, try many different

    approaches • Smarter strategies trump more modeling and more data • Real-world data is hard to work with • Algorithms and processes that allow for rapid iteration are priceless • Learn from others around you