Upgrade to Pro — share decks privately, control downloads, hide ads and more …

Collecting Metrics with Graphite and StatsD

Collecting Metrics with Graphite and StatsD

Do you gather metrics from your application? Can you combine them and easily generate custom graphs out of them? Can your developers measure whatever they want at any point of your application without breaking it or making it slower?

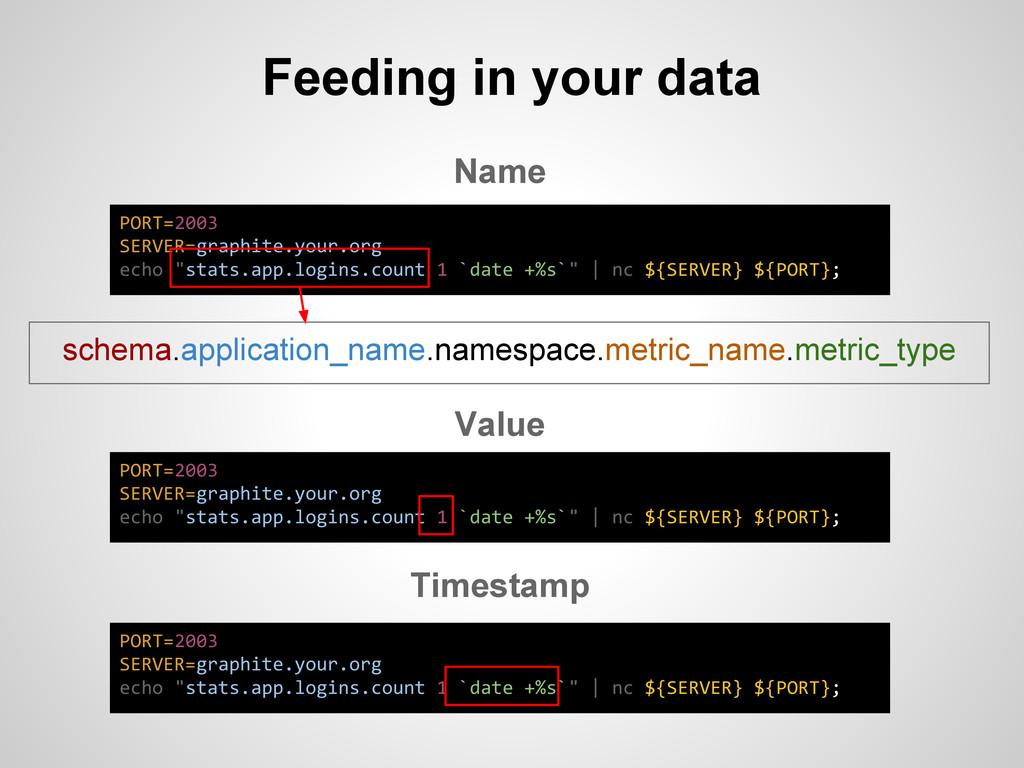
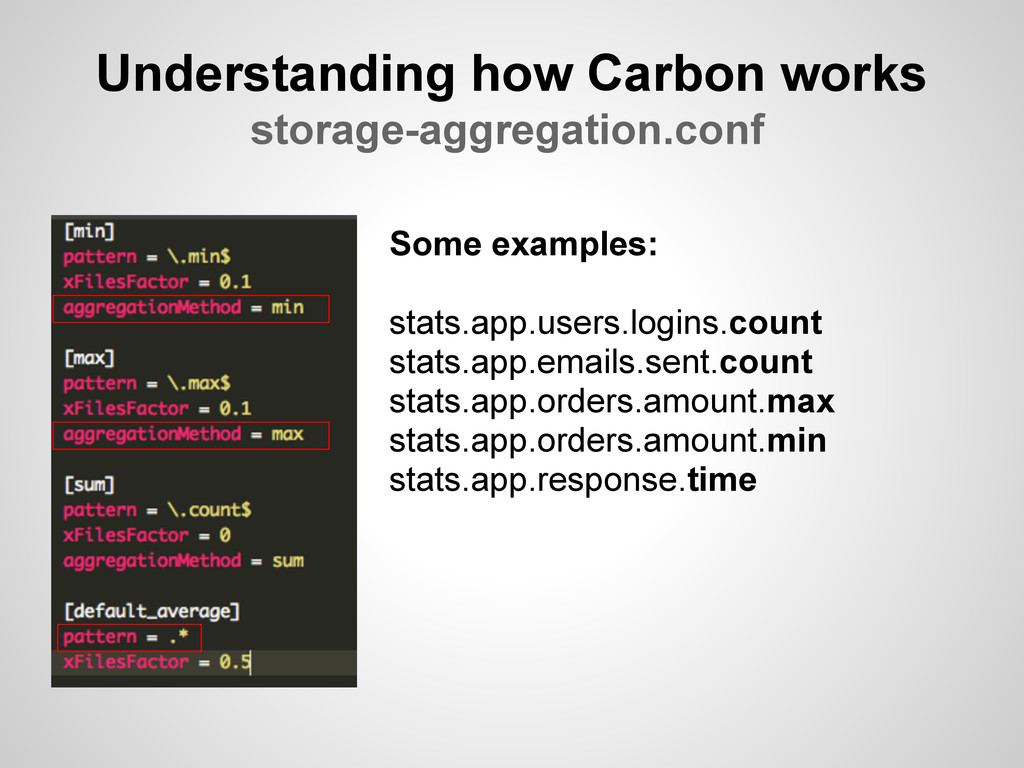
In our next itnig friday, Víctor Martínez will show us how easy it is to roll on your own Graphite installation and how to use Etsy's statsd collector to flush your metrics. You will learn what Graphite is, how all of its components work, how to get your real time&historic metrics into Carbon, Graphite's database, and how to plot them in different manners. Víctor will show us some Graphite dashboards, gotchas, design limitations and how to deal with them.

Víctor Martínez

February 08, 2013
Tweet

More Decks by Víctor Martínez

Other Decks in Technology

Transcript

  1. What is Graphite? An all-in-one solution for storing and visualizing

    realtime time-series data in an efficient manner. Key features: Efficient storage and ultra-fast retrieval. http://graphite.wikidot.com/
  2. Graphite Architecture Graphite Web The frontend of Graphite. It provides

    a dashboard for retrieval and visualization of our metrics and a powerful plotting API. Carbon The core of Graphite. It consists of set of three processes that take care of receiving incoming data, aggregating it and persisting it to disk. Whisper The current (stable) data persistence storage; an efficient time-series based database. * There's a new persistence layer called Ceres in the works
  3. Feeding in your data PORT=2003 SERVER=graphite.your.org echo "stats.app.logins.count 1 `date

    +%s`" | nc ${SERVER} ${PORT}; PORT=2003 SERVER=graphite.your.org echo "stats.app.logins.count 1 `date +%s`" | nc ${SERVER} ${PORT}; PORT=2003 SERVER=graphite.your.org echo "stats.app.logins.count 1 `date +%s`" | nc ${SERVER} ${PORT}; schema.application_name.namespace.metric_name.metric_type Value Name Timestamp
  4. Understanding how Carbon works storage-schemas.conf Allows you to define how

    your data should be persisted (retention rules) and in which order (priority). storage-aggregation.conf Allows you to define how your metrics should be aggregated. Key configuration files
  5. Understanding how Carbon works storage-schemas.conf What does retention mean? In

    a timespan of X time, in how much granularity I want to store my data
  6. Understanding how Carbon works storage-schemas.conf • For a timespan of

    6 hours I want to store my data in intervals of 10 seconds. • For a timespan of 7 days I want to store my data in intervals of 1 minute. • For a timespan of 1 year I want to store my data in intervals of 1 hour. • For a timespan of 5 year I want to store my data in intervals of 24 hours.
  7. Understanding how Carbon works Carbon limitations What happens if I

    send two metrics at the same timespan (1h)? 1 new user – 6 minutes ago 2 new users – 5 minutes ago
  8. Understanding how Carbon works Carbon limitations • Increase schema retention:

    1s:12h,[...] and never, ever, push metrics older than 12 hours/push more than once per second • Pre-aggregate your data before pushing • Use StatsD Possible Solutions:
  9. Understanding how Carbon works Use StatsD What is StatdD? A

    network daemon that runs on the Node.js platform and listens for statistics, like counters and timers, sent over UDP and sends aggregates to one or more pluggable backend services (e.g., Graphite). Key features: Aggregates the data for us, fire and forget communication protocol (UDP) https://github.com/etsy/statsd/
  10. Understanding how Carbon works https://github.com/Shopify/statsd-instrument StatsD.increment('revenue', 23.99) StatsD.measure('worker.time') do Worker.perform(value)

    end StatsD Instrument Gem Important: Carefully read StatsD documentation and ensure that your Carbon configuration explicitly matches StatsD naming conventions
  11. Visualizing your metrics Using the Graphite dashboard Common functions: •

    summarize • timeShift • keepLastValue • integral • drawAsInfinite • sumSeries • alias • aliasByNode Full Documentation: http://graphite.readthedocs. org/en/1.0/functions.html
  12. Visualizing your metrics Using the Graphite dashboard Time-shifting and aliasing:

    alias(timeShift(camaloon.sidekiq.workers.success.count,"24h"),"Yesterday") alias(camaloon.sidekiq.workers.success.count,"Today")
  13. Visualizing your metrics Using the Graphite dashboard Aliasing and combining

    series: aliasByNode(camaloon.sidekiq.workers.*.count, 3)