Upgrade to Pro
— share decks privately, control downloads, hide ads and more …
Speaker Deck
Sign up for free
Menu
Search
Features
All features
Private URLs
Password Protection
Custom URLS
Scheduled publishing
Remove Branding
Restrict embedding
Deck Collections
Notes
Features
All features
Private URLs
Password Protection
Custom URLS
Scheduled publishing
Remove Branding
Restrict embedding
Deck Collections
Notes
Explore
Featured decks
Featured speakers
Programming
Technology
Storyboards
Explore
Featured decks
Featured speakers
Programming
Technology
Storyboards
Pricing
Search
Sign in
Sign up for free
Kubeshark で Kubernetes の Traffic を眺めてみよう/Let's ...
Search
kota2and3kan
December 11, 2024
Technology
990
3
Share
Embed
Copy iframe code
Copy JS code
Copy link
Start on current slide
Kubeshark で Kubernetes の Traffic を眺めてみよう/Let's Look at k8s Traffic with Kubeshark
kota2and3kan
December 11, 2024
More Decks by kota2and3kan
See All by kota2and3kan
Lakehouse を Kubernetes 上に作ってみる / Lakehouse on Kubernetes
kota2and3kan
0
48
Keycloak を使った SSO で CockroachDB にログインする / CockroachDB SSO with Keycloak
kota2and3kan
0
290
Quarkus で FizzBuzz する CLI を作ってみた / FizzBuzz with Quarkus
kota2and3kan
0
75
CockroachDB Enterprise Features Overview
kota2and3kan
1
300
CockroachDB はどのくらい「しぶとい」のか? / How tough is CockroachDB?
kota2and3kan
21
13k
JRE しか入ってない Pod で Java の heap dump を取りたい / Get heap dump on JRE container
kota2and3kan
2
1.3k
Let's try CockroachDB
kota2and3kan
1
710
分散トランザクション in CockroachDB / Distributed Tx in CockroachDB
kota2and3kan
1
2.3k
Resolving Tx Conflicts in CockroachDB ~Short Version~
kota2and3kan
0
280
Other Decks in Technology
See All in Technology
⾮構造化データを価値に変える AI エージェント基盤とその組織
ivry_presentationmaterials
0
190
オントロジーって 結局なにもの? AI エージェントに「意味」を渡す知識設計の話
greenmidori
0
180
ブラウザとサーバーから考えるAI時代のフロントエンド監視
shogo4131
3
940
【Data Engineering Summit2026_登壇資料】医療ビッグデータ×AIエージェントを支えるデータ基盤とハーネスエンジニアリング
jmdc_presentation
0
170
「Docker Desktop不要の時代」は 来たのか?
ueponx
0
760
Optunaの最新リリースv5.0について
pfn
PRO
0
120
脆弱性診断って、何をしているの? 〜弱点を見つけて、会社の改善につなげるまで〜
keeg
0
920
会社説明資料
persolserverworks
0
9.8k
二歩目のフロントエンド・ウェブアクセシビリティ
camiha
2
570
実践!Cloud Run ハンズオン!! / Cloud Run handson
y0hgi
2
280
初海外で注意すべきこと12選!!!安全快適なre:invent生活にするために
yuuuuuuu168
1
160
実践! SRE × AI - ABEMA における AIOps -
tetsuya28
8
3.1k
Featured
See All Featured
Groundhog Day: Seeking Process in Gaming for Health
codingconduct
0
410
Reflections from 52 weeks, 52 projects
jeffersonlam
356
22k
End of SEO as We Know It (SMX Advanced Version)
ipullrank
3
4.4k
GraphQLとの向き合い方2022年版
quramy
50
15k
Primal Persuasion: How to Engage the Brain for Learning That Lasts
tmiket
0
500
Mobile First: as difficult as doing things right
swwweet
225
10k
4 Signs Your Business is Dying
shpigford
187
23k
Building AI with AI
inesmontani
PRO
1
1.3k
Mind Mapping
helmedeiros
1
400
Design in an AI World
tapps
1
350
How to Talk to Developers About Accessibility
jct
2
580
Build The Right Thing And Hit Your Dates
maggiecrowley
39
3.5k
Transcript
2024/12/11 Oracle Cloud Hangout Cafe Season 9 #3 Kubeshark で
Kubernetes の Traffic を眺めてみよう #ochacafe
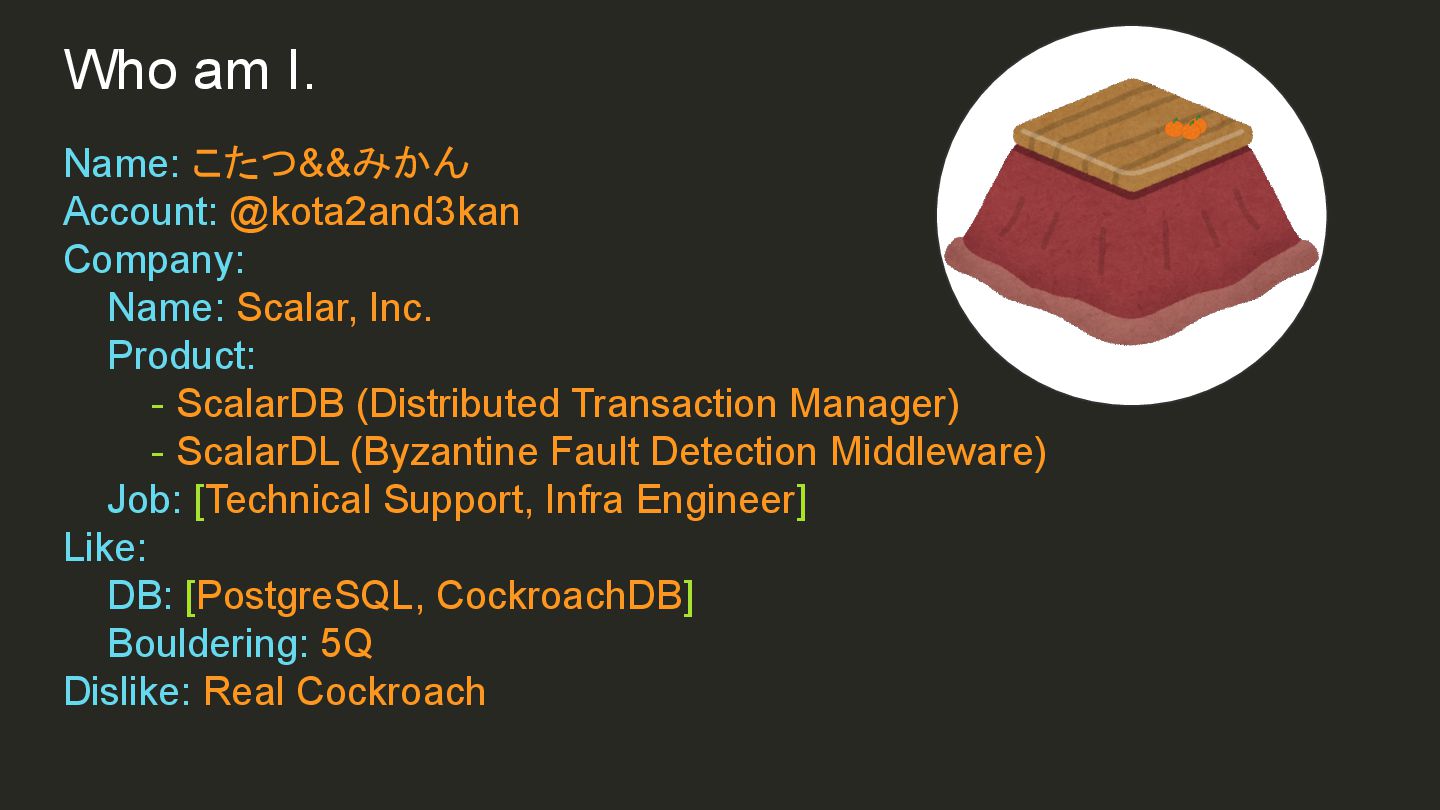
Name: こたつ&&みかん Account: @kota2and3kan Company: Name: Scalar, Inc. Product: -
ScalarDB (Distributed Transaction Manager) - ScalarDL (Byzantine Fault Detection Middleware) Job: [Technical Support, Infra Engineer] Like: DB: [PostgreSQL, CockroachDB] Bouldering: 5Q Dislike: Real Cockroach Who am I.
今日は Kubeshark のお話をします
Kubeshark Overview
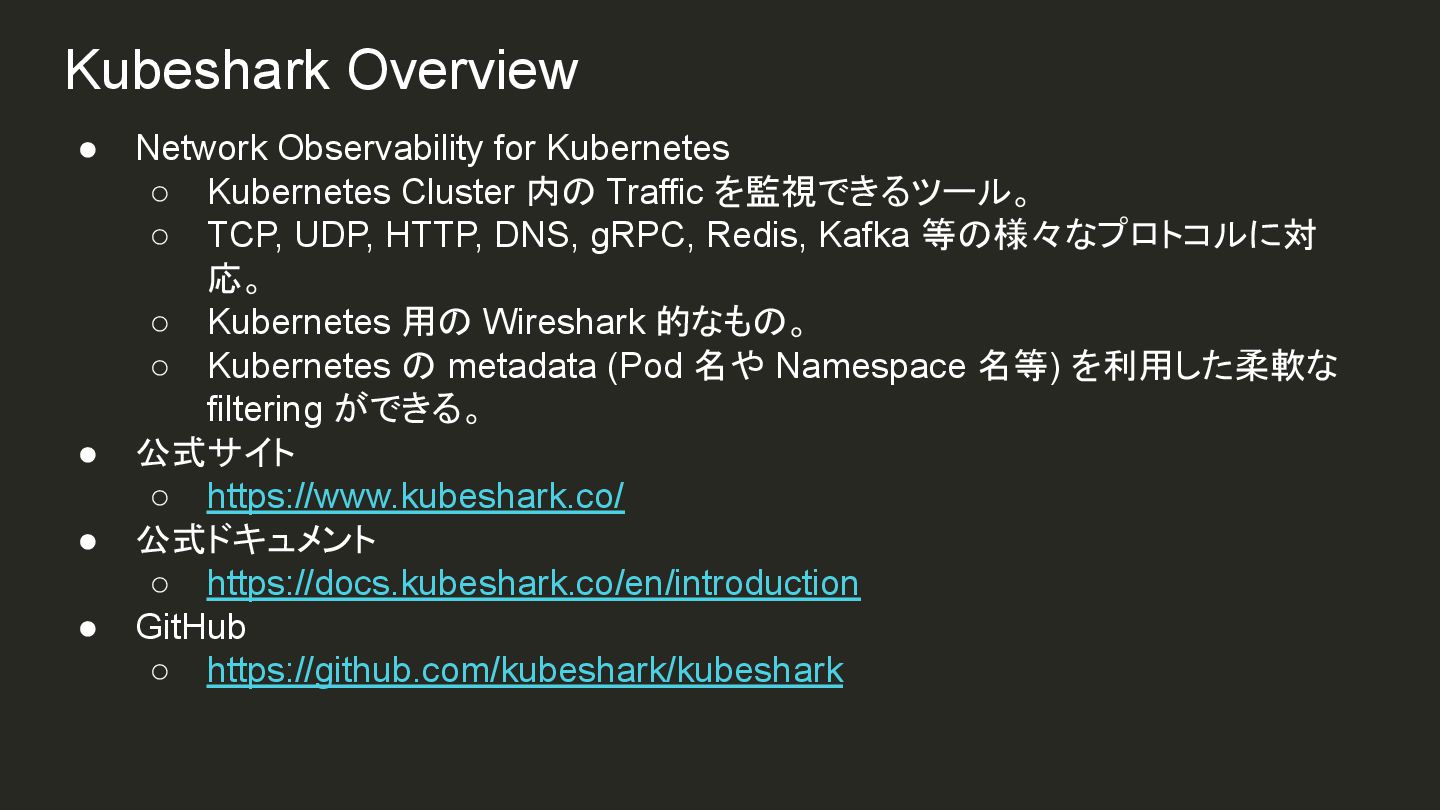
Kubeshark Overview • Network Observability for Kubernetes ◦ Kubernetes Cluster
内の Traffic を監視できるツール。 ◦ TCP, UDP, HTTP, DNS, gRPC, Redis, Kafka 等の様々なプロトコルに対 応。 ◦ Kubernetes 用の Wireshark 的なもの。 ◦ Kubernetes の metadata (Pod 名や Namespace 名等) を利用した柔軟な filtering ができる。 • 公式サイト ◦ https://www.kubeshark.co/ • 公式ドキュメント ◦ https://docs.kubeshark.co/en/introduction • GitHub ◦ https://github.com/kubeshark/kubeshark
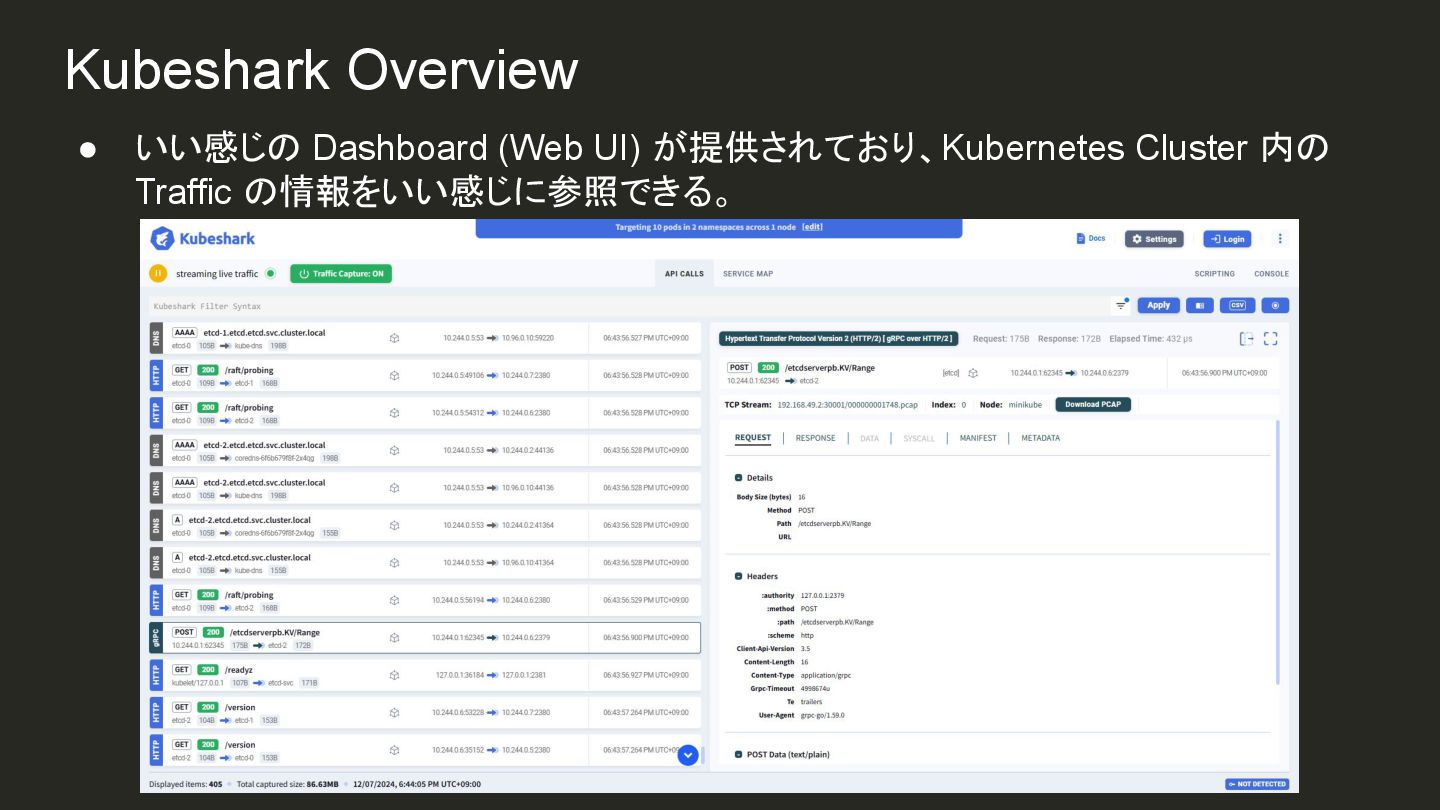
Kubeshark Overview • いい感じの Dashboard (Web UI) が提供されており、Kubernetes Cluster 内の
Traffic の情報をいい感じに参照できる。
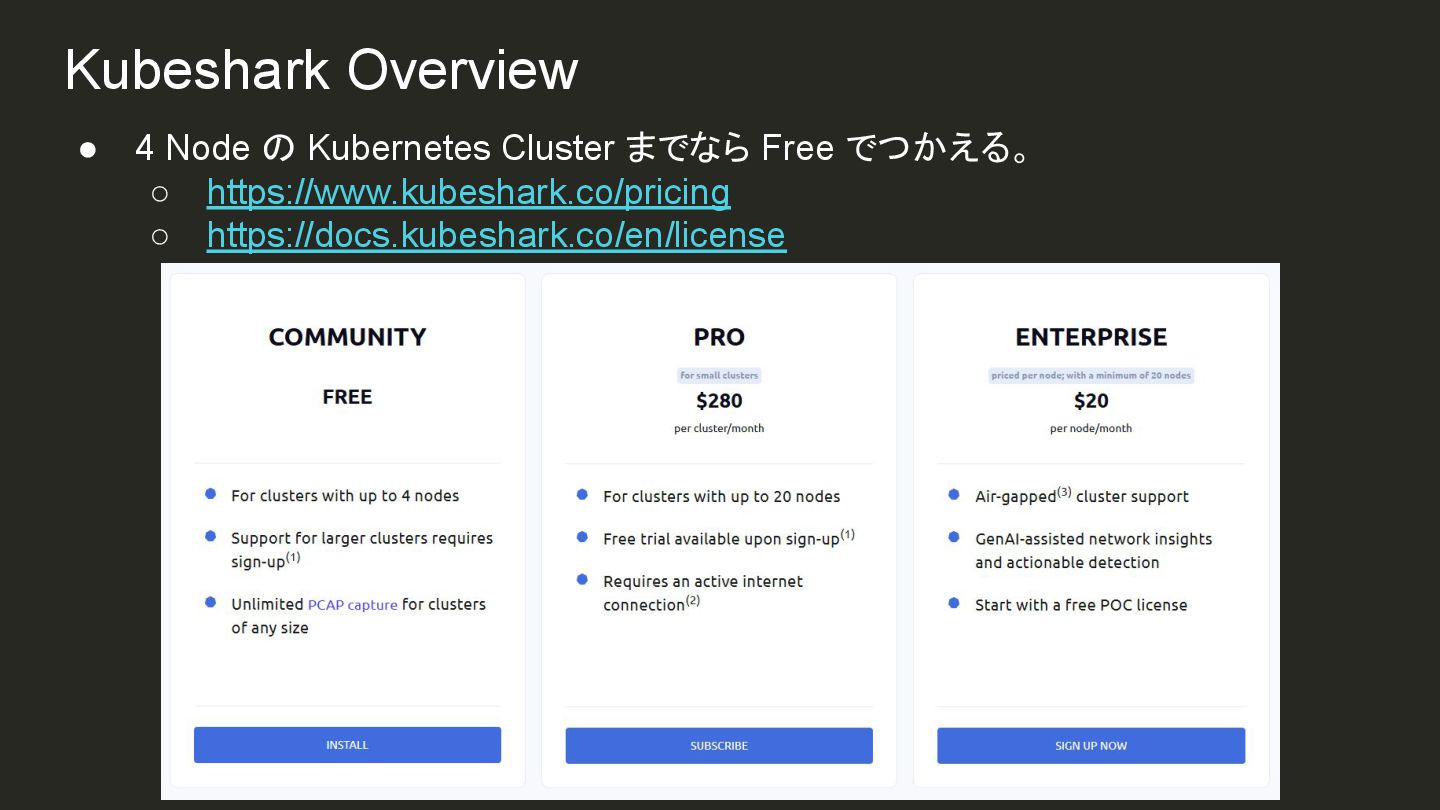
• 4 Node の Kubernetes Cluster までなら Free でつかえる。 ◦
https://www.kubeshark.co/pricing ◦ https://docs.kubeshark.co/en/license Kubeshark Overview
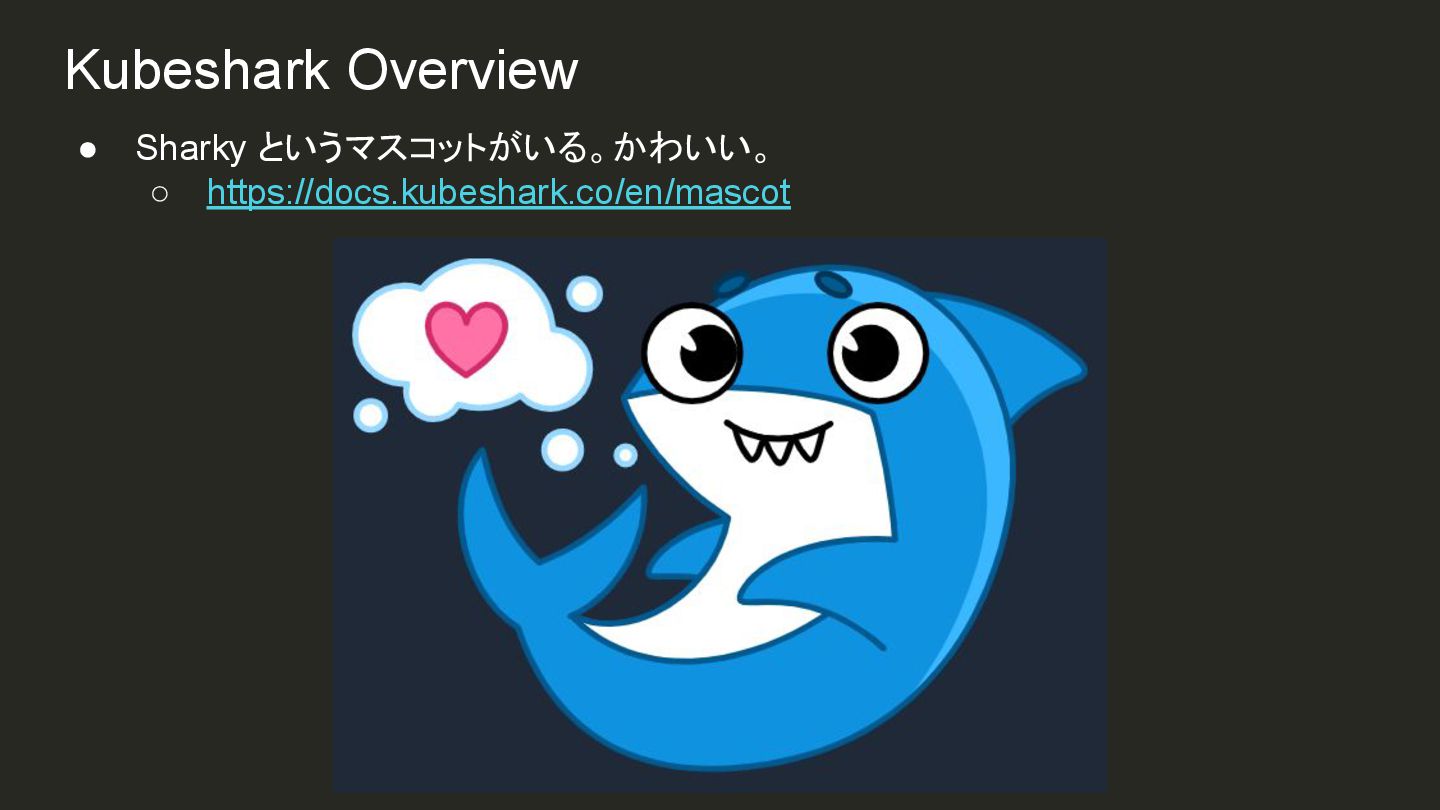
• Sharky というマスコットがいる。かわいい。 ◦ https://docs.kubeshark.co/en/mascot Kubeshark Overview
Install
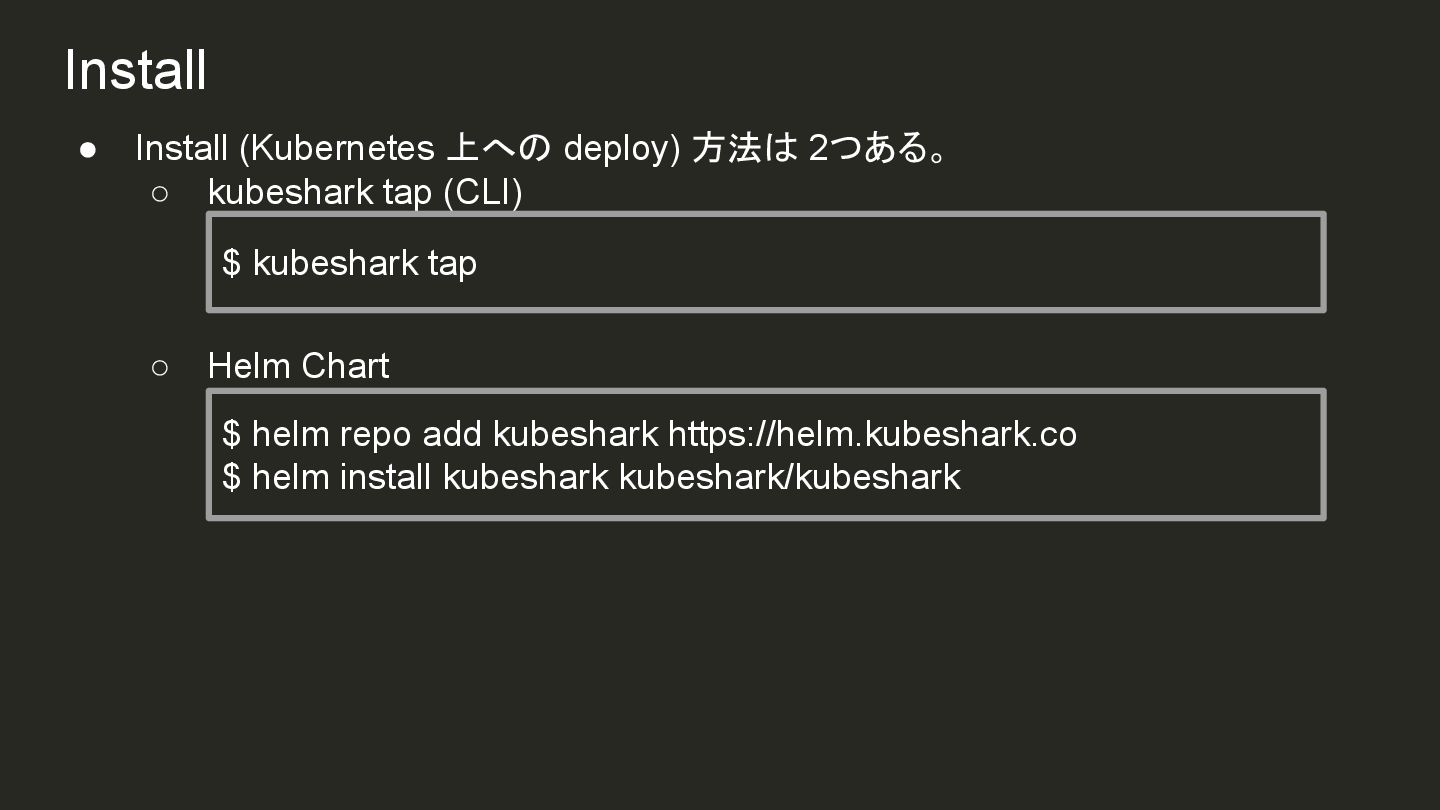
Install • Install (Kubernetes 上への deploy) 方法は 2つある。 ◦ kubeshark
tap (CLI) ◦ Helm Chart $ kubeshark tap $ helm repo add kubeshark https://helm.kubeshark.co $ helm install kubeshark kubeshark/kubeshark
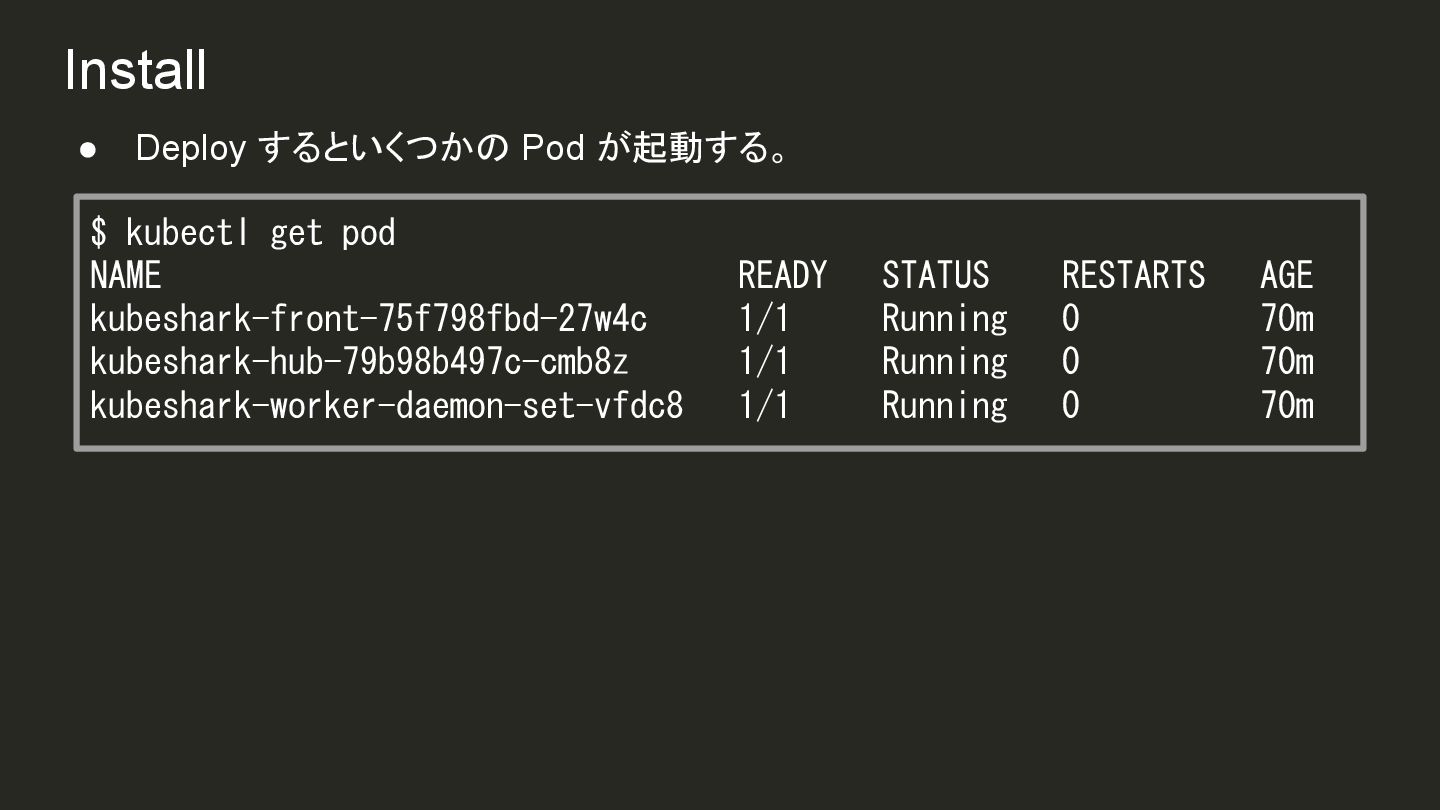
Install • Deploy するといくつかの Pod が起動する。 $ kubectl get pod
NAME READY STATUS RESTARTS AGE kubeshark-front-75f798fbd-27w4c 1/1 Running 0 70m kubeshark-hub-79b98b497c-cmb8z 1/1 Running 0 70m kubeshark-worker-daemon-set-vfdc8 1/1 Running 0 70m
Demo
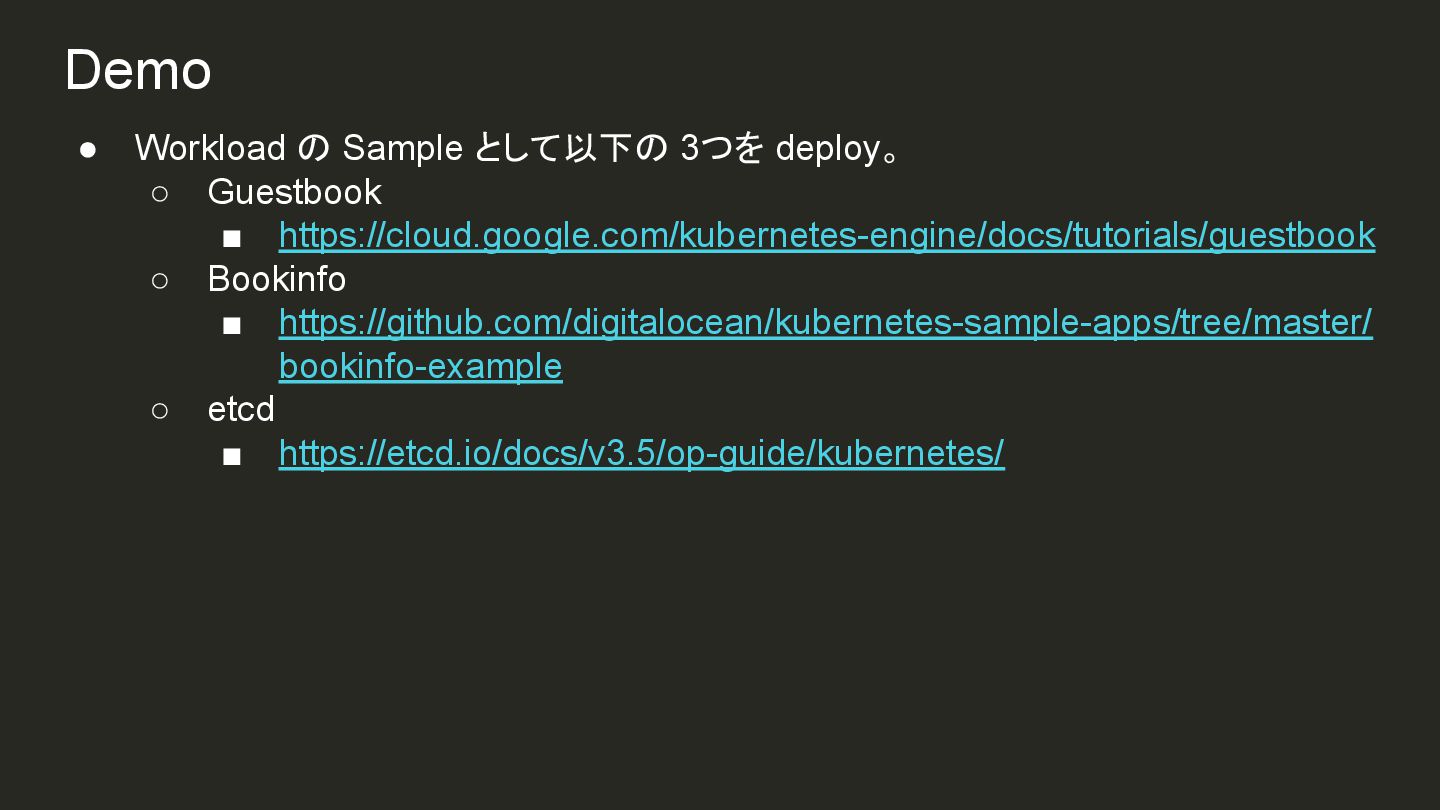
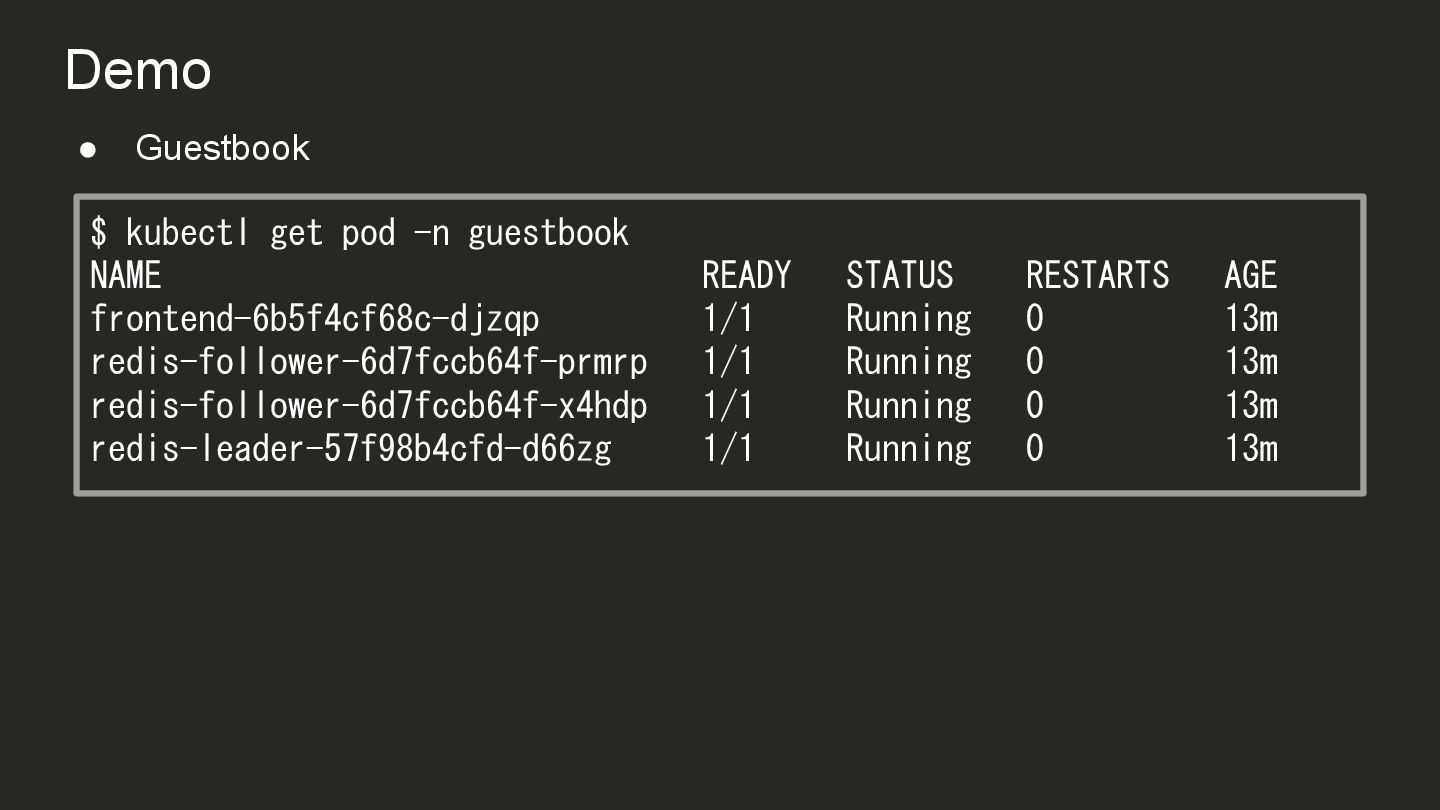
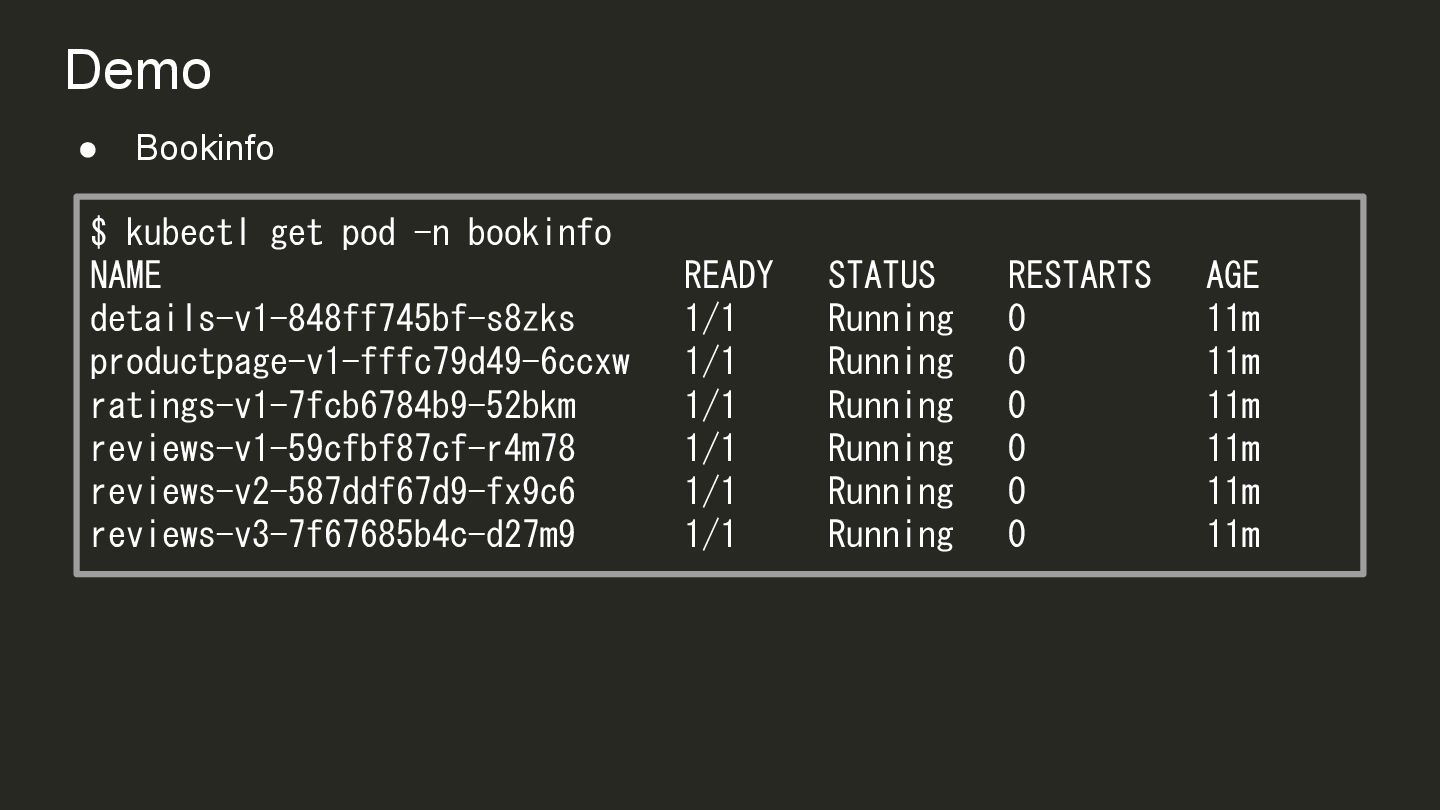
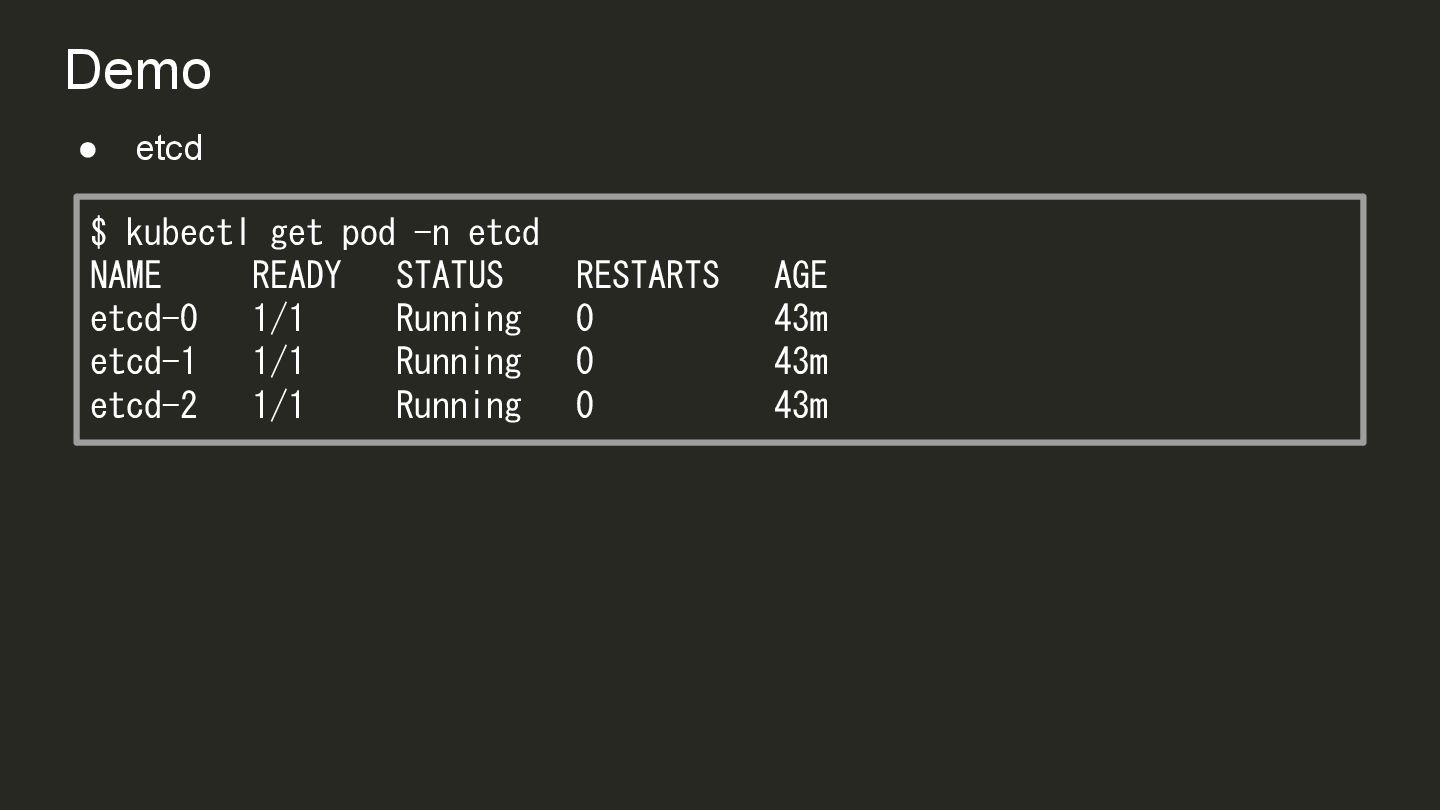
Demo • Workload の Sample として以下の 3つを deploy。 ◦ Guestbook
▪ https://cloud.google.com/kubernetes-engine/docs/tutorials/guestbook ◦ Bookinfo ▪ https://github.com/digitalocean/kubernetes-sample-apps/tree/master/ bookinfo-example ◦ etcd ▪ https://etcd.io/docs/v3.5/op-guide/kubernetes/
Demo • Guestbook $ kubectl get pod -n guestbook NAME
READY STATUS RESTARTS AGE frontend-6b5f4cf68c-djzqp 1/1 Running 0 13m redis-follower-6d7fccb64f-prmrp 1/1 Running 0 13m redis-follower-6d7fccb64f-x4hdp 1/1 Running 0 13m redis-leader-57f98b4cfd-d66zg 1/1 Running 0 13m
Demo • Bookinfo $ kubectl get pod -n bookinfo NAME
READY STATUS RESTARTS AGE details-v1-848ff745bf-s8zks 1/1 Running 0 11m productpage-v1-fffc79d49-6ccxw 1/1 Running 0 11m ratings-v1-7fcb6784b9-52bkm 1/1 Running 0 11m reviews-v1-59cfbf87cf-r4m78 1/1 Running 0 11m reviews-v2-587ddf67d9-fx9c6 1/1 Running 0 11m reviews-v3-7f67685b4c-d27m9 1/1 Running 0 11m
Demo • etcd $ kubectl get pod -n etcd NAME
READY STATUS RESTARTS AGE etcd-0 1/1 Running 0 43m etcd-1 1/1 Running 0 43m etcd-2 1/1 Running 0 43m
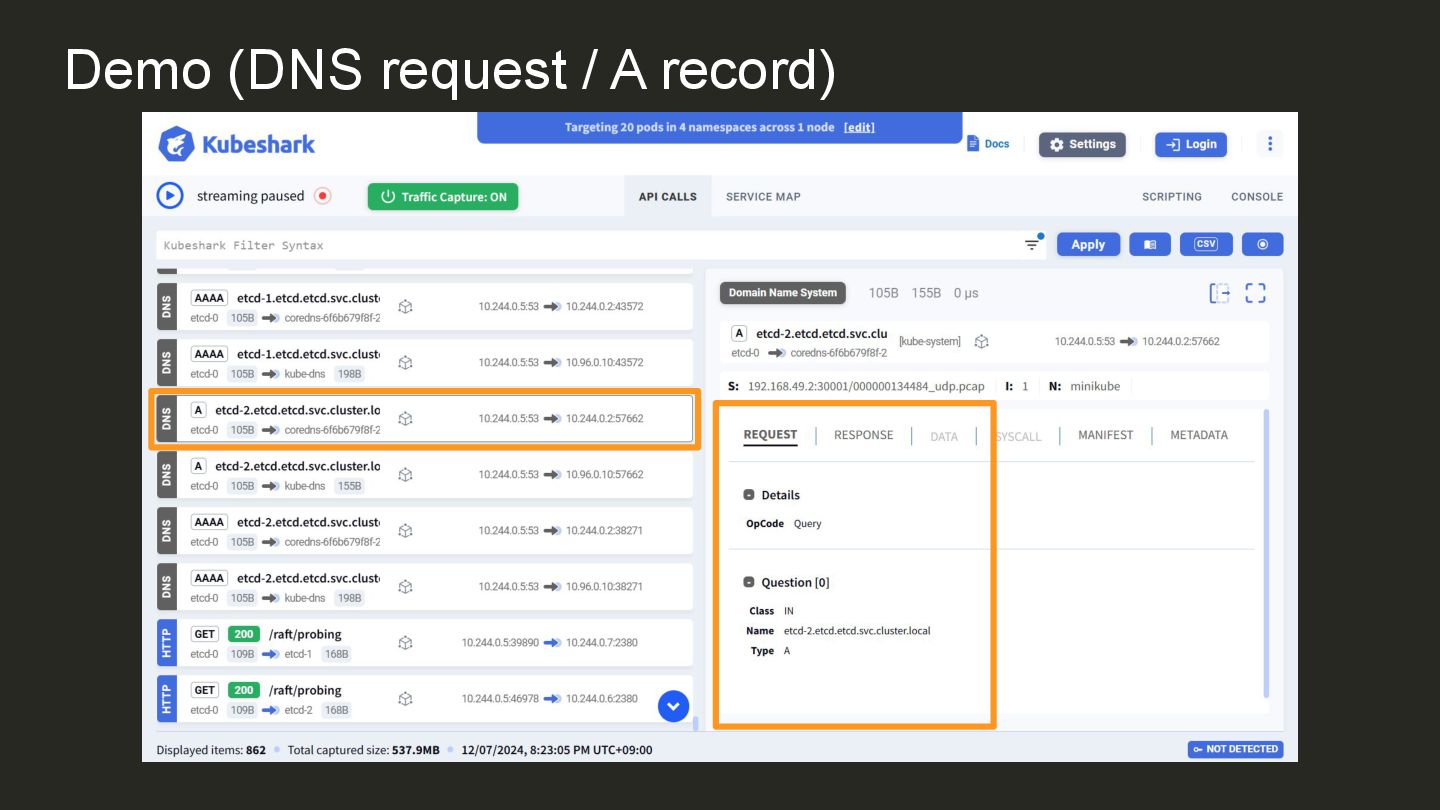
Demo (DNS request / A record)
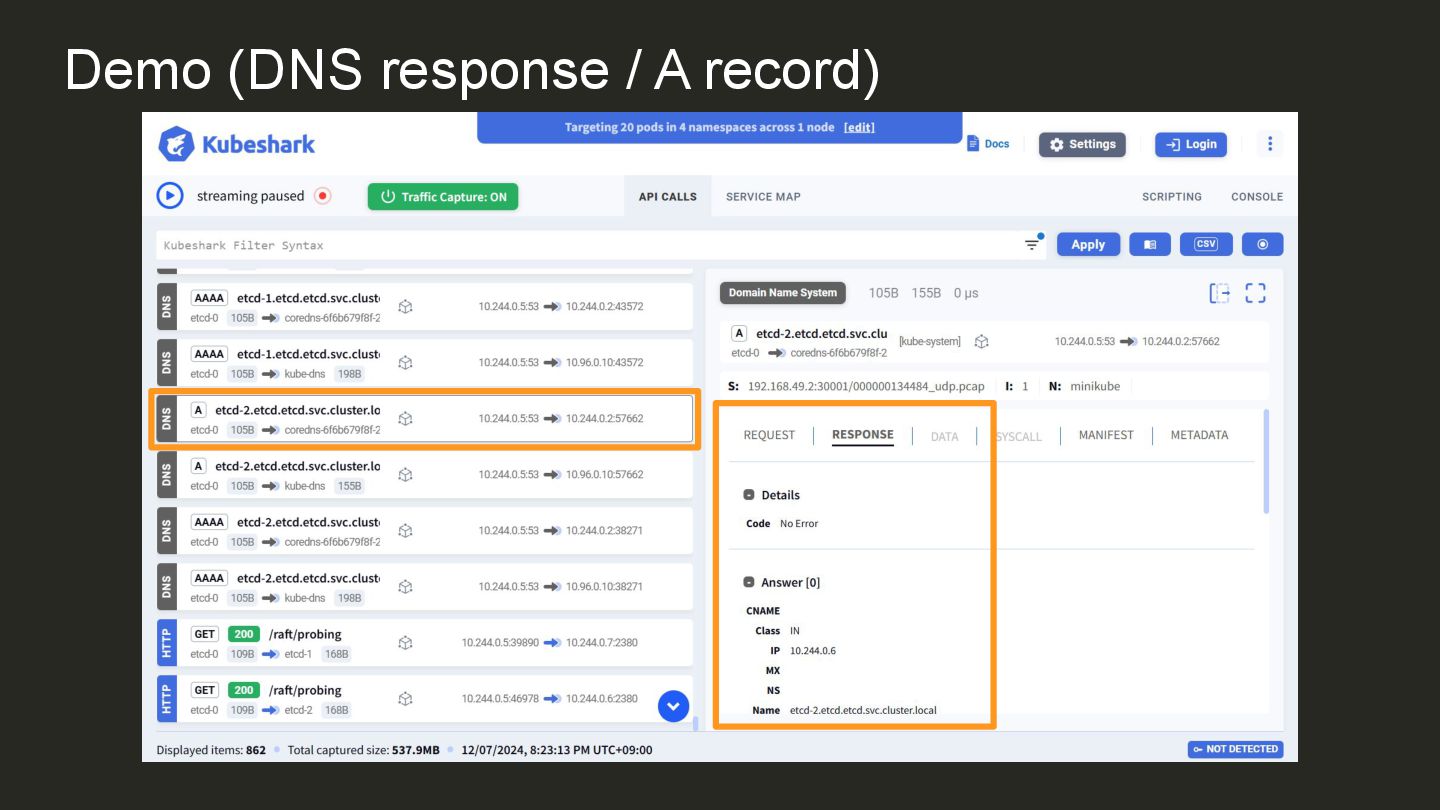
Demo (DNS response / A record)
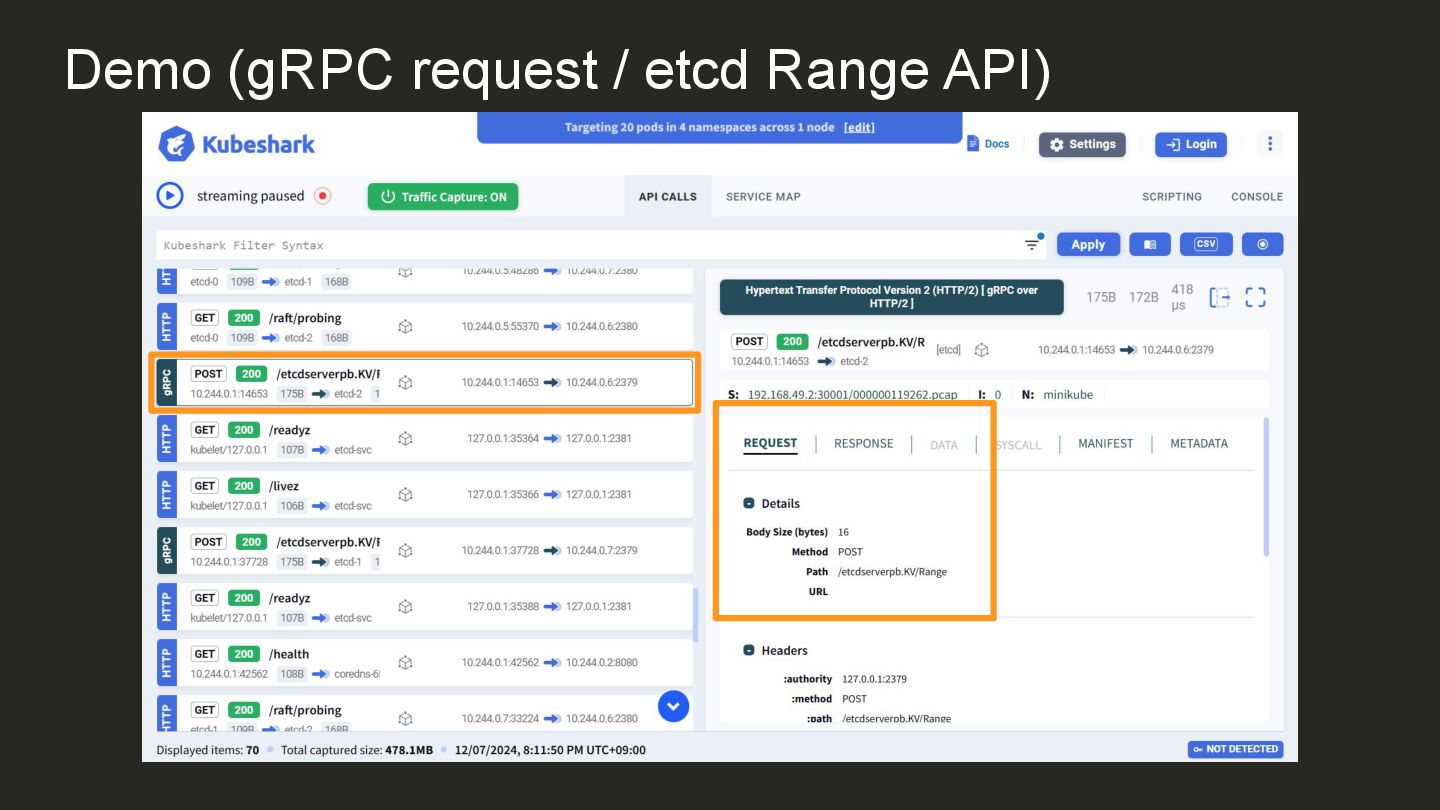
Demo (gRPC request / etcd Range API)
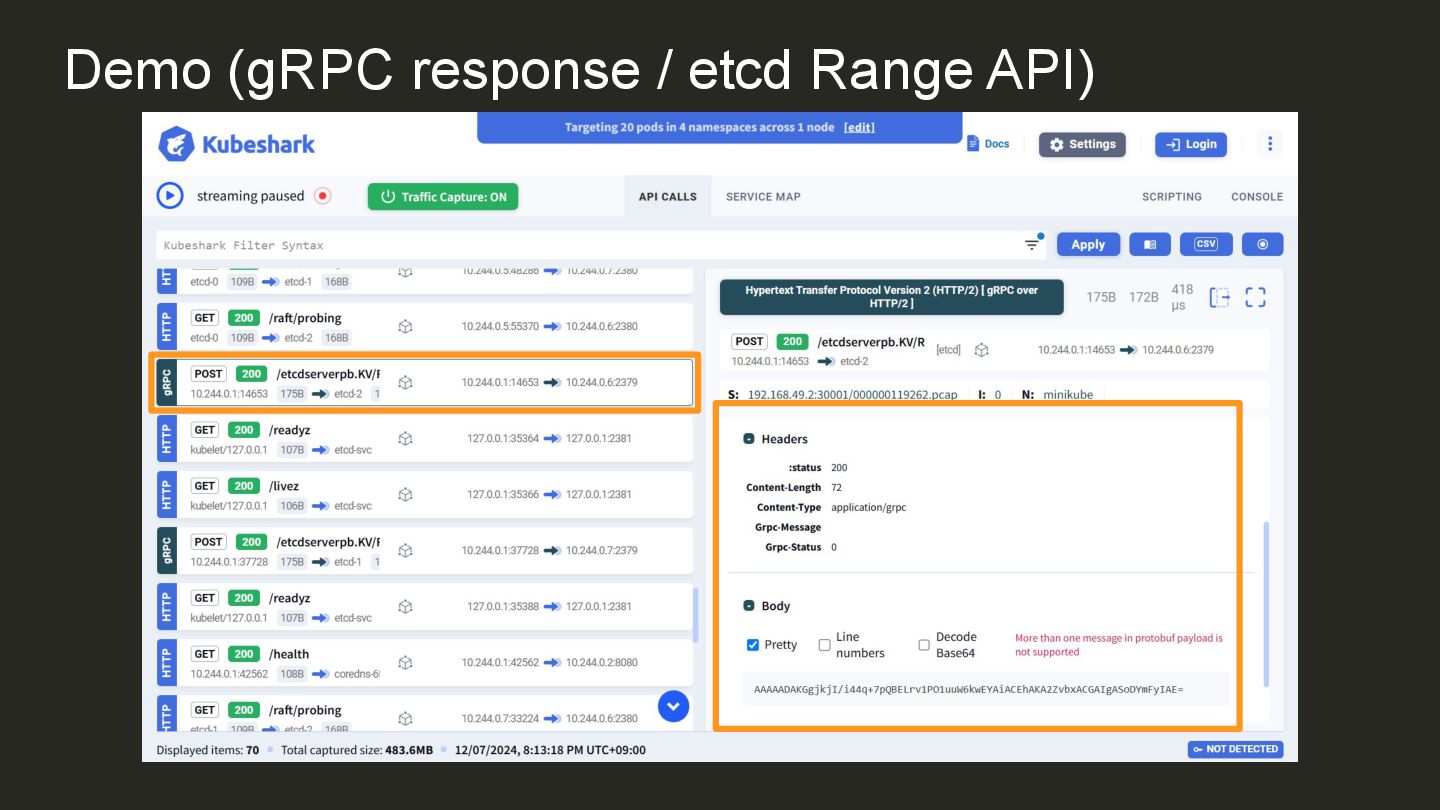
Demo (gRPC response / etcd Range API)
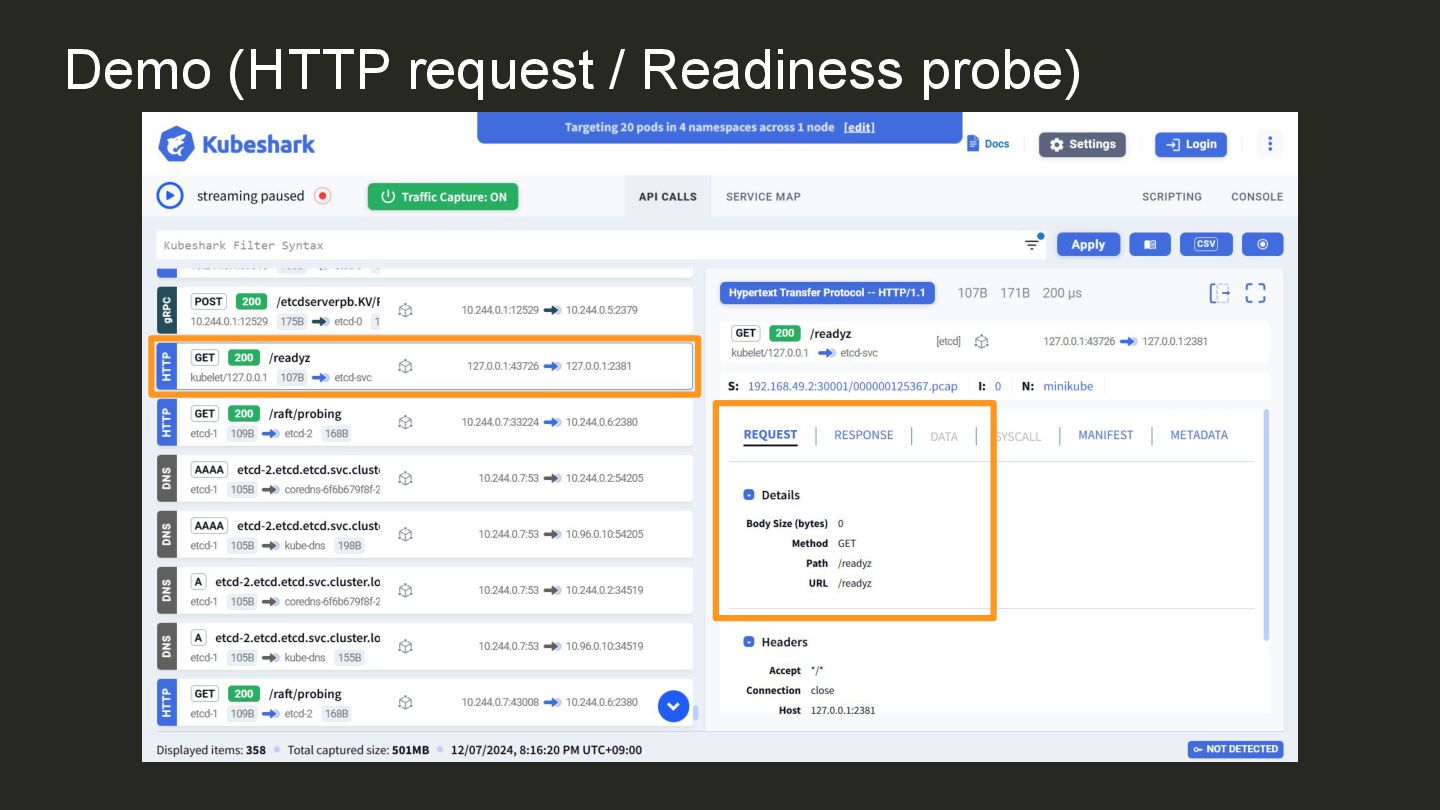
Demo (HTTP request / Readiness probe)
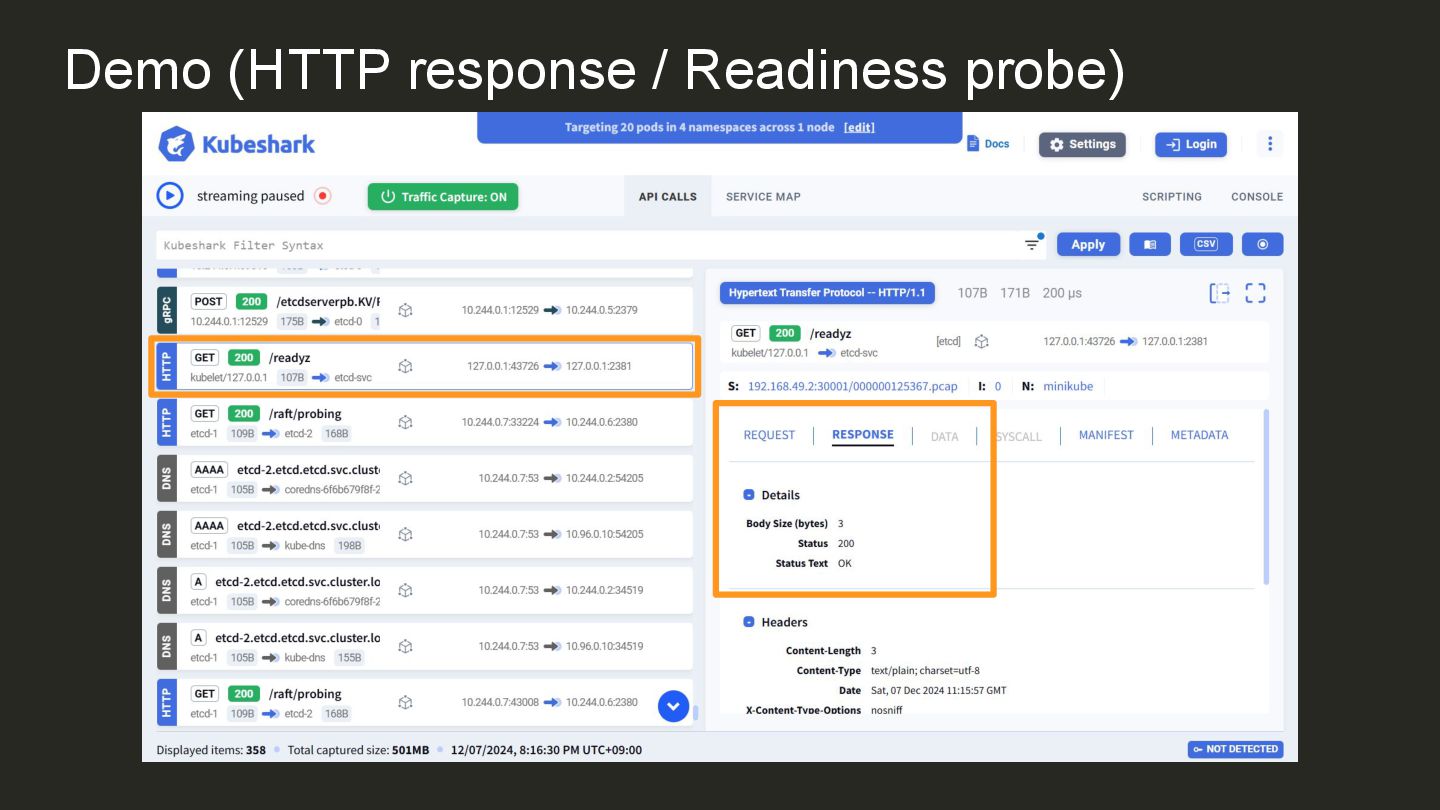
Demo (HTTP response / Readiness probe)
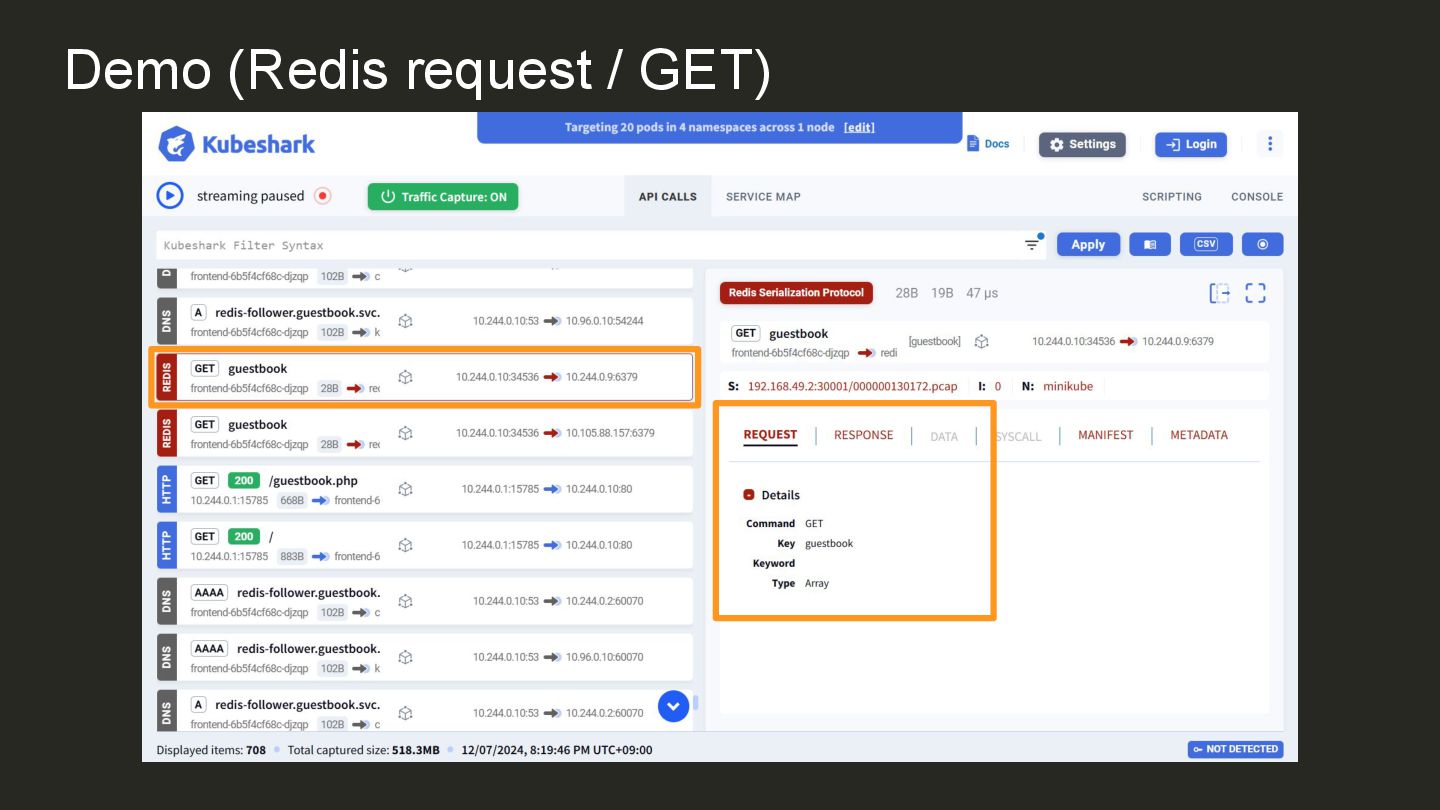
Demo (Redis request / GET)
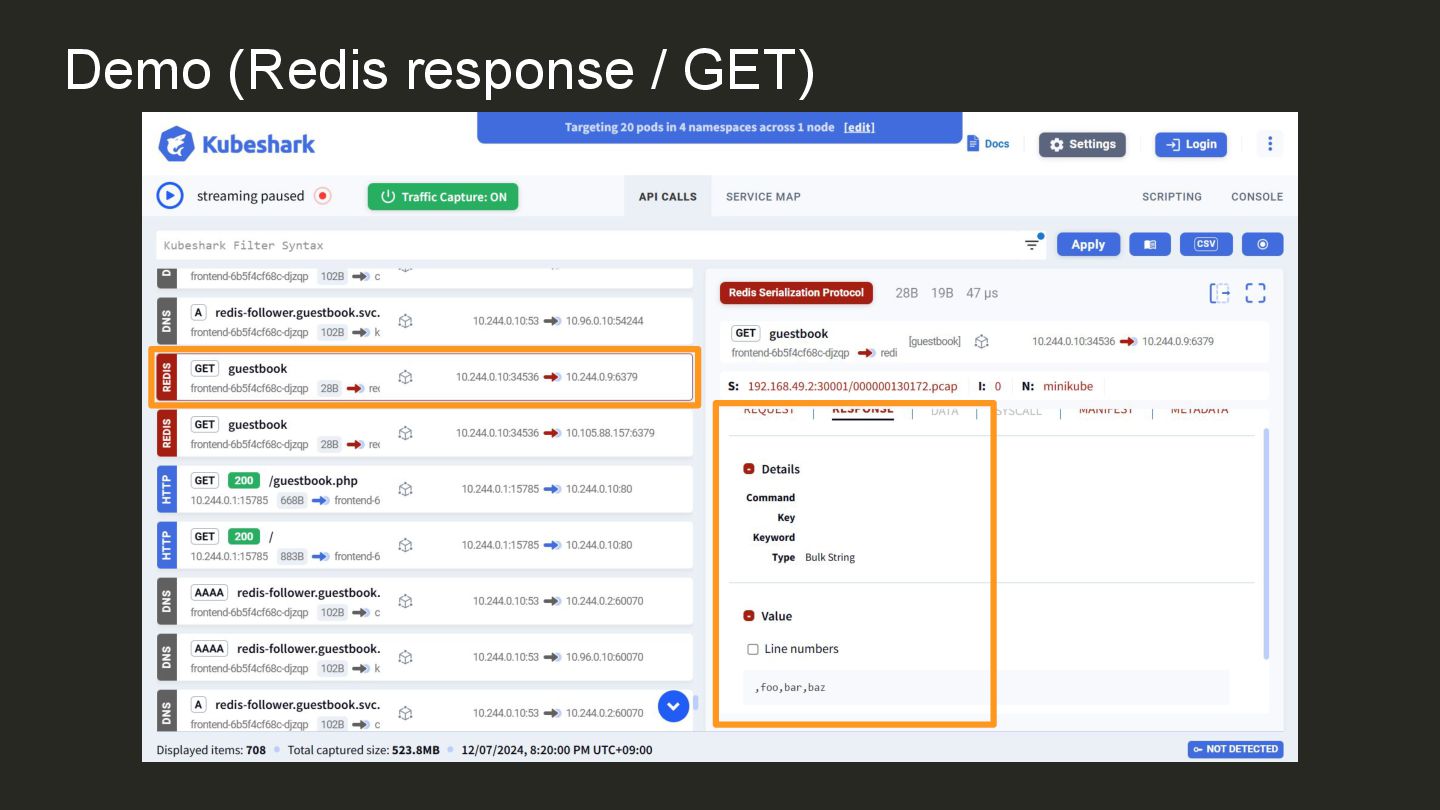
Demo (Redis response / GET)
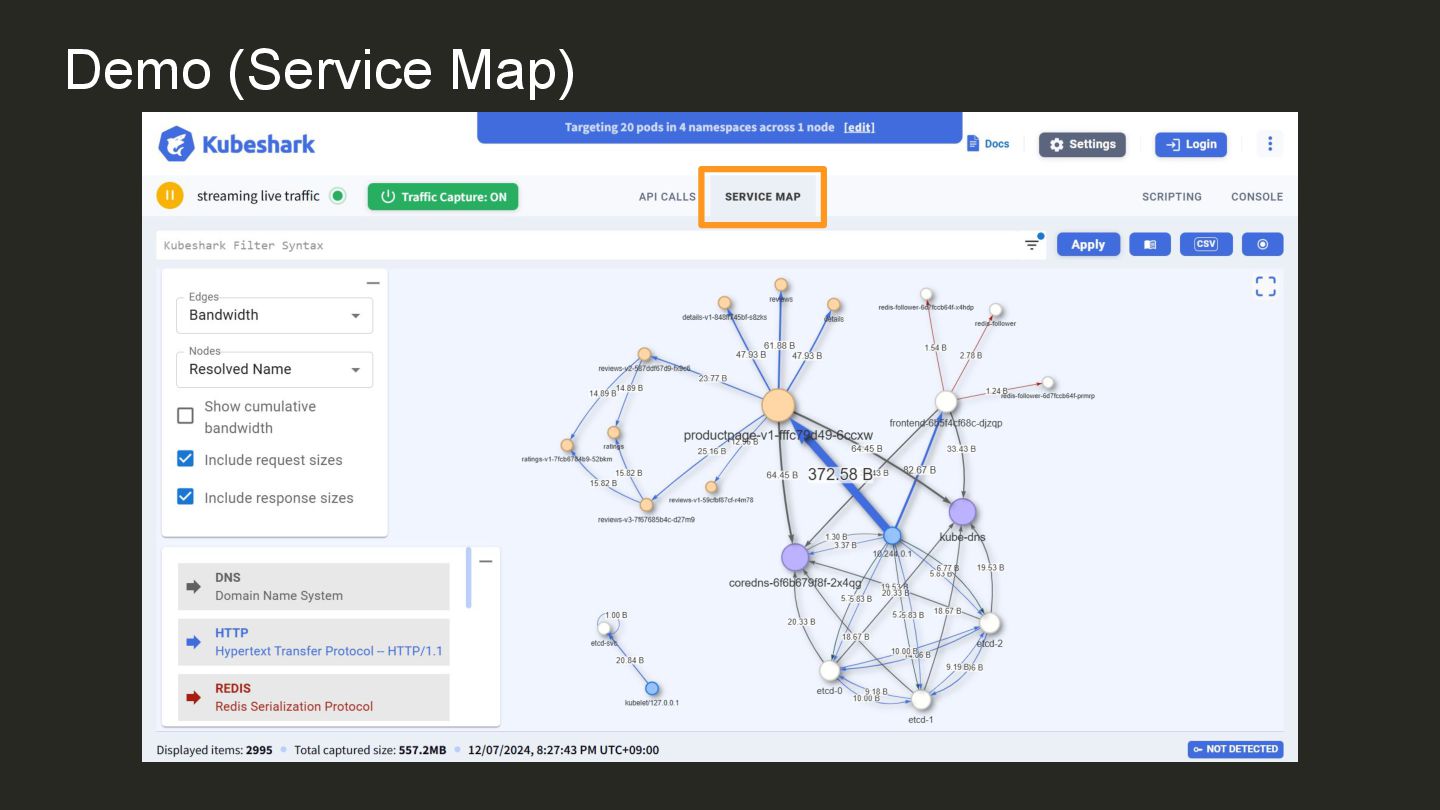
Demo (Service Map)
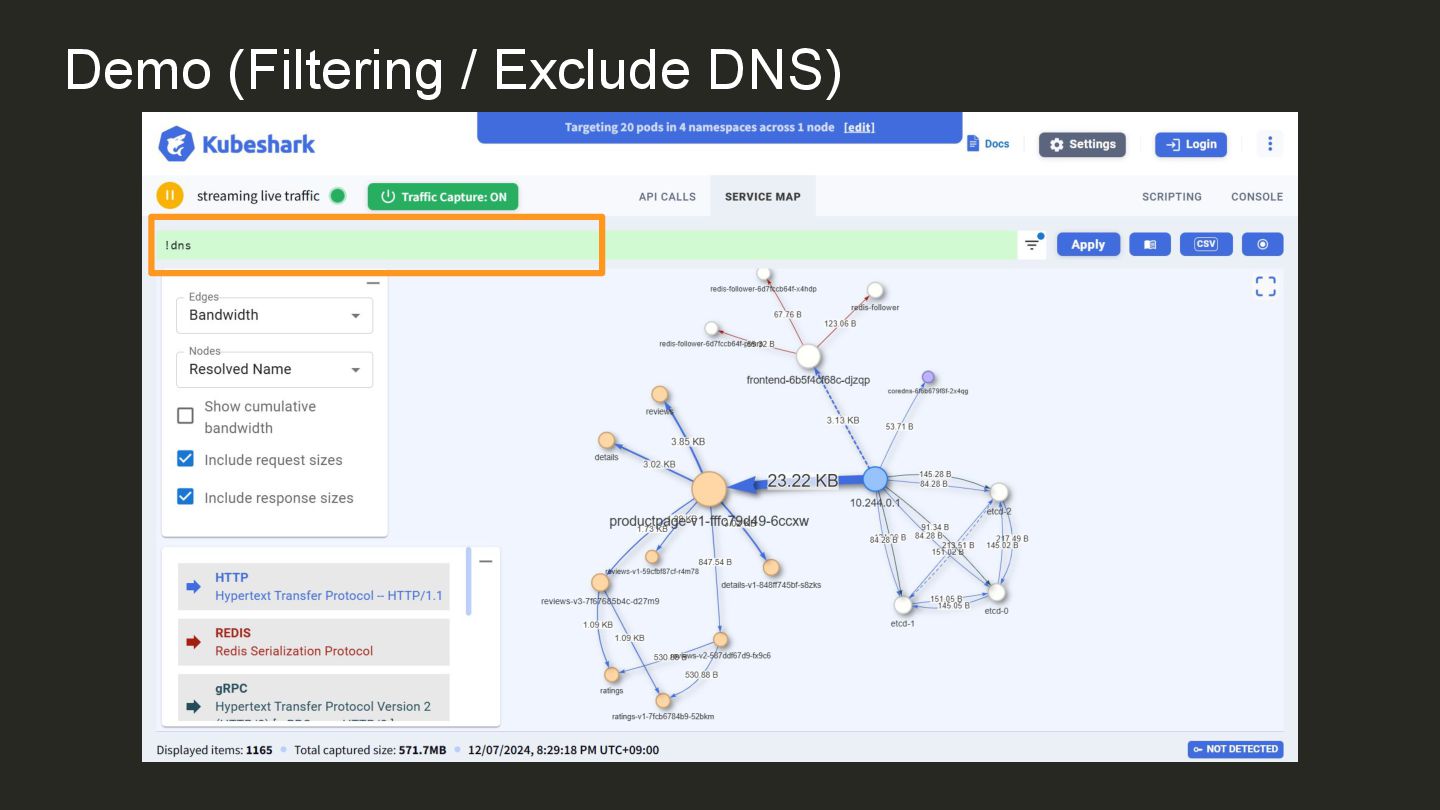
Demo (Filtering / Exclude DNS)
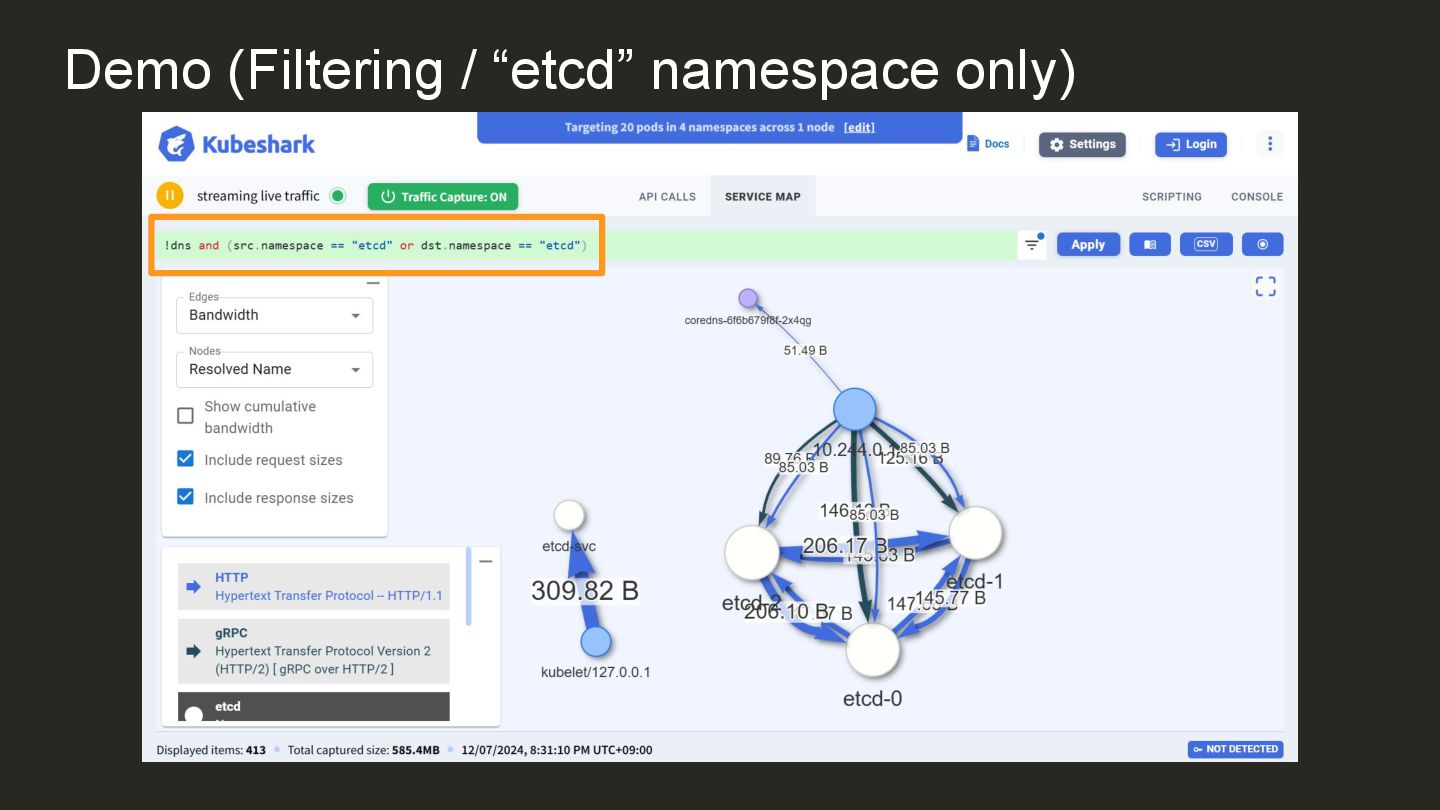
Demo (Filtering / “etcd” namespace only)
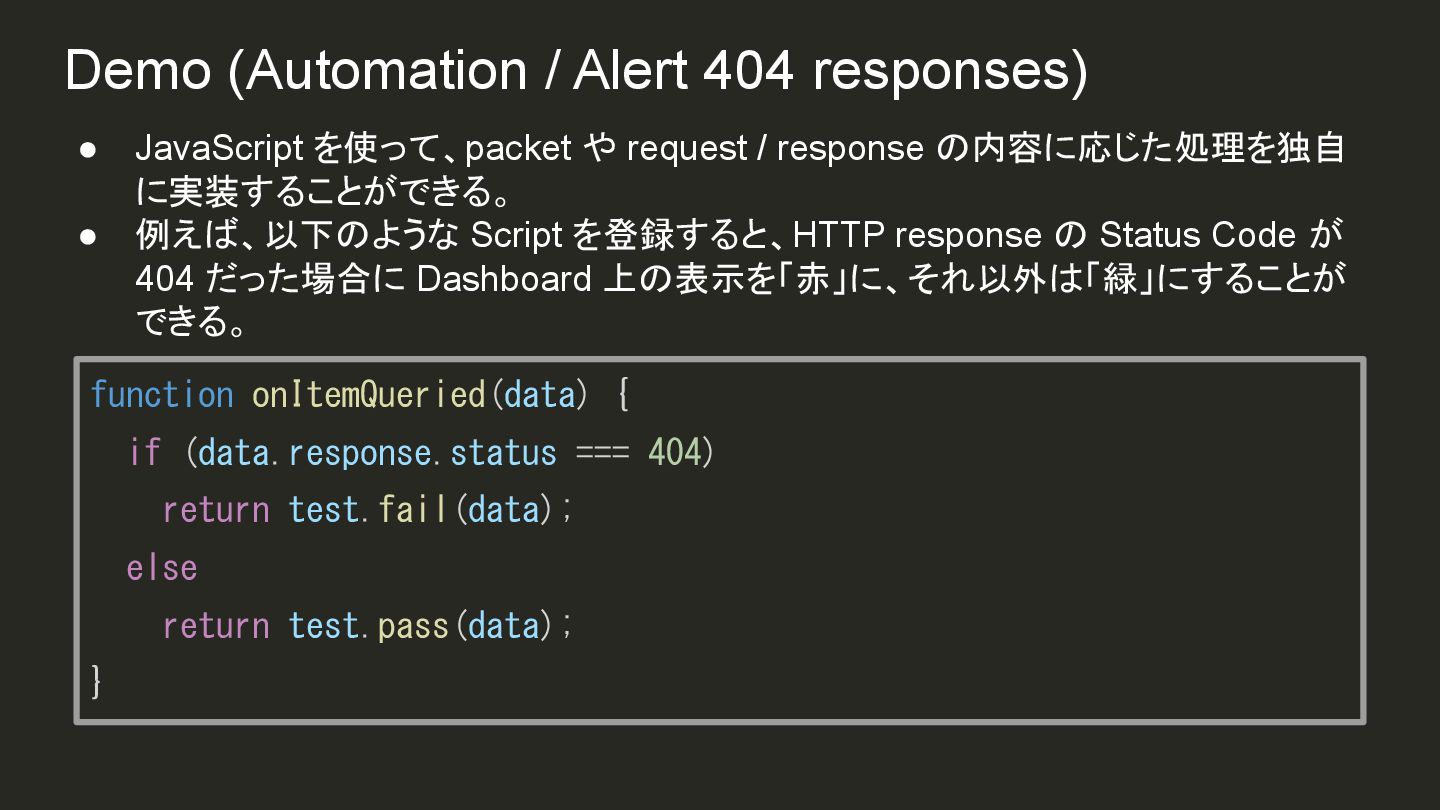
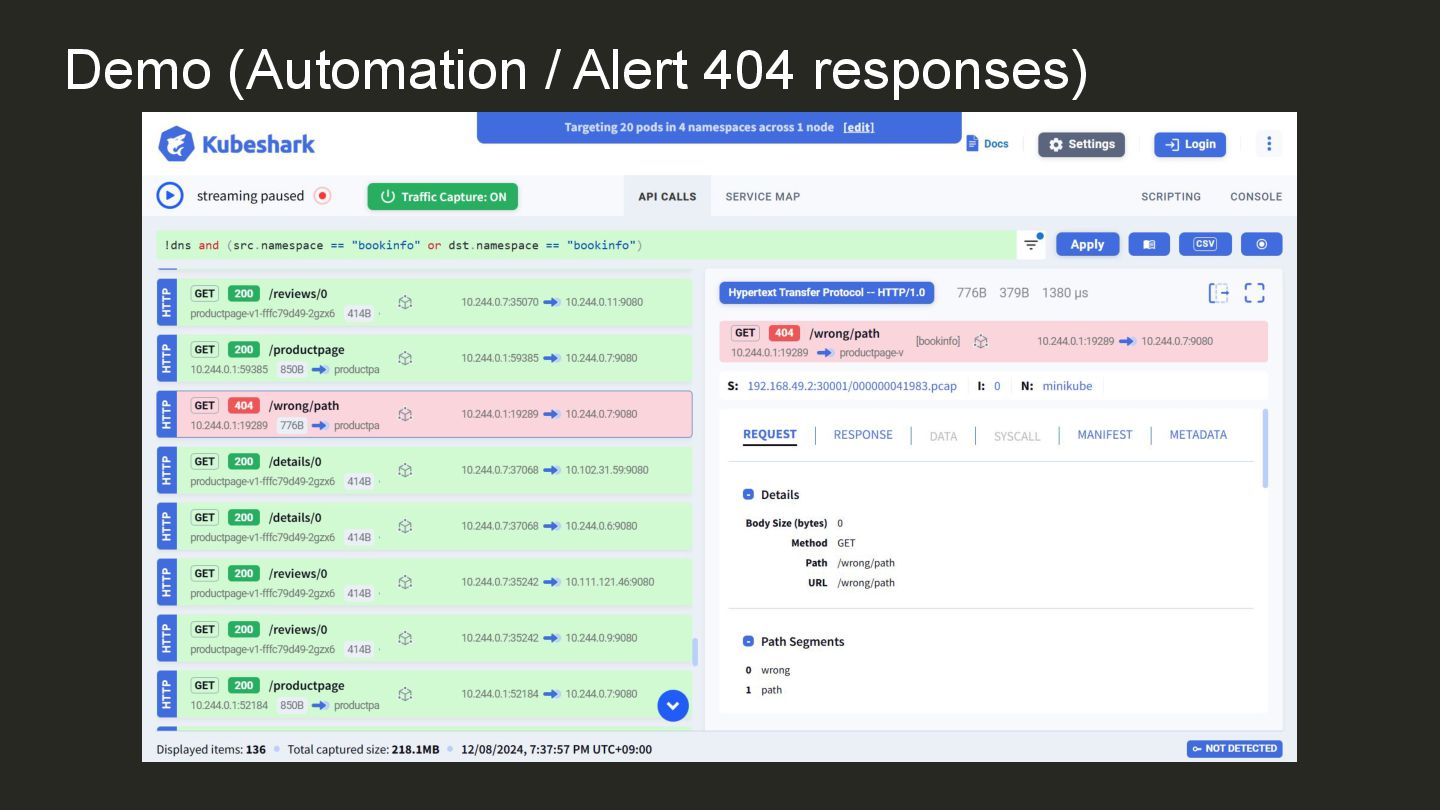
Demo (Automation / Alert 404 responses) • JavaScript を使って、packet や
request / response の内容に応じた処理を独自 に実装することができる。 • 例えば、以下のような Script を登録すると、HTTP response の Status Code が 404 だった場合に Dashboard 上の表示を「赤」に、それ以外は「緑」にすることが できる。 function onItemQueried(data) { if (data.response.status === 404) return test.fail(data); else return test.pass(data); }
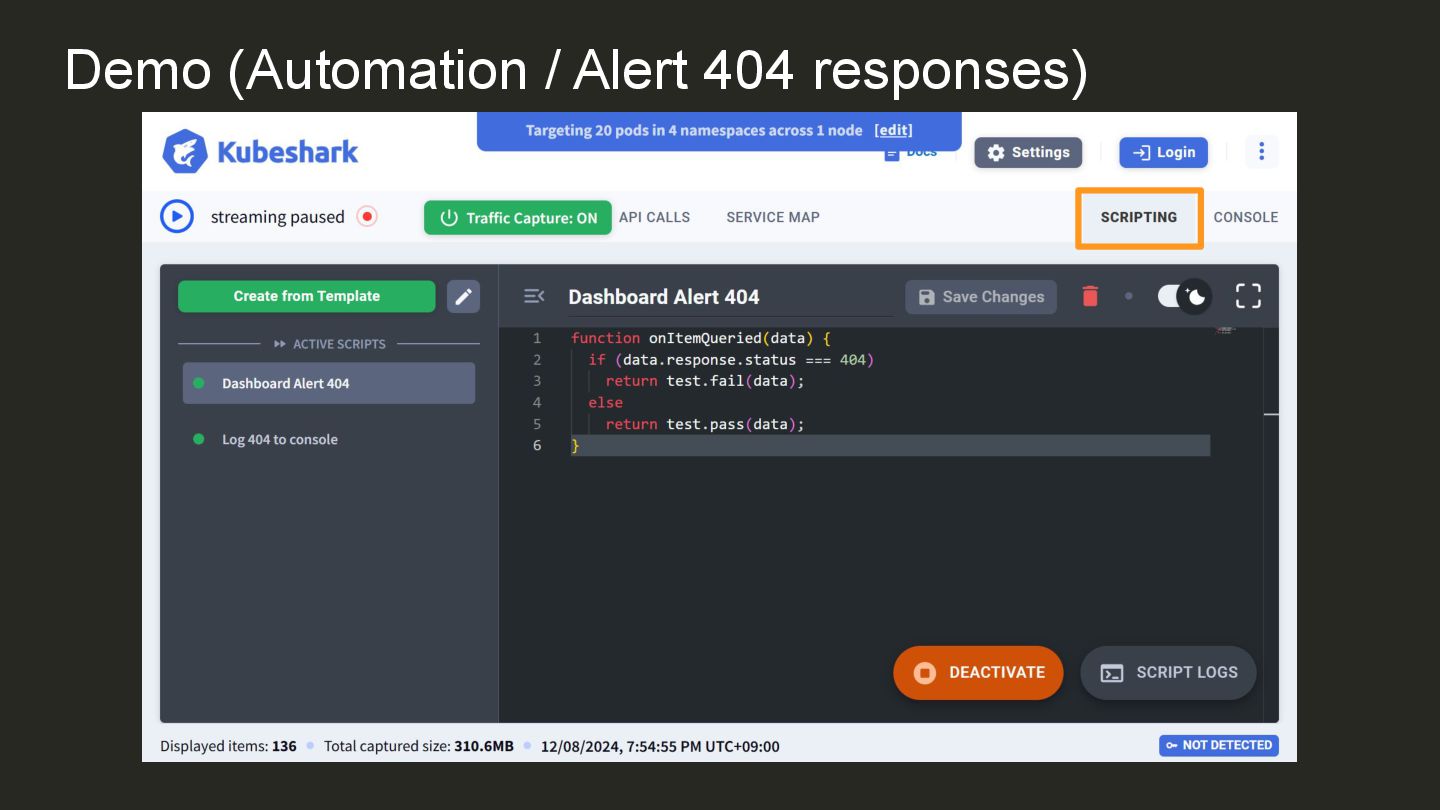
Demo (Automation / Alert 404 responses)
Demo (Automation / Alert 404 responses)
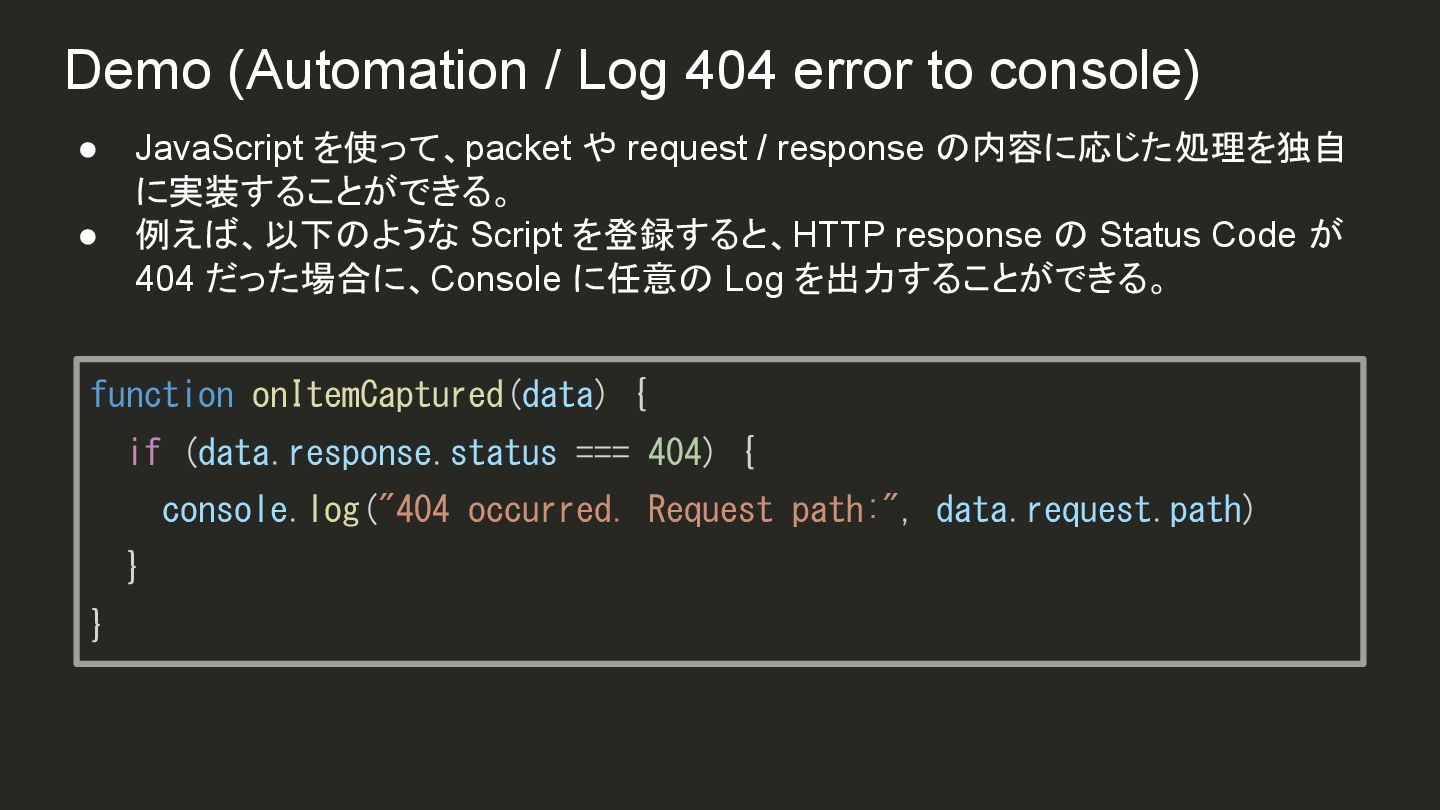
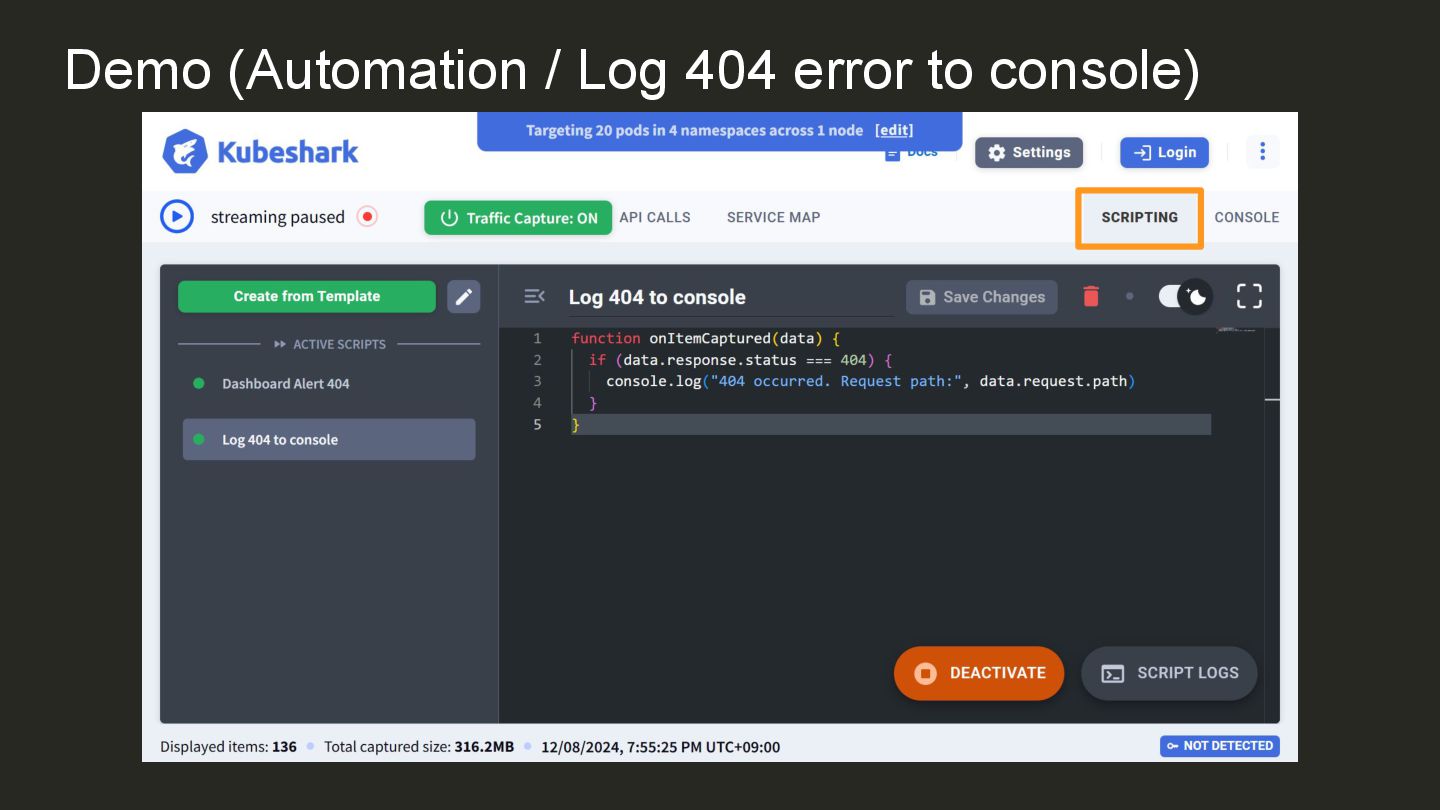
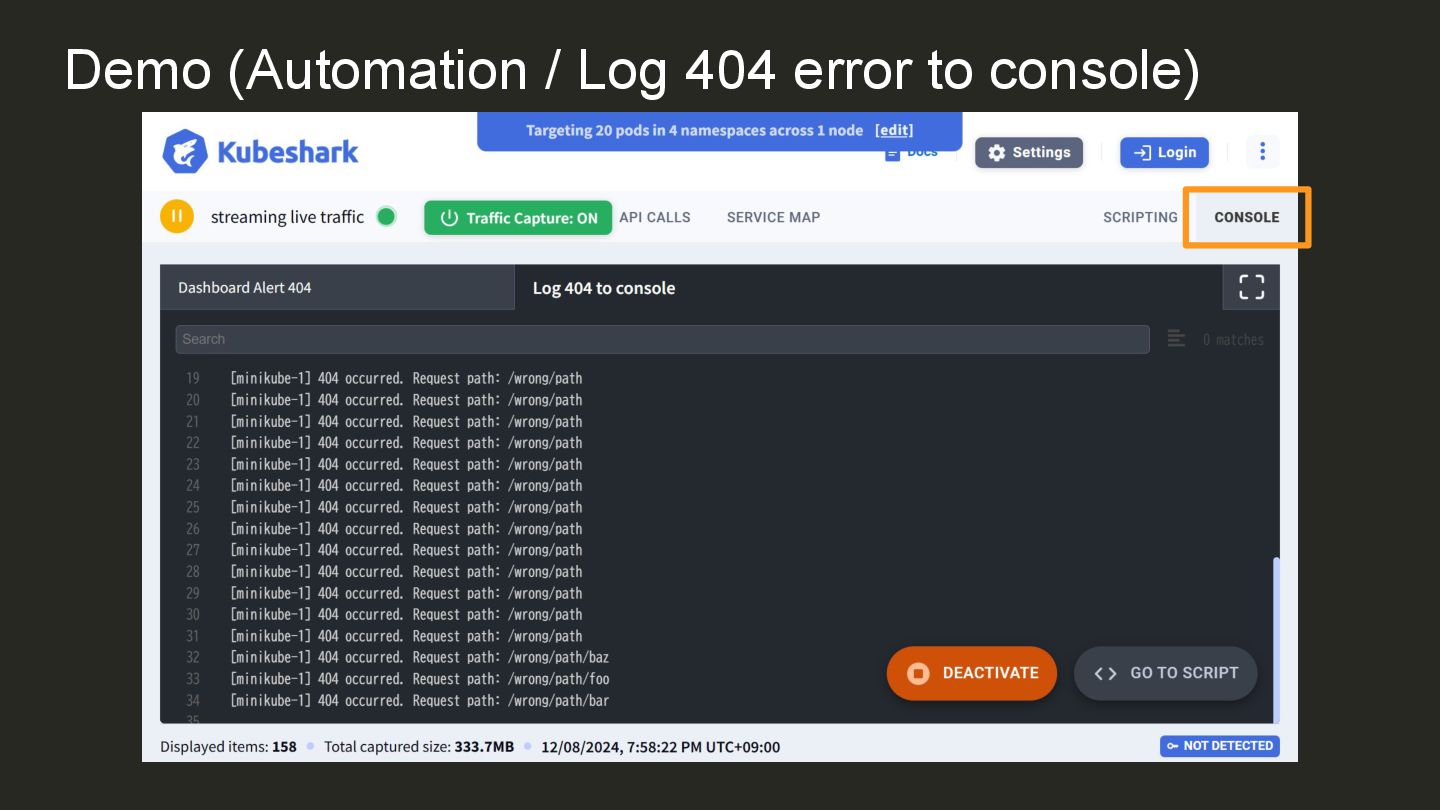
Demo (Automation / Log 404 error to console) • JavaScript
を使って、packet や request / response の内容に応じた処理を独自 に実装することができる。 • 例えば、以下のような Script を登録すると、HTTP response の Status Code が 404 だった場合に、Console に任意の Log を出力することができる。 function onItemCaptured(data) { if (data.response.status === 404) { console.log("404 occurred. Request path:", data.request.path) } }
Demo (Automation / Log 404 error to console)
Demo (Automation / Log 404 error to console)
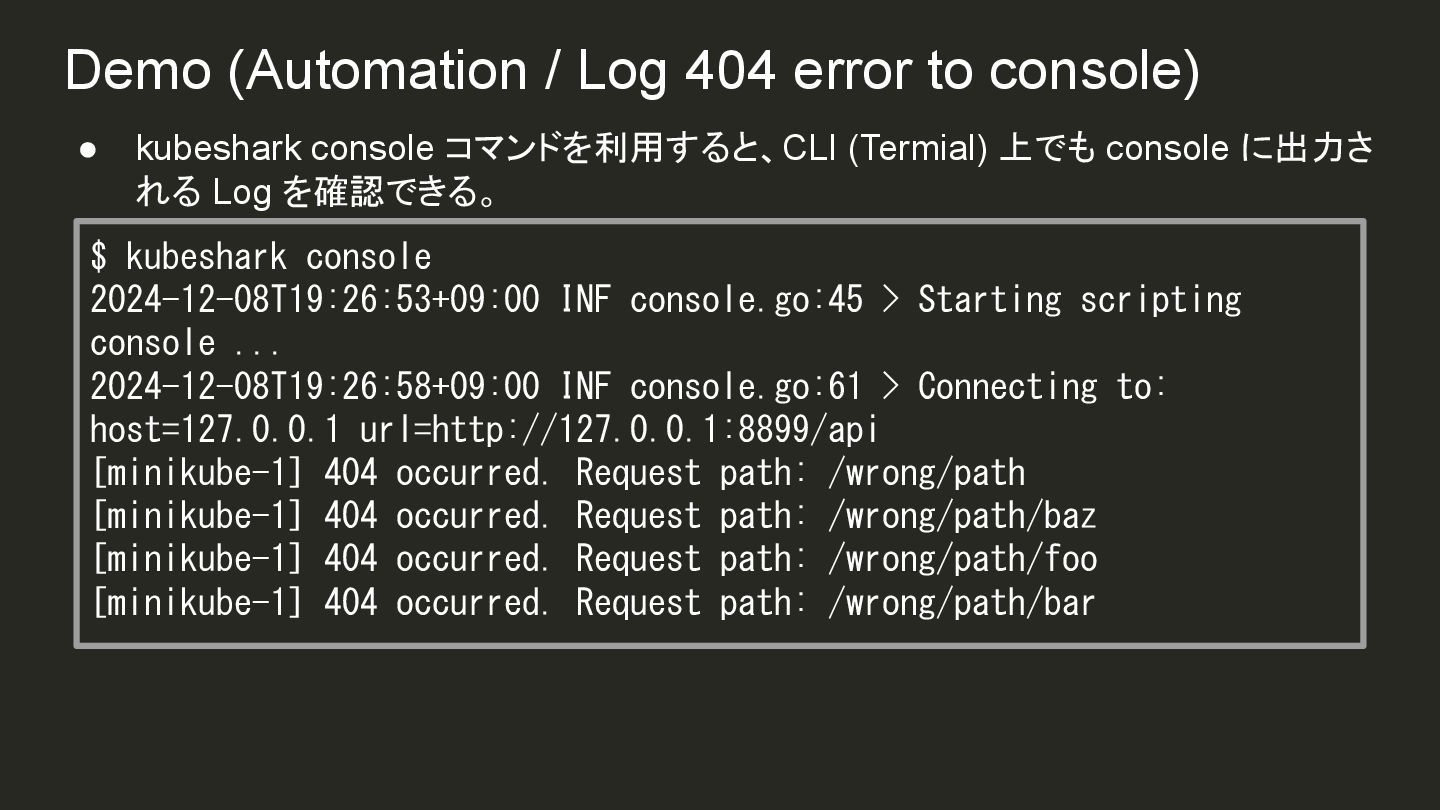
Demo (Automation / Log 404 error to console) • kubeshark
console コマンドを利用すると、CLI (Termial) 上でも console に出力さ れる Log を確認できる。 $ kubeshark console 2024-12-08T19:26:53+09:00 INF console.go:45 > Starting scripting console ... 2024-12-08T19:26:58+09:00 INF console.go:61 > Connecting to: host=127.0.0.1 url=http://127.0.0.1:8899/api [minikube-1] 404 occurred. Request path: /wrong/path [minikube-1] 404 occurred. Request path: /wrong/path/baz [minikube-1] 404 occurred. Request path: /wrong/path/foo [minikube-1] 404 occurred. Request path: /wrong/path/bar
Other Features
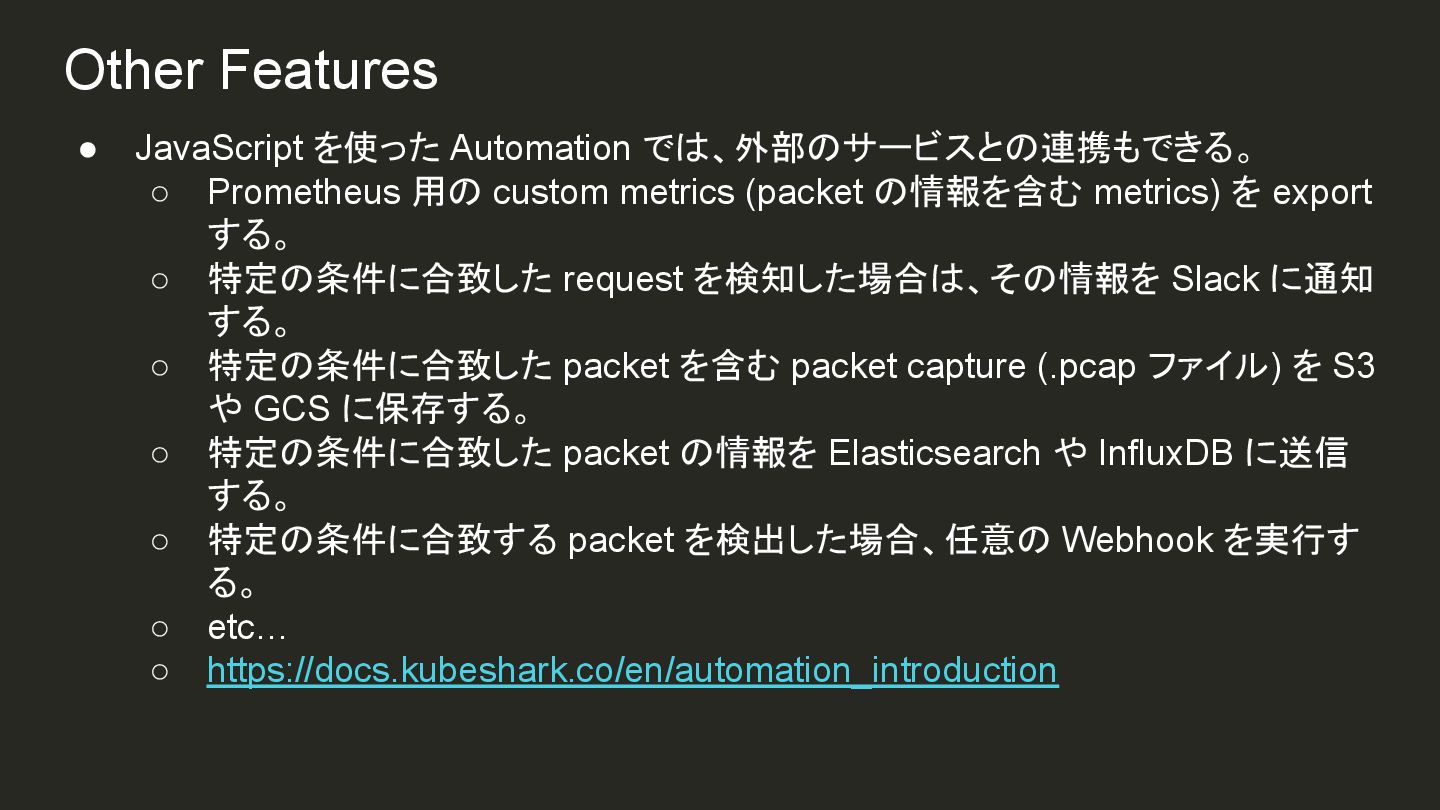
Other Features • JavaScript を使った Automation では、外部のサービスとの連携もできる。 ◦ Prometheus 用の
custom metrics (packet の情報を含む metrics) を export する。 ◦ 特定の条件に合致した request を検知した場合は、その情報を Slack に通知 する。 ◦ 特定の条件に合致した packet を含む packet capture (.pcap ファイル) を S3 や GCS に保存する。 ◦ 特定の条件に合致した packet の情報を Elasticsearch や InfluxDB に送信 する。 ◦ 特定の条件に合致する packet を検出した場合、任意の Webhook を実行す る。 ◦ etc… ◦ https://docs.kubeshark.co/en/automation_introduction
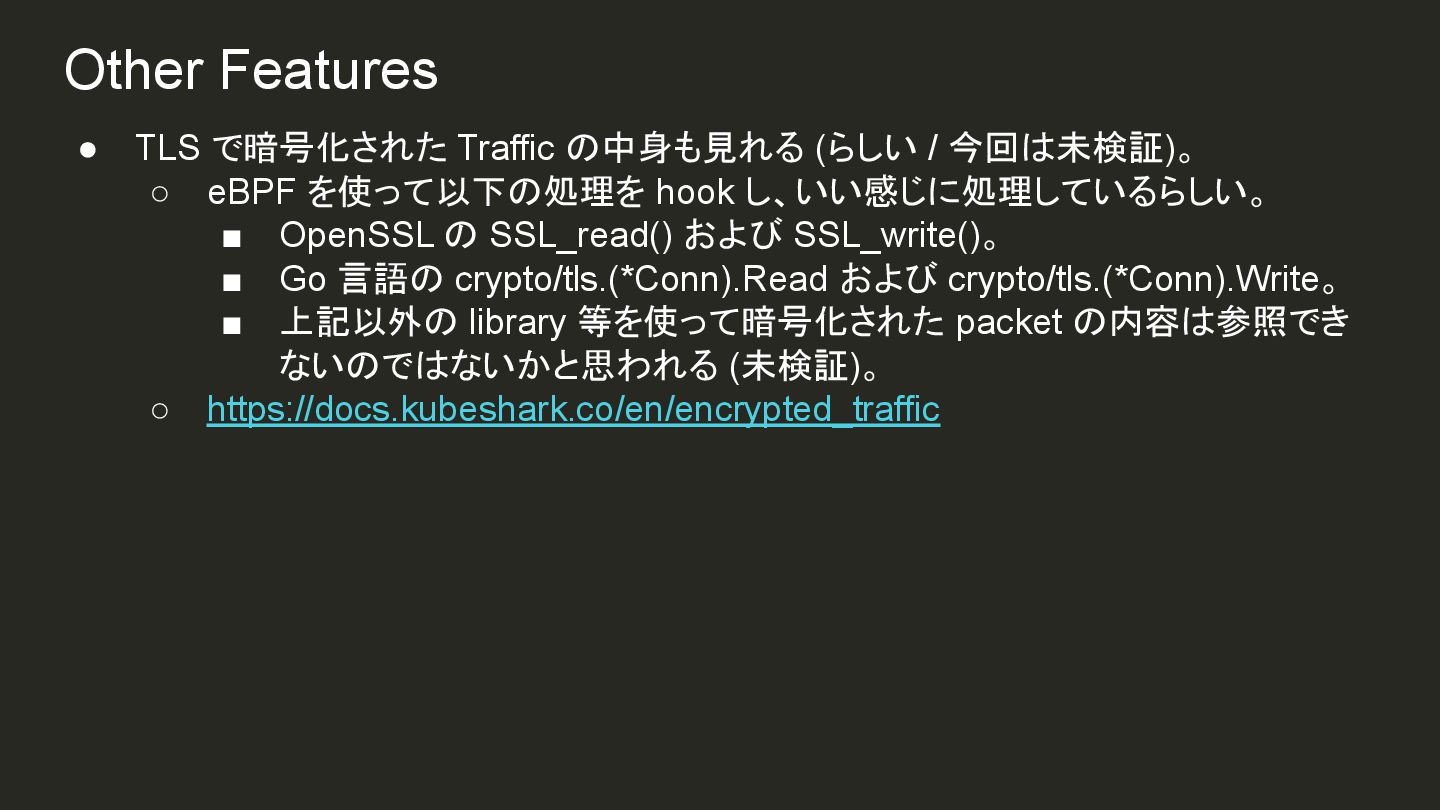
Other Features • TLS で暗号化された Traffic の中身も見れる (らしい / 今回は未検証)。
◦ eBPF を使って以下の処理を hook し、いい感じに処理しているらしい。 ▪ OpenSSL の SSL_read() および SSL_write()。 ▪ Go 言語の crypto/tls.(*Conn).Read および crypto/tls.(*Conn).Write。 ▪ 上記以外の library 等を使って暗号化された packet の内容は参照でき ないのではないかと思われる (未検証)。 ◦ https://docs.kubeshark.co/en/encrypted_traffic
まとめ
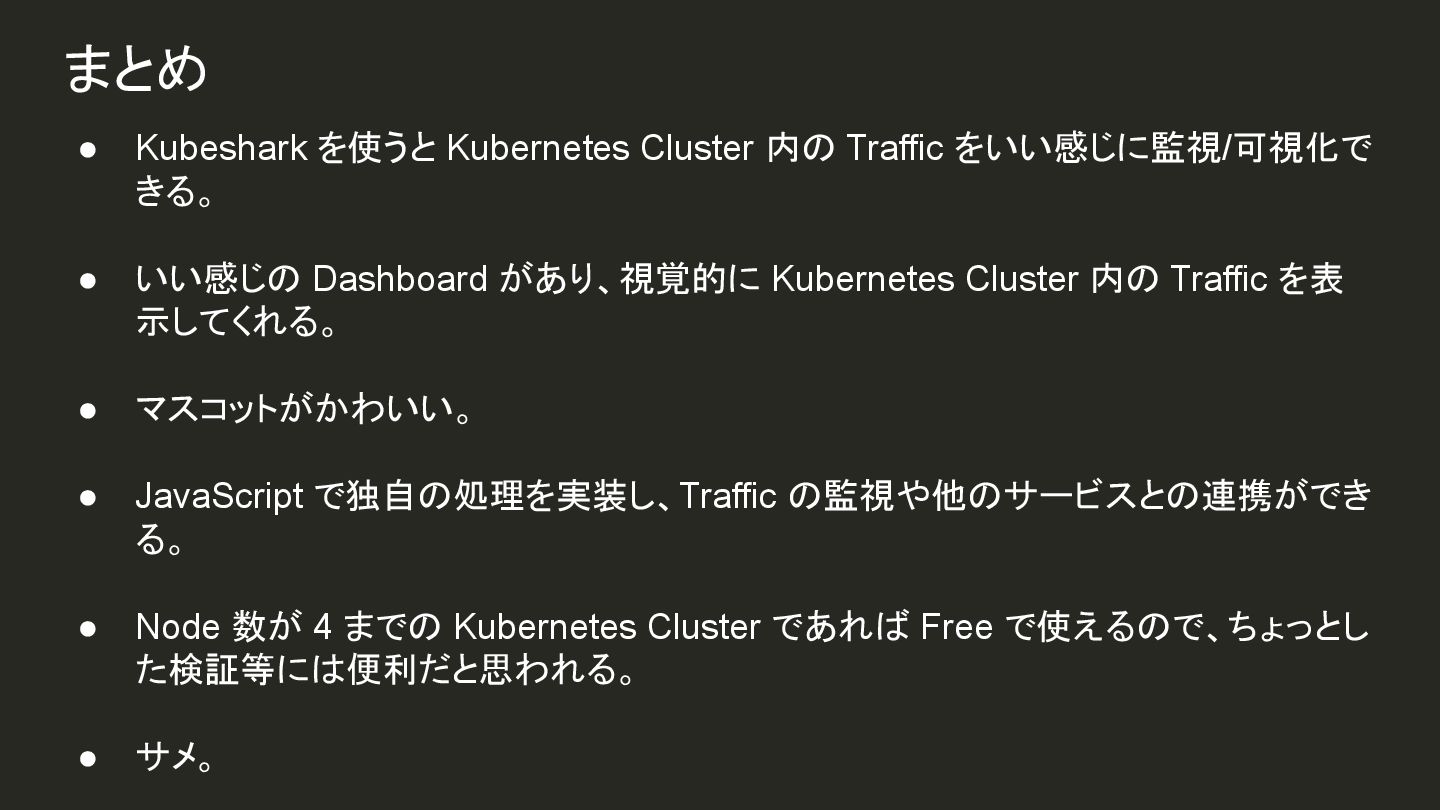
まとめ • Kubeshark を使うと Kubernetes Cluster 内の Traffic をいい感じに監視/可視化で きる。
• いい感じの Dashboard があり、視覚的に Kubernetes Cluster 内の Traffic を表 示してくれる。 • マスコットがかわいい。 • JavaScript で独自の処理を実装し、Traffic の監視や他のサービスとの連携ができ る。 • Node 数が 4 までの Kubernetes Cluster であれば Free で使えるので、ちょっとし た検証等には便利だと思われる。 • サメ。
宣伝
Database Engineering Meetup をやってます!!! https://scalar.connpass.com/ 次回は KubeDay Japan Revisit (日本語
recap) です!!!
Thank you!


 kota2and3kan
 ivry_presentationmaterials
 greenmidori
 shogo4131
 jmdc_presentation
 ueponx
 pfn
 keeg
 persolserverworks
 camiha
 y0hgi
 yuuuuuuu168
 tetsuya28
 codingconduct
 jeffersonlam
 ipullrank
 quramy
 tmiket
 swwweet
 shpigford
 inesmontani
 helmedeiros
 tapps
 jct
 maggiecrowley