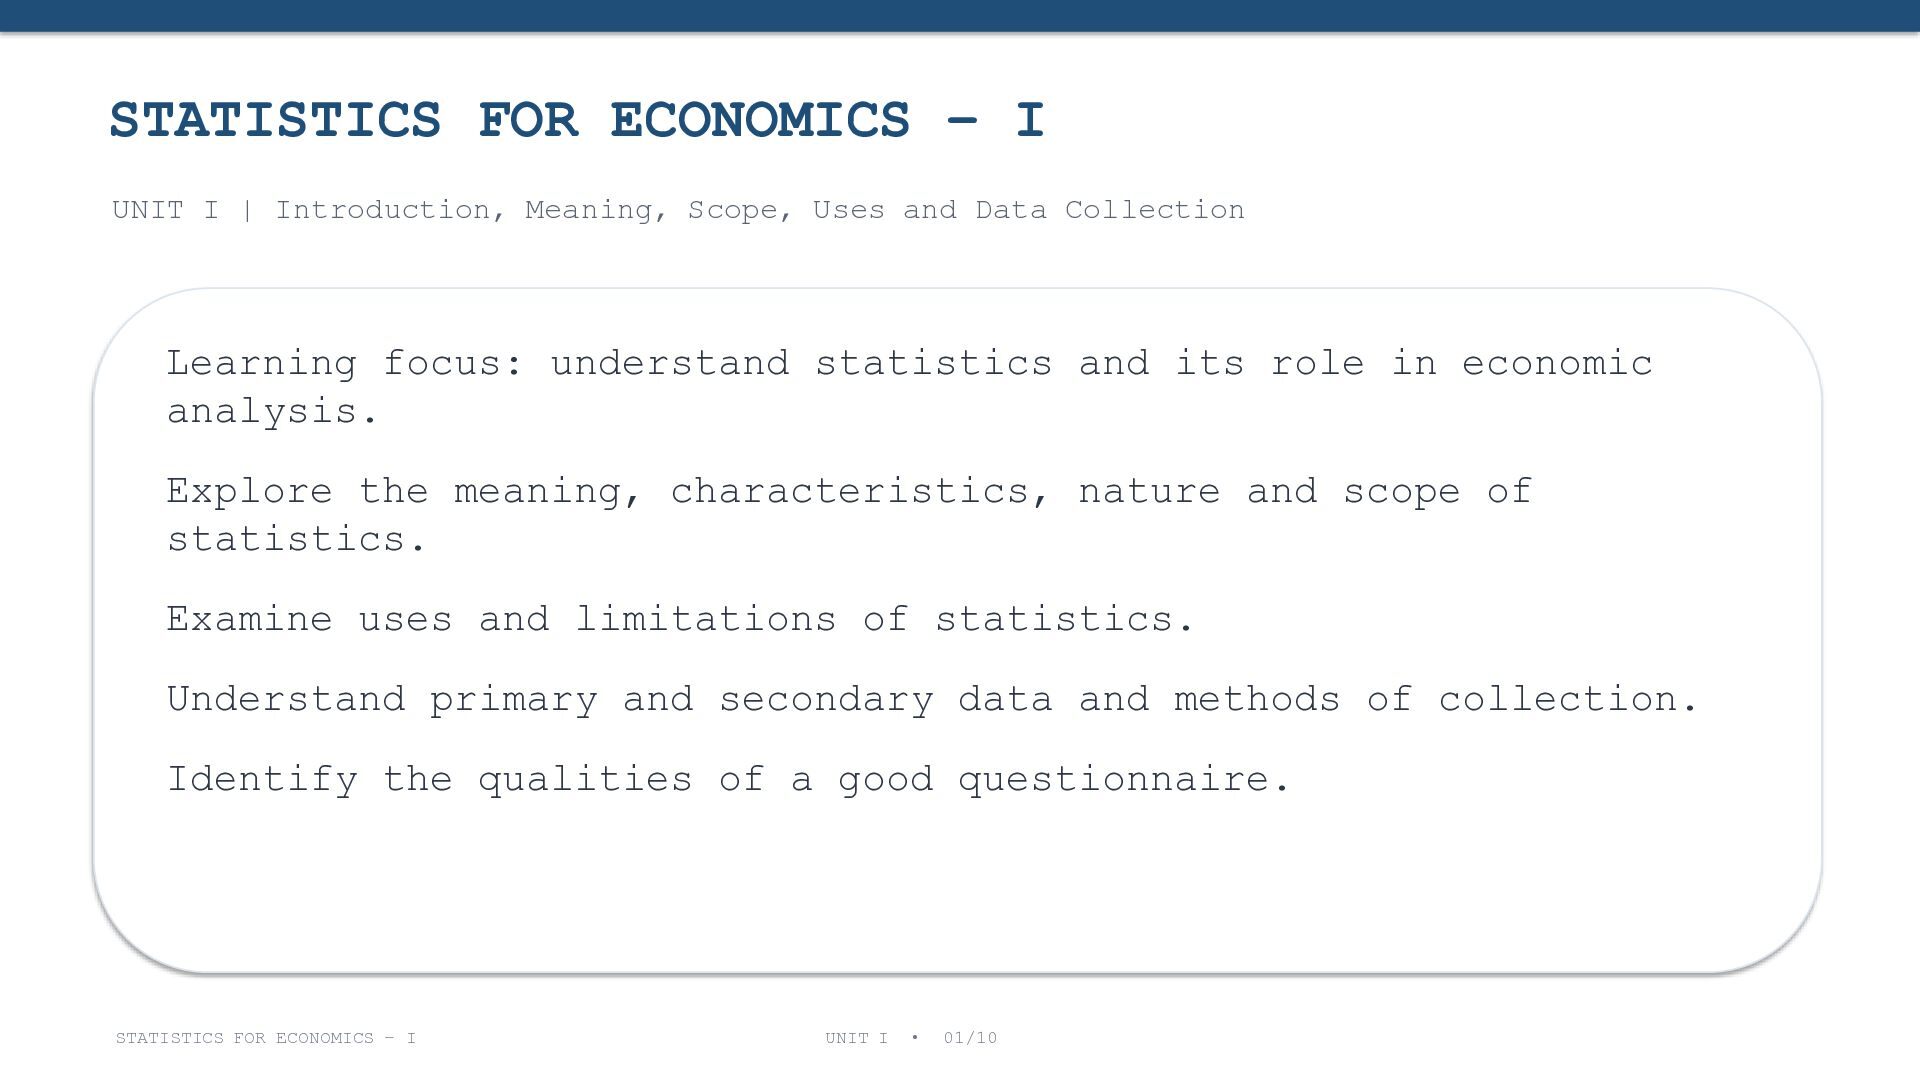
Scope, Uses and Data Collection Learning focus: understand statistics and its role in economic analysis. Explore the meaning, characteristics, nature and scope of statistics. Examine uses and limitations of statistics. Understand primary and secondary data and methods of collection. Identify the qualities of a good questionnaire. STATISTICS FOR ECONOMICS – I UNIT I • 01/10
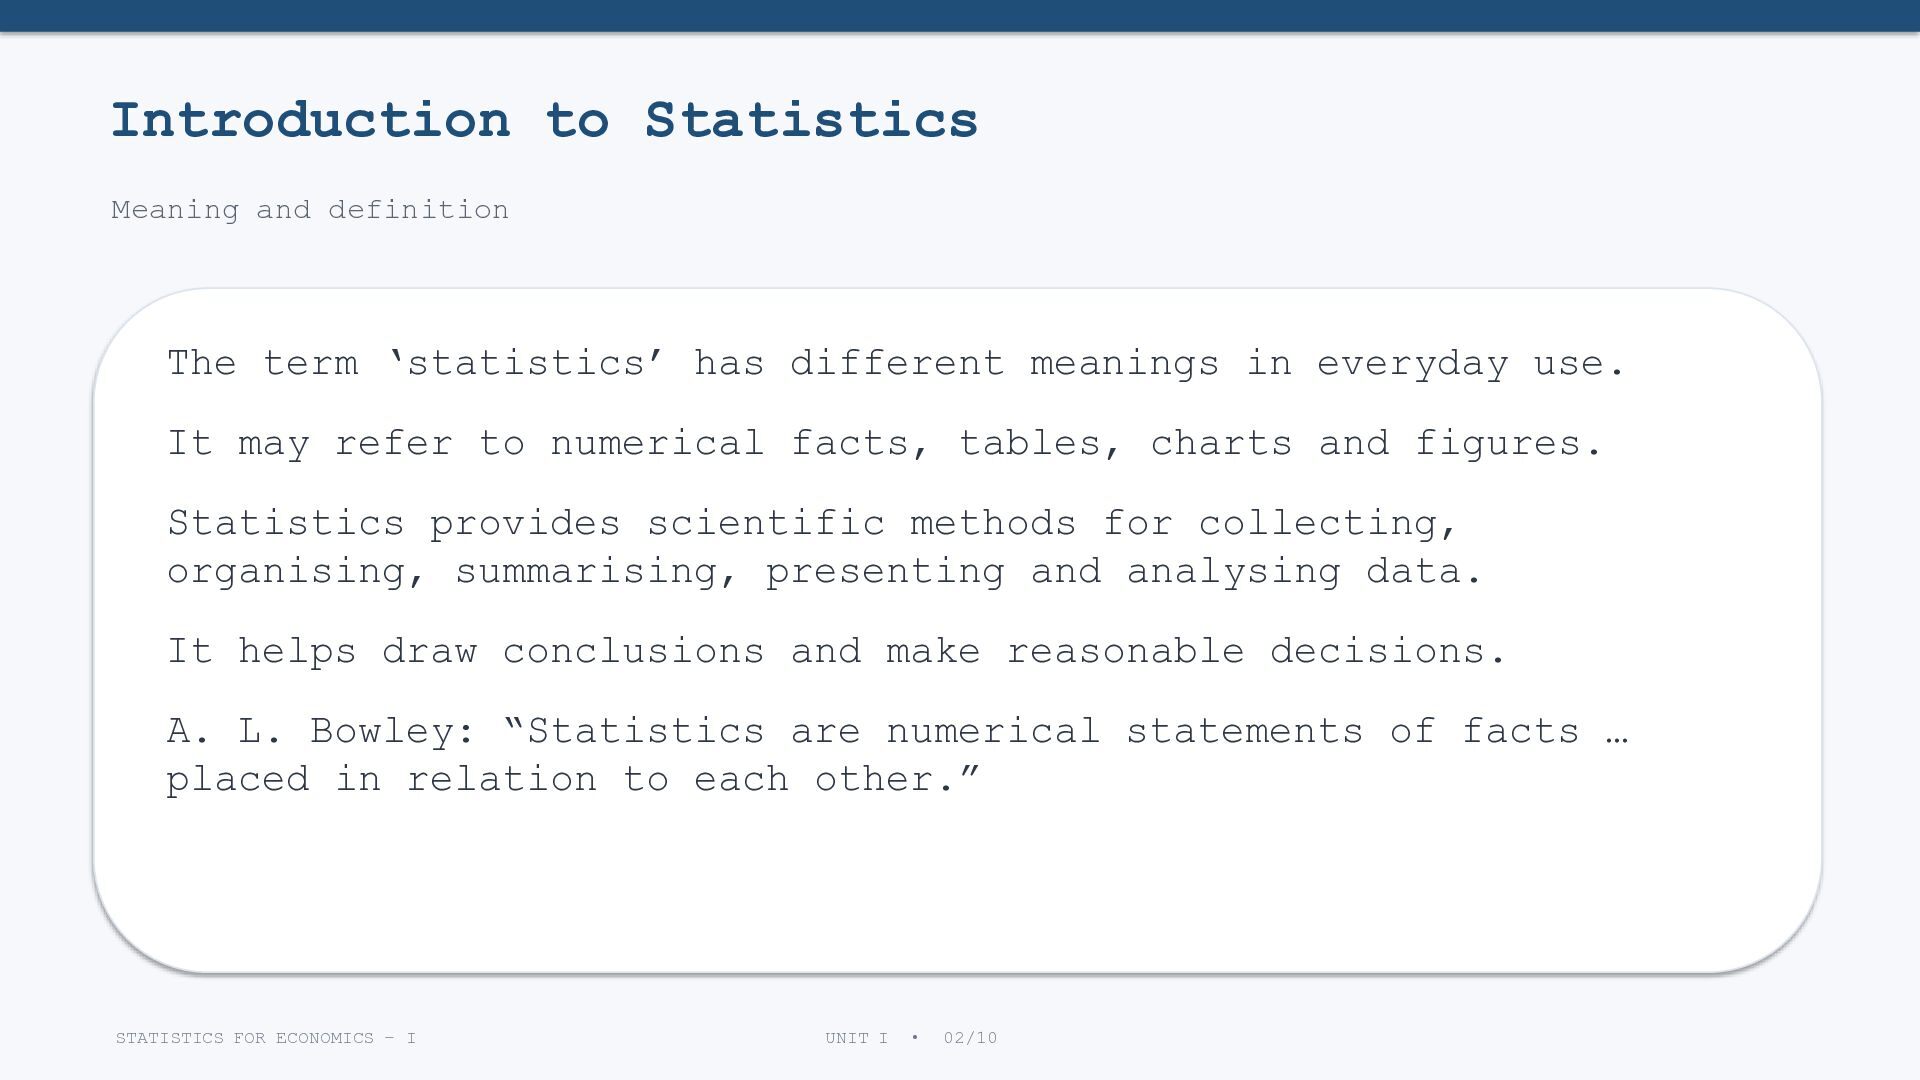
different meanings in everyday use. It may refer to numerical facts, tables, charts and figures. Statistics provides scientific methods for collecting, organising, summarising, presenting and analysing data. It helps draw conclusions and make reasonable decisions. A. L. Bowley: “Statistics are numerical statements of facts … placed in relation to each other.” STATISTICS FOR ECONOMICS – I UNIT I • 02/10
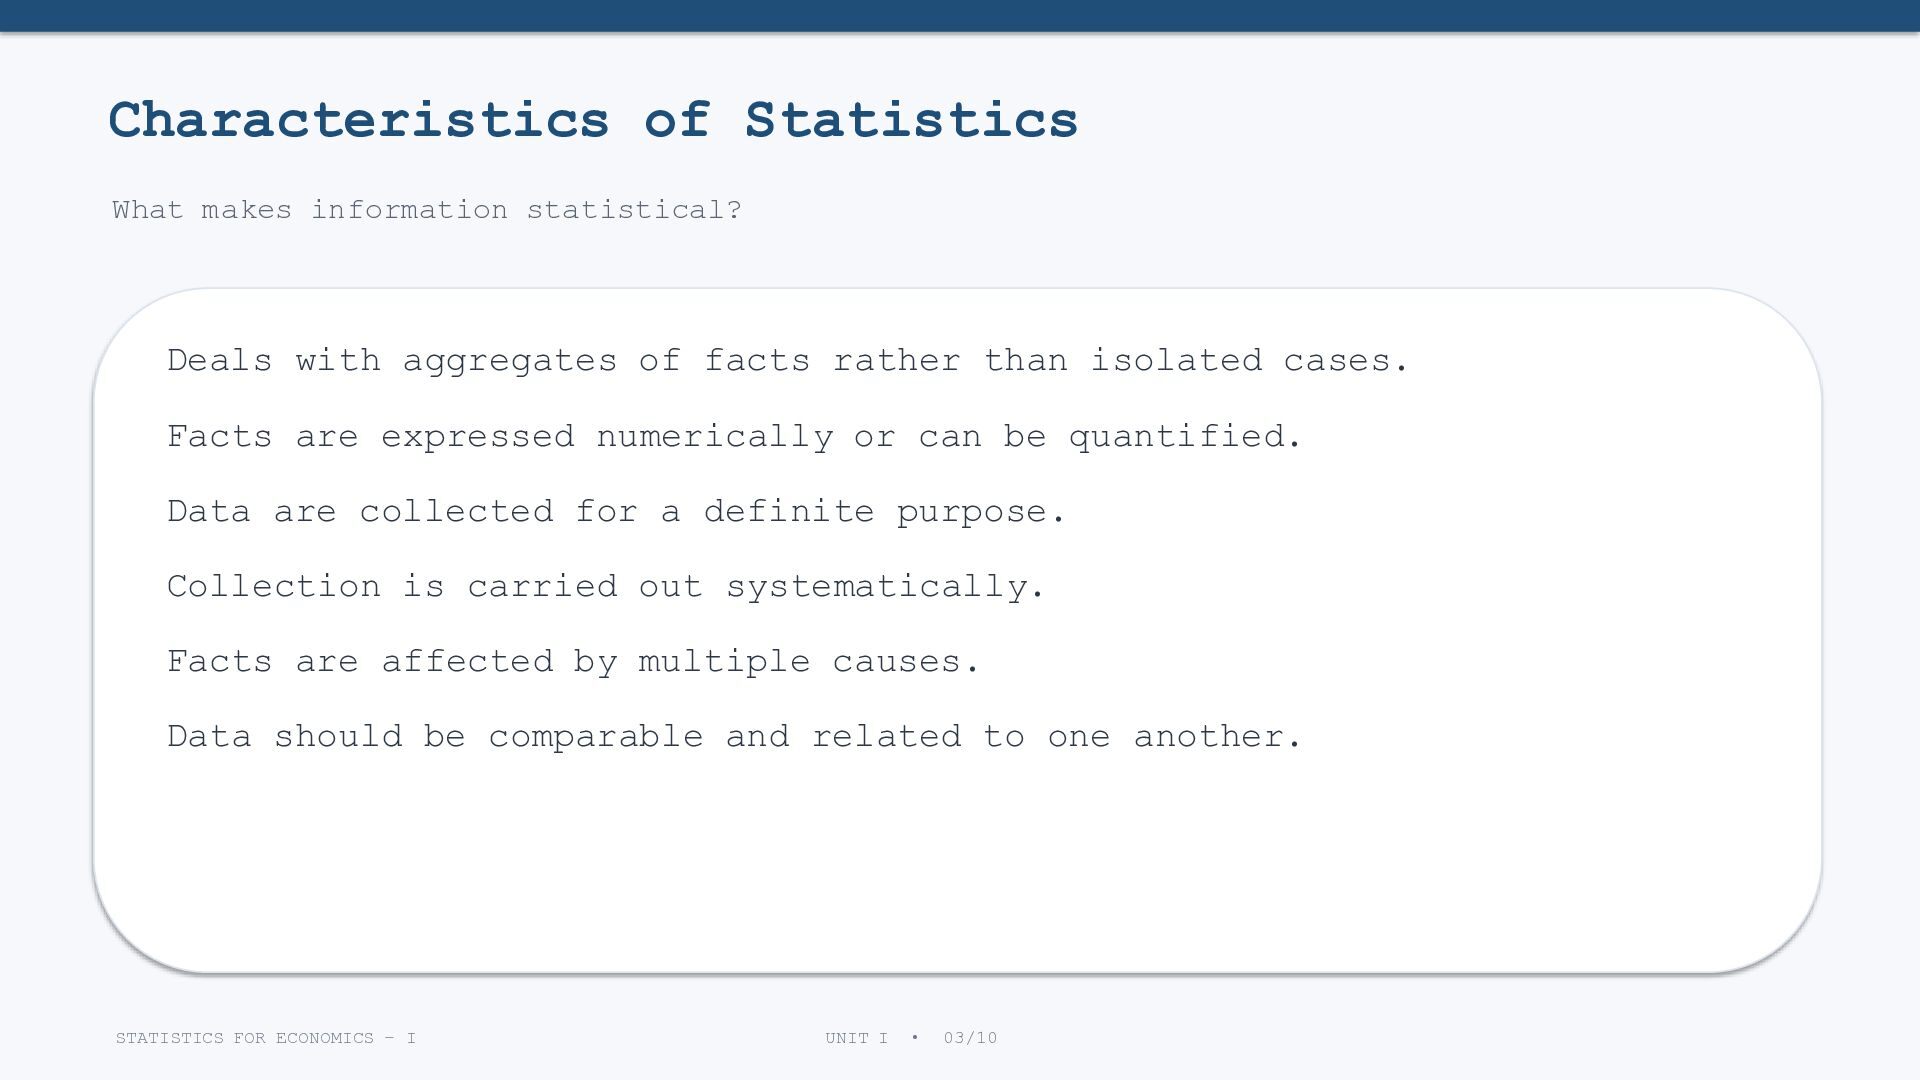
of facts rather than isolated cases. Facts are expressed numerically or can be quantified. Data are collected for a definite purpose. Collection is carried out systematically. Facts are affected by multiple causes. Data should be comparable and related to one another. STATISTICS FOR ECONOMICS – I UNIT I • 03/10
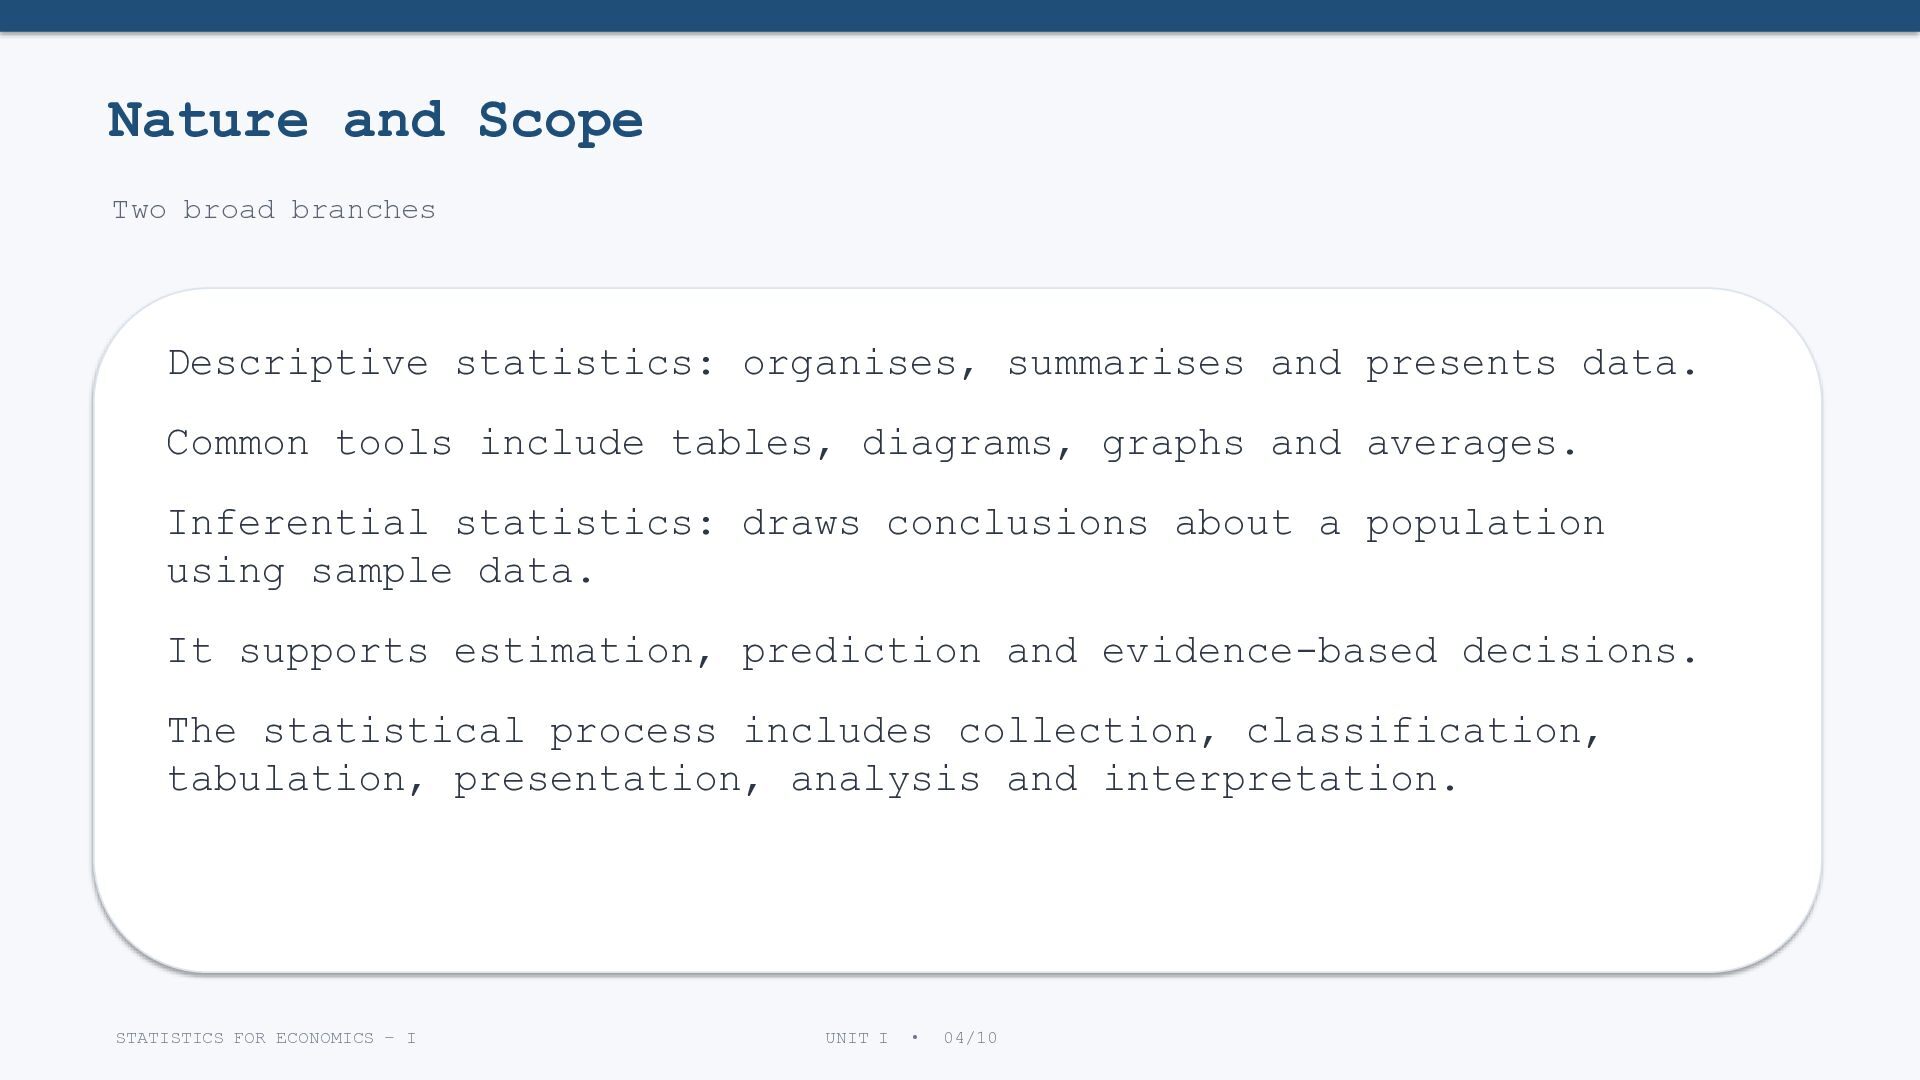
and presents data. Common tools include tables, diagrams, graphs and averages. Inferential statistics: draws conclusions about a population using sample data. It supports estimation, prediction and evidence-based decisions. The statistical process includes collection, classification, tabulation, presentation, analysis and interpretation. STATISTICS FOR ECONOMICS – I UNIT I • 04/10
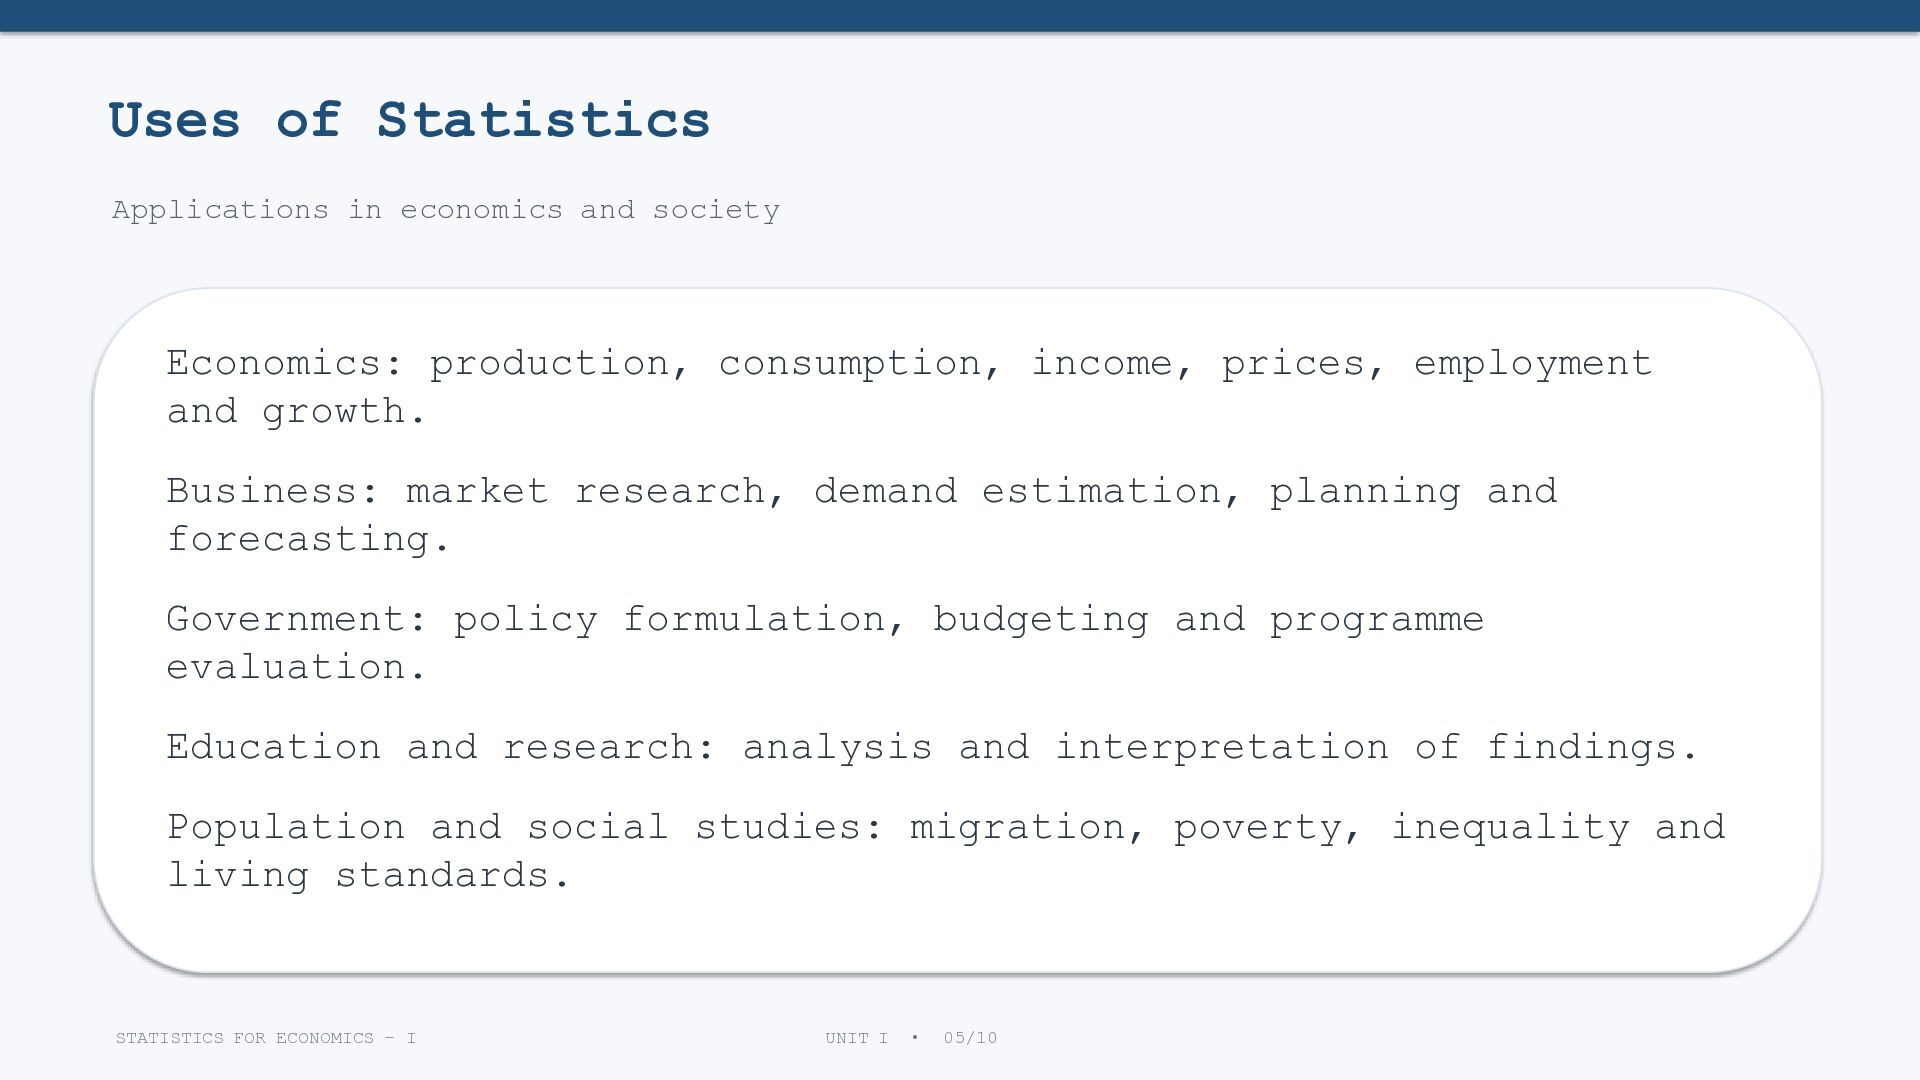
consumption, income, prices, employment and growth. Business: market research, demand estimation, planning and forecasting. Government: policy formulation, budgeting and programme evaluation. Education and research: analysis and interpretation of findings. Population and social studies: migration, poverty, inequality and living standards. STATISTICS FOR ECONOMICS – I UNIT I • 05/10
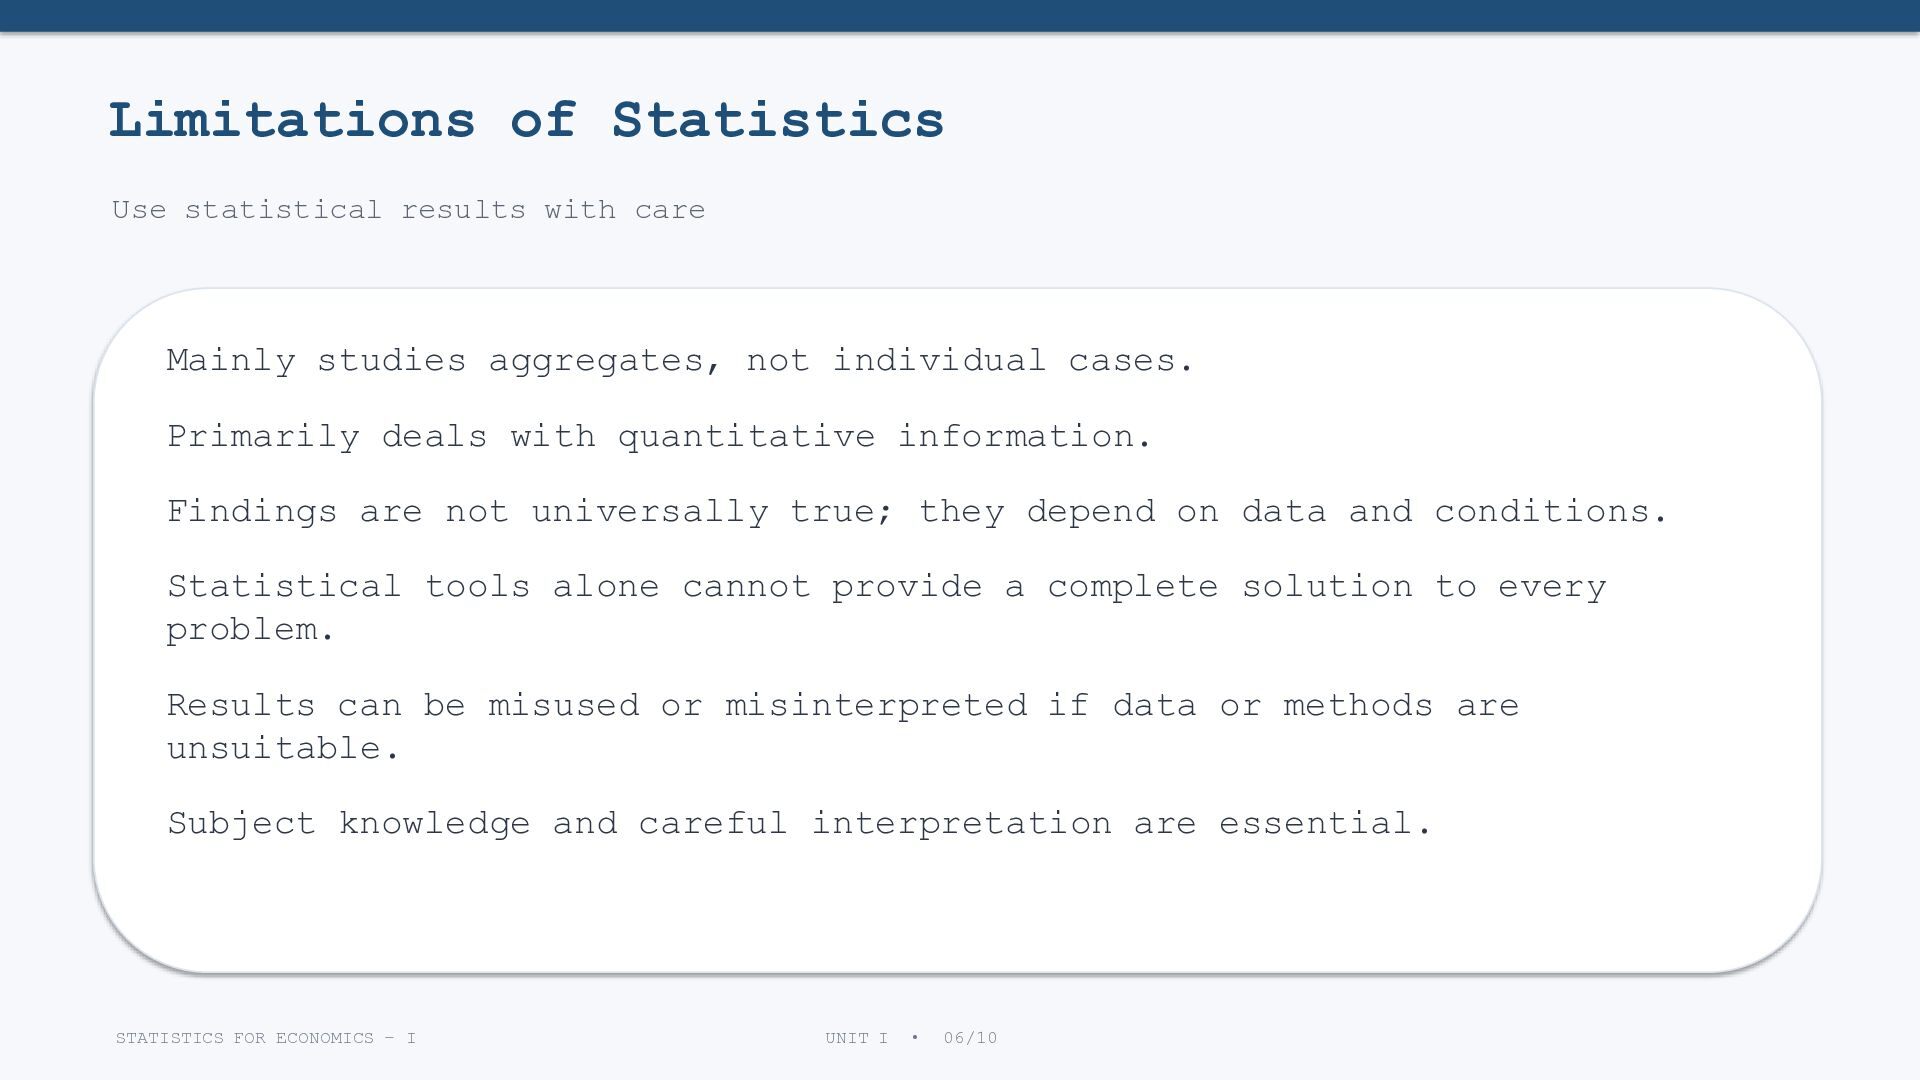
aggregates, not individual cases. Primarily deals with quantitative information. Findings are not universally true; they depend on data and conditions. Statistical tools alone cannot provide a complete solution to every problem. Results can be misused or misinterpreted if data or methods are unsuitable. Subject knowledge and careful interpretation are essential. STATISTICS FOR ECONOMICS – I UNIT I • 06/10
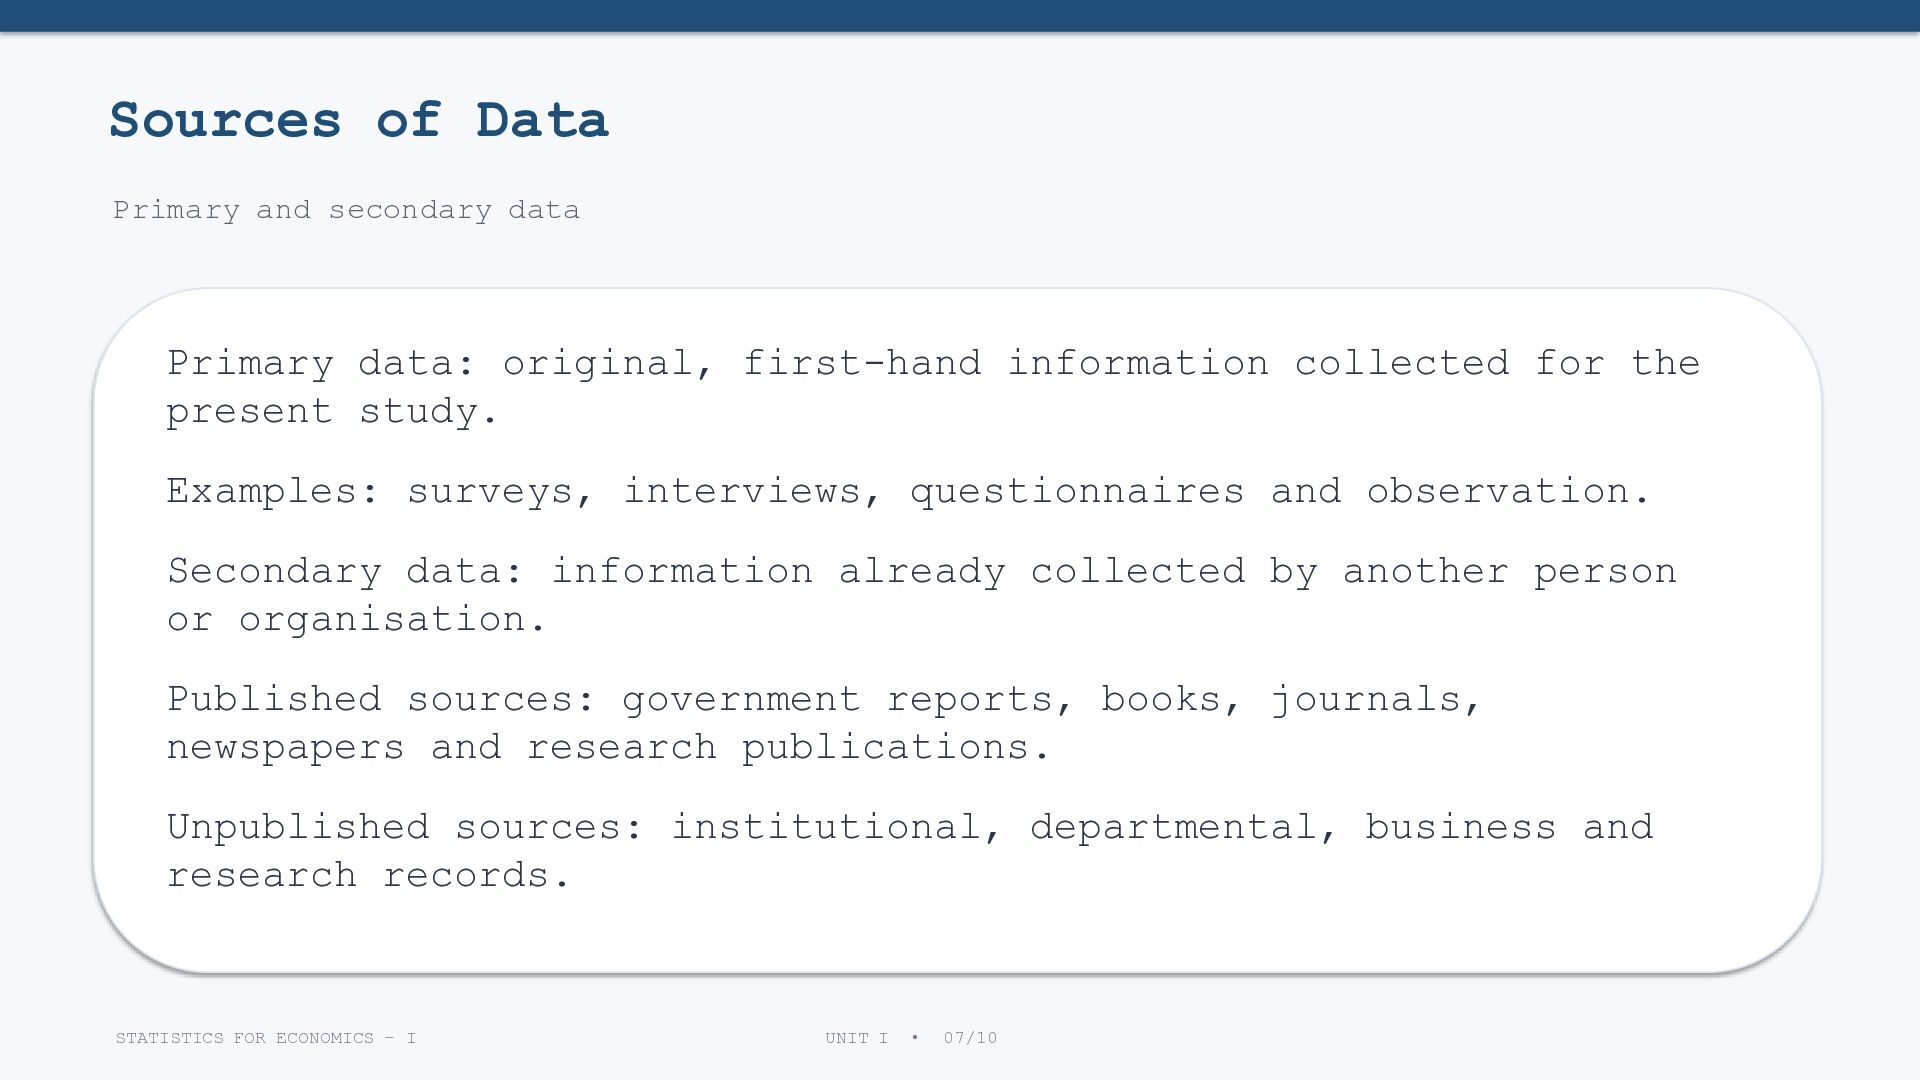
first-hand information collected for the present study. Examples: surveys, interviews, questionnaires and observation. Secondary data: information already collected by another person or organisation. Published sources: government reports, books, journals, newspapers and research publications. Unpublished sources: institutional, departmental, business and research records. STATISTICS FOR ECONOMICS – I UNIT I • 07/10
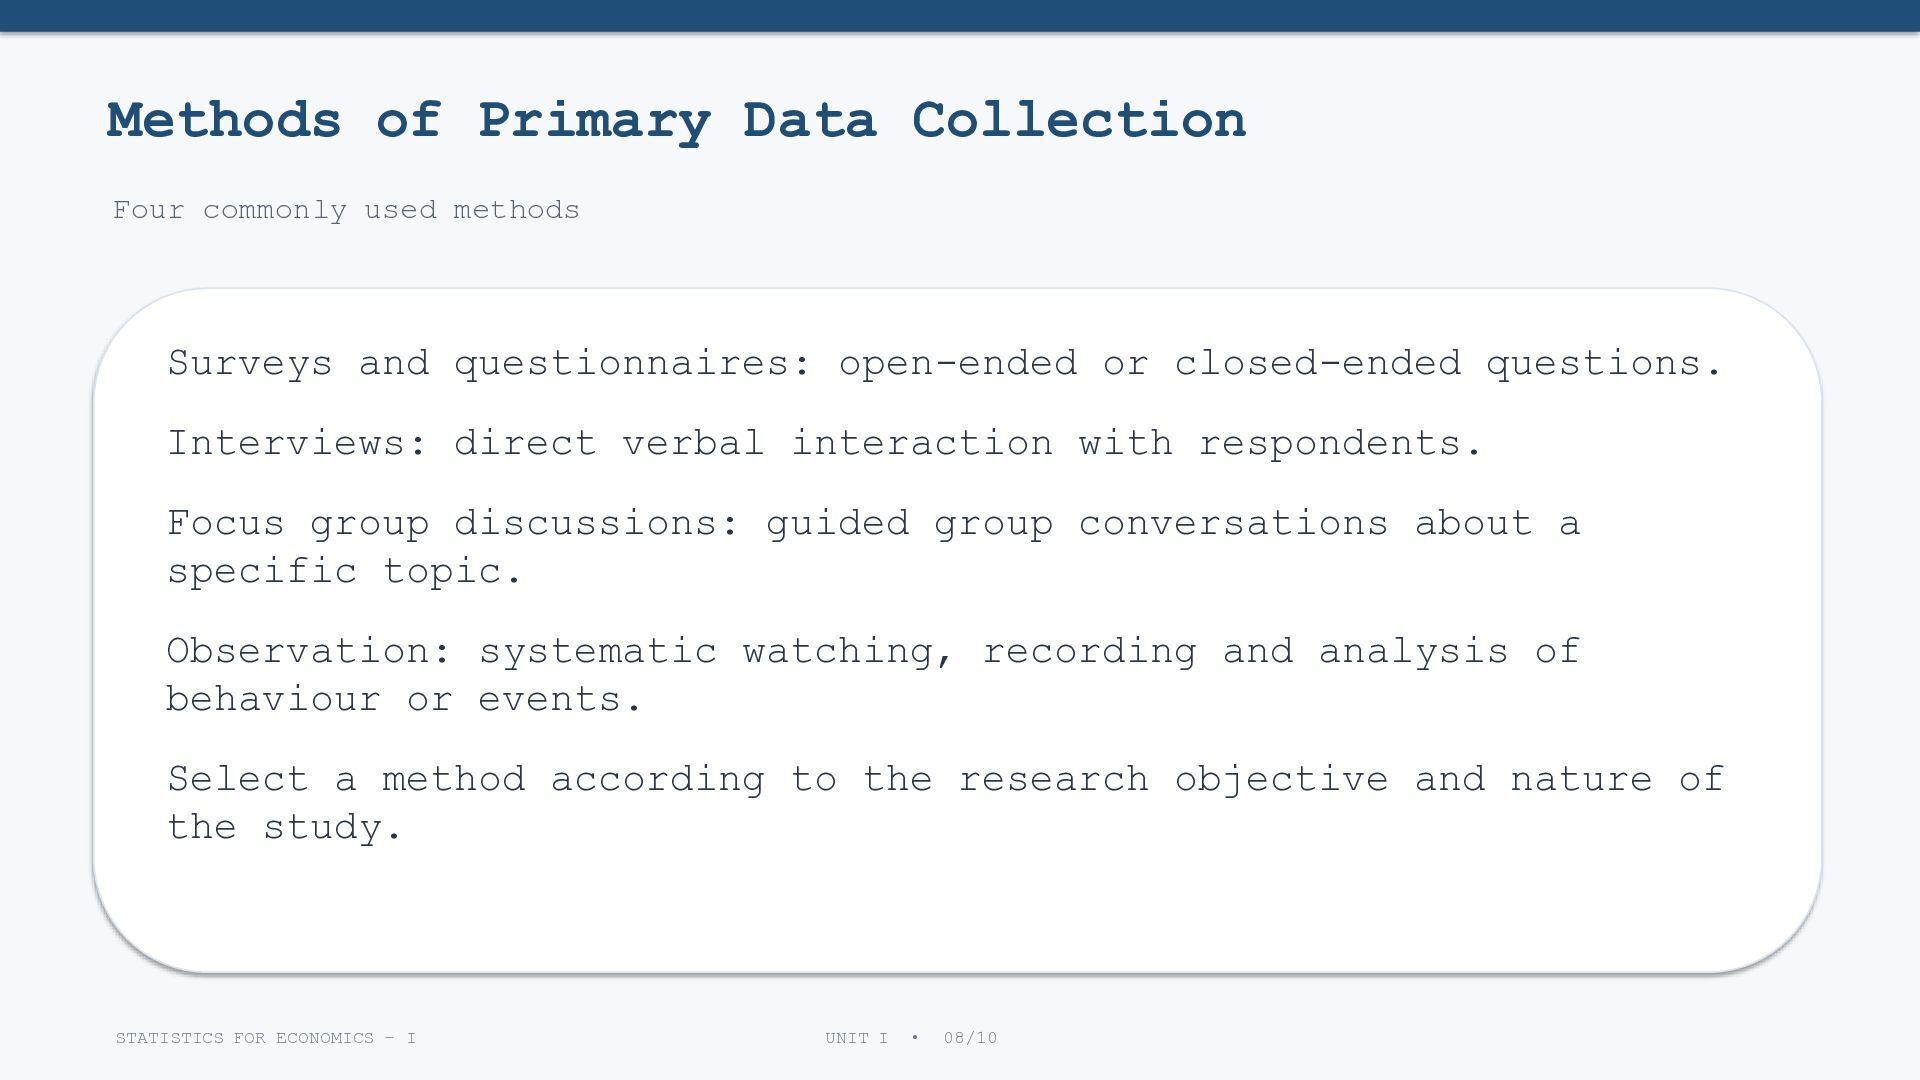
and questionnaires: open-ended or closed-ended questions. Interviews: direct verbal interaction with respondents. Focus group discussions: guided group conversations about a specific topic. Observation: systematic watching, recording and analysis of behaviour or events. Select a method according to the research objective and nature of the study. STATISTICS FOR ECONOMICS – I UNIT I • 08/10
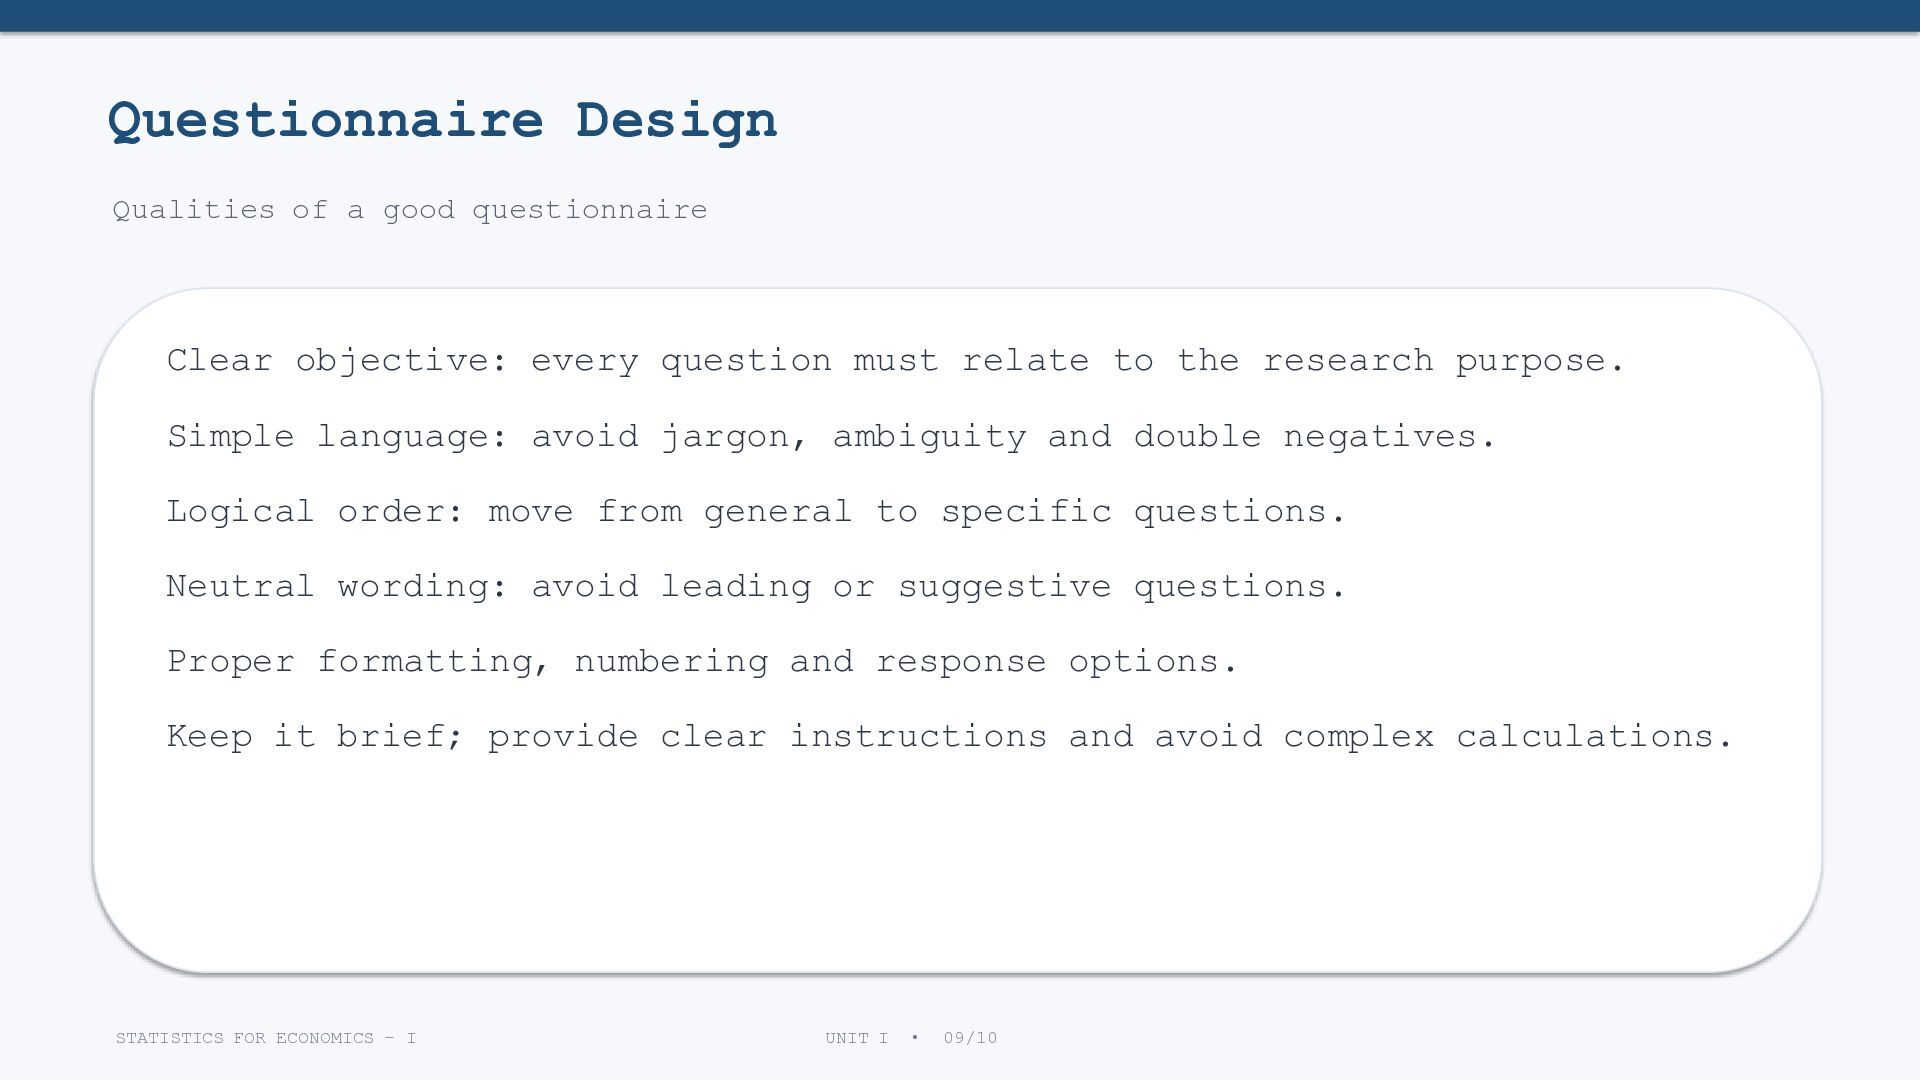
question must relate to the research purpose. Simple language: avoid jargon, ambiguity and double negatives. Logical order: move from general to specific questions. Neutral wording: avoid leading or suggestive questions. Proper formatting, numbering and response options. Keep it brief; provide clear instructions and avoid complex calculations. STATISTICS FOR ECONOMICS – I UNIT I • 09/10
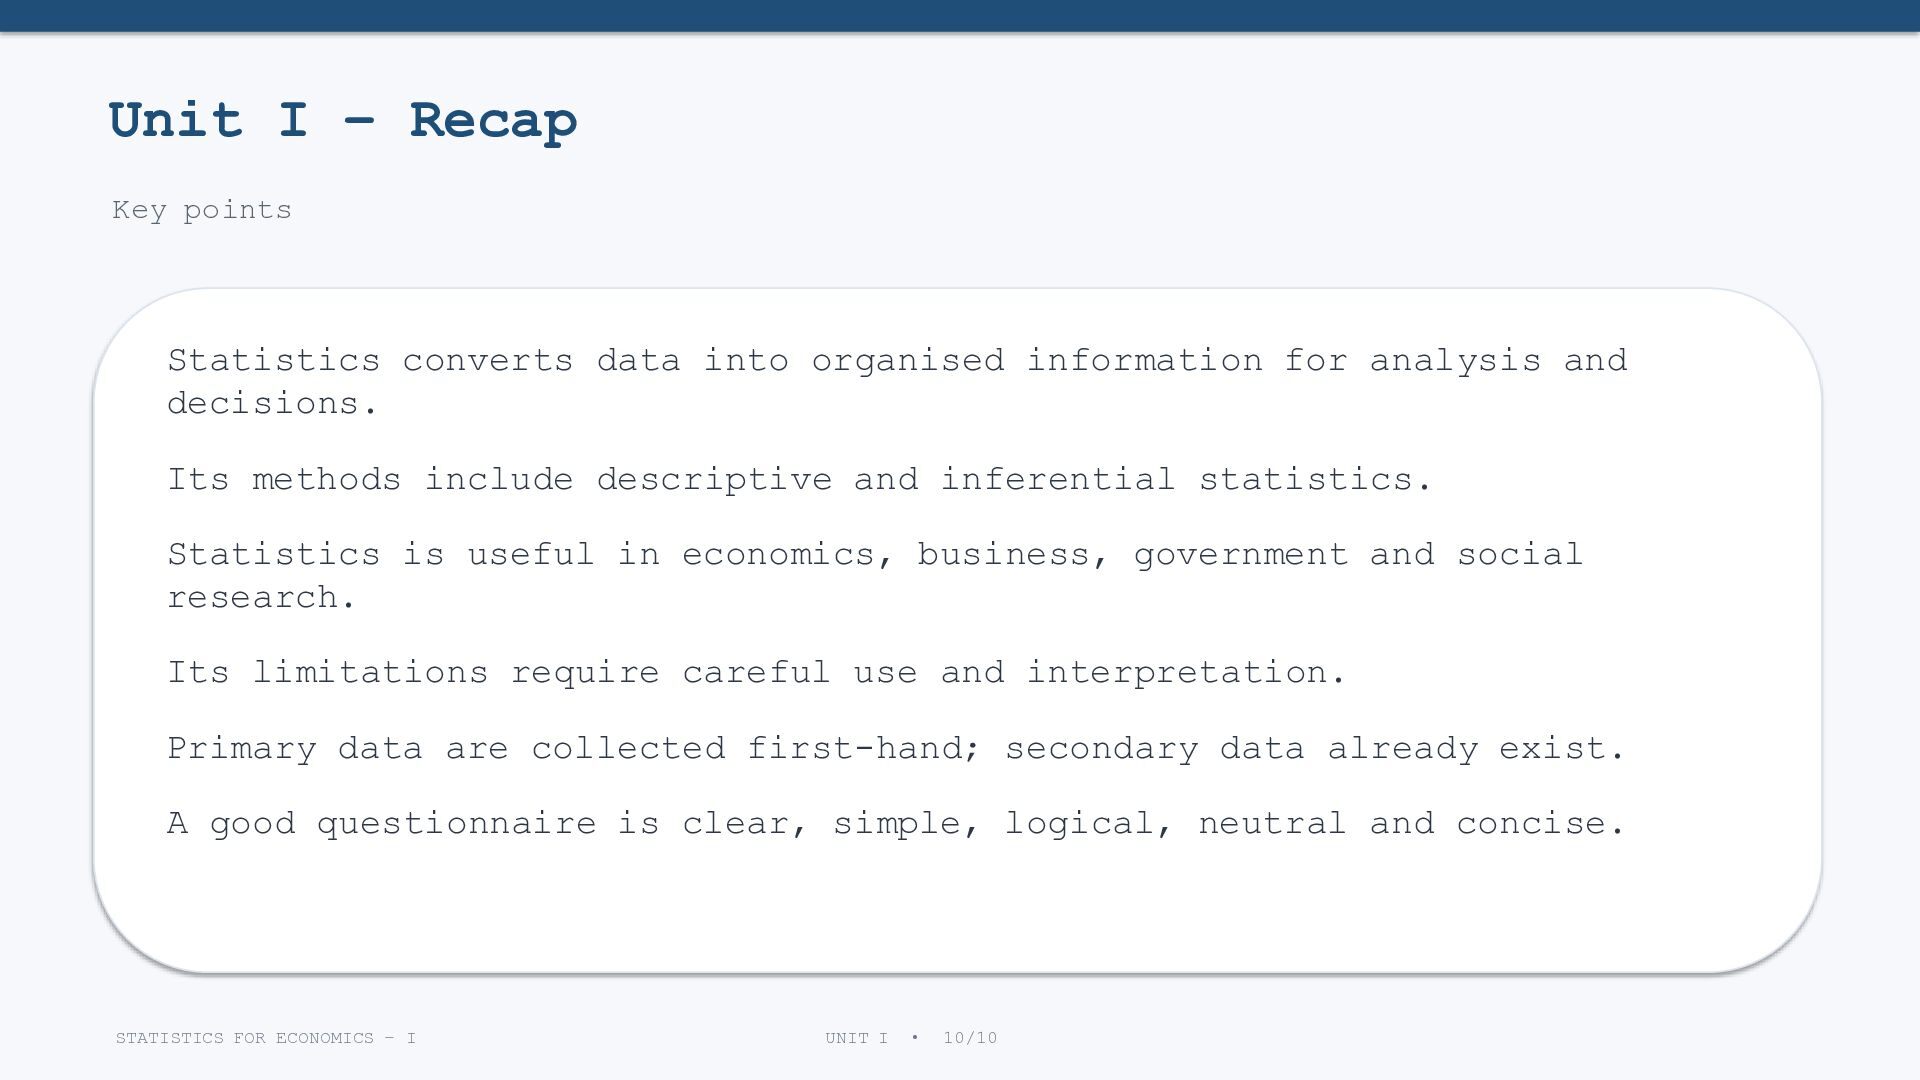
organised information for analysis and decisions. Its methods include descriptive and inferential statistics. Statistics is useful in economics, business, government and social research. Its limitations require careful use and interpretation. Primary data are collected first-hand; secondary data already exist. A good questionnaire is clear, simple, logical, neutral and concise. STATISTICS FOR ECONOMICS – I UNIT I • 10/10


 terazawa
 pawan_pharm
 kentaroy47
 rashwhitman
 ainischool
 cbtlibrary
 signer
 doratex
 spring_aki
 akiraasano
 terasawat
 yasslab
 akademiya2063
 akosma
 sergeychernyshev
 baasie
 tapps
 carmenintech
 reverentgeek
 caitiem20
 swwweet
 chrisshort
 marcoroth