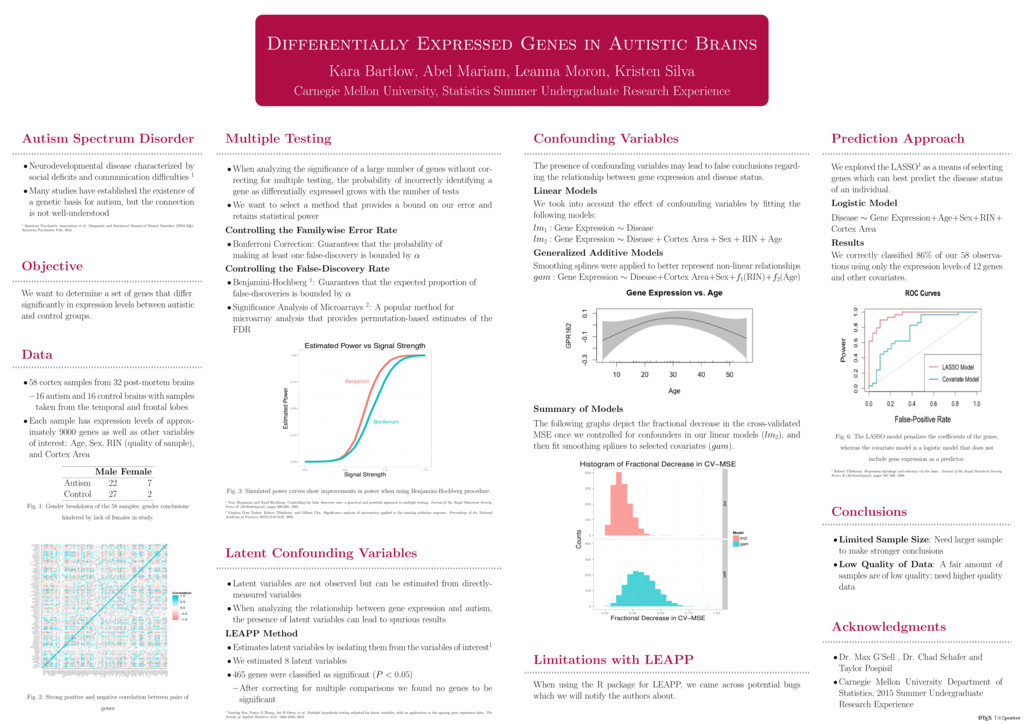
Kara Bartlow, Abel Mariam, Leanna Moron, Kristen Silva Carnegie Mellon University, Statistics Summer Undergraduate Research Experience Differentially Expressed Genes in Autistic Brains Kara Bartlow, Abel Mariam, Leanna Moron, Kristen Silva Carnegie Mellon University, Statistics Summer Undergraduate Research Experience Autism Spectrum Disorder • Neurodevelopmental disease characterized by social deficits and communication difficulties 1 • Many studies have established the existence of a genetic basis for autism, but the connection is not well-understood 1 American Psychiatric Association et al. Diagnostic and Statistical Manual of Mental Disorders (DSM-5®). American Psychiatric Pub, 2013. Objective We want to determine a set of genes that differ significantly in expression levels between autistic and control groups. Data • 58 cortex samples from 32 post-mortem brains – 16 autism and 16 control brains with samples taken from the temporal and frontal lobes • Each sample has expression levels of approx- imately 9000 genes as well as other variables of interest: Age, Sex, RIN (quality of sample), and Cortex Area Male Female Autism 22 7 Control 27 2 Fig. 1: Gender breakdown of the 58 samples; gender conclusions hindered by lack of females in study. EEF1A1 RPS28 IPO13 LPP HNRPAB SNIP1 COL17A1 HMG20B TICAM2 SERTAD2 SPP1 AUP1 MFN2 BRD9 SELM ZFPM1 HIST1H2BD GADD45G ERGIC1 C4ORF8 SKIV2L2 NUMBL KDELC2 AQP3 MARK4 EXOC6 GPC2 MBTPS1 TGOLN2 TMEM25 MKL1 MAP3K11 SLC38A2 GSTM4 GRIK1 GALNT11 BASP1 CCT3 EHD1 RND1 RPS16 UBIAD1 CWF19L1 SETD8 TPST1 ABCC5 C6ORF129 PPEF1 CSNK1G3 MGC42105 LMBRD1 DVL2 COX4I1 HSPC049 CBR3 POPDC3 FBXO32 TTC8 LOC200312 FN3KRP PDHX KIAA1324L SUCLG2 RAB2 PRKCBP1 SPATA7 MTHFD2L LOC112714 SLC26A4 THAP7 APEX2 C21ORF25 MTMR9 C9ORF28 C5ORF16 DTNA ACTR5 C9ORF19 FAM89A TMCO5 C14ORF2 ERF WDR71 C19ORF37 HIC2 LOC400451 ATP5J CDC5L PRRG3 NUP160 CABLES1 COL4A1 ECH1 PER1 CSTF2 SH3D19 SNCG AAMP SLC22A17 EFEMP2 EEF1A1 RPS28 IPO13 LPP HNRPAB SNIP1 COL17A1 HMG20B TICAM2 SERTAD2 SPP1 AUP1 MFN2 BRD9 SELM ZFPM1 HIST1H2BD GADD45G ERGIC1 C4ORF8 SKIV2L2 NUMBL KDELC2 AQP3 MARK4 EXOC6 GPC2 MBTPS1 TGOLN2 TMEM25 MKL1 MAP3K11 SLC38A2 GSTM4 GRIK1 GALNT11 BASP1 CCT3 EHD1 RND1 RPS16 UBIAD1 CWF19L1 SETD8 TPST1 ABCC5 C6ORF129 PPEF1 CSNK1G3 MGC42105 LMBRD1 DVL2 COX4I1 HSPC049 CBR3 POPDC3 FBXO32 TTC8 LOC200312 FN3KRP PDHX KIAA1324L SUCLG2 RAB2 PRKCBP1 SPATA7 MTHFD2L LOC112714 SLC26A4 THAP7 APEX2 C21ORF25 MTMR9 C9ORF28 C5ORF16 DTNA ACTR5 C9ORF19 FAM89A TMCO5 C14ORF2 ERF WDR71 C19ORF37 HIC2 LOC400451 ATP5J CDC5L PRRG3 NUP160 CABLES1 COL4A1 ECH1 PER1 CSTF2 SH3D19 SNCG AAMP SLC22A17 EFEMP2 −1.0 −0.5 0.0 0.5 1.0 Correlation Fig. 2: Strong positive and negative correlation between pairs of genes Multiple Testing • When analyzing the significance of a large number of genes without cor- recting for multiple testing, the probability of incorrectly identifying a gene as differentially expressed grows with the number of tests • We want to select a method that provides a bound on our error and retains statistical power Controlling the Familywise Error Rate • Bonferroni Correction: Guarantees that the probability of making at least one false-discovery is bounded by α Controlling the False-Discovery Rate • Benjamini-Hochberg 1: Guarantees that the expected proportion of false-discoveries is bounded by α • Significance Analysis of Microarrays 2: A popular method for microarray analysis that provides permutation-based estimates of the FDR 0.00 0.25 0.50 0.75 1.00 0.0 0.5 1.0 1.5 Signal Strength Estimated Power Estimated Power vs Signal Strength Benjamini Bonferroni Fig. 3: Simulated power curves show improvements in power when using Benjamini-Hochberg procedure. 1 Yoav Benjamini and Yosef Hochberg. Controlling the false discovery rate: a practical and powerful appraoch to multiple testing. Journal fo the Royal Statistical Society. Series B (Methodological), pages 289-300, 1995. 2 Virginia Goss Tusher, Robert Tibshirani, and Gilbert Chu. Significance analysis of microarrays applied to the ionizing radiation response. Proceedings of the National Academy of Sciences, 98(9):5116-5125, 2001. Latent Confounding Variables • Latent variables are not observed but can be estimated from directly- measured variables • When analyzing the relationship between gene expression and autism, the presence of latent variables can lead to spurious results LEAPP Method • Estimates latent variables by isolating them from the variables of interest1 • We estimated 8 latent variables • 465 genes were classified as significant (P < 0.05) – After correcting for multiple comparisons we found no genes to be significant 1 Yunting Sun, Nancy R Zhang, Art B Owen, et al. Multiple hypothesis testing adjusted for latent variables, with an application to the agemap gene expression data. The Annals of Applied Statistics, 6(4): 1664-1688, 2012. Confounding Variables The presence of confounding variables may lead to false conclusions regard- ing the relationship between gene expression and disease status. Linear Models We took into account the effect of confounding variables by fitting the following models: lm1 : Gene Expression ∼ Disease lm2 : Gene Expression ∼ Disease + Cortex Area + Sex + RIN + Age Generalized Additive Models Smoothing splines were applied to better represent non-linear relationships gam : Gene Expression ∼ Disease+Cortex Area+Sex+f1 (RIN)+f2 (Age) Summary of Models The following graphs depict the fractional decrease in the cross-validated MSE once we controlled for confounders in our linear models (lm2 ), and then fit smoothing splines to selected covariates (gam). 0 100 200 300 400 0 100 200 300 400 lm2 gam 0.00 0.25 0.50 0.75 1.00 Fractional Decrease in CV−MSE Counts Model lm2 gam Histogram of Fractional Decrease in CV−MSE Limitations with LEAPP When using the R package for LEAPP, we came across potential bugs which we will notify the authors about. Prediction Approach We explored the LASSO1 as a means of selecting genes which can best predict the disease status of an individual. Logistic Model Disease ∼ Gene Expression+Age+Sex+RIN+ Cortex Area Results We correctly classified 86% of our 58 observa- tions using only the expression levels of 12 genes and other covariates. Fig. 6: The LASSO model penalizes the coefficients of the genes, whereas the covariate model is a logistic model that does not include gene expression as a predictor. 1 Robert Tibshirani. Regression shrinkage and selection via the lasso. Journal of the Royal Statistical Society. Series B (Methodological), pages 267-288, 1996. Conclusions • Limited Sample Size: Need larger sample to make stronger conclusions • Low Quality of Data: A fair amount of samples are of low quality; need higher quality data Acknowledgments • Dr. Max G’Sell , Dr. Chad Schafer and Taylor Pospisil • Carnegie Mellon University Department of Statistics, 2015 Summer Undergraduate Research Experience