Upgrade to Pro — share decks privately, control downloads, hide ads and more …

DecisionNeuro_L03_ExperimentalDesign

Lei Zhang
March 27, 2020

 DecisionNeuro_L03_ExperimentalDesign

Lei Zhang

March 27, 2020
Tweet

More Decks by Lei Zhang

Other Decks in Education

Transcript

  1. [email protected] lei-zhang.net @lei_zhang_lz Lecture 02 Lei Zhang Social, Cognitive and

    Affective Neuroscience Unit (SCAN-Unit) Department of Cognition, Emotion, and Methods in Psychology
  2. 3

  3. • We are all curious about mental process and behaviour

    – why do many people distrust the government? – why do many people hoard toilet paper during social crises? • Psychology researchers are also interested in those questions, but what distinguishes psychology researchers from the others? – method they use to produce and develop their knowledge → scientific methods • Two main stages: – formulate hypotheses, e.g. what underlies a phenomenon – test hypotheses, e.g., what are the evidence 5
  4. • Experiments constitute a very powerful technique for the investigation

    of causal links between different things, and this is why they are ideal for testing causal hypotheses. • It is a master plan that specifies the methods and procedures for collecting and analyzing the needed information/data in a study. • Experiments are well-controlled: researchers manipulate one variable (e.g., X) and keep the other variables constant, then any difference in the observation (e.g., Y) could only be attributed to the difference in X. 7
  5. H: The more positive the mood of people, the better

    their intellectual performance. 8 Sani & Todman (2006)
  6. • In an experiment, the things that are expected to

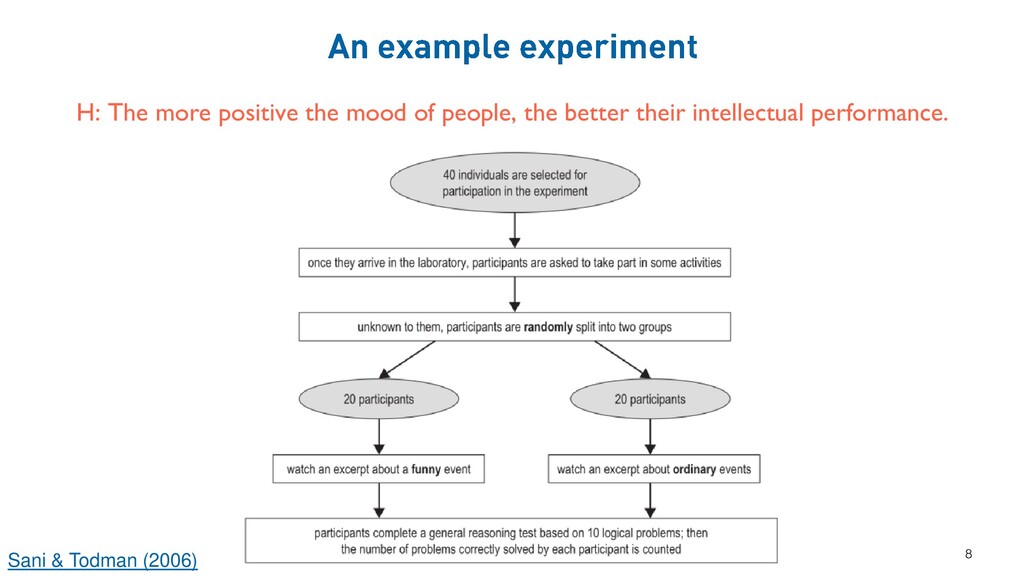
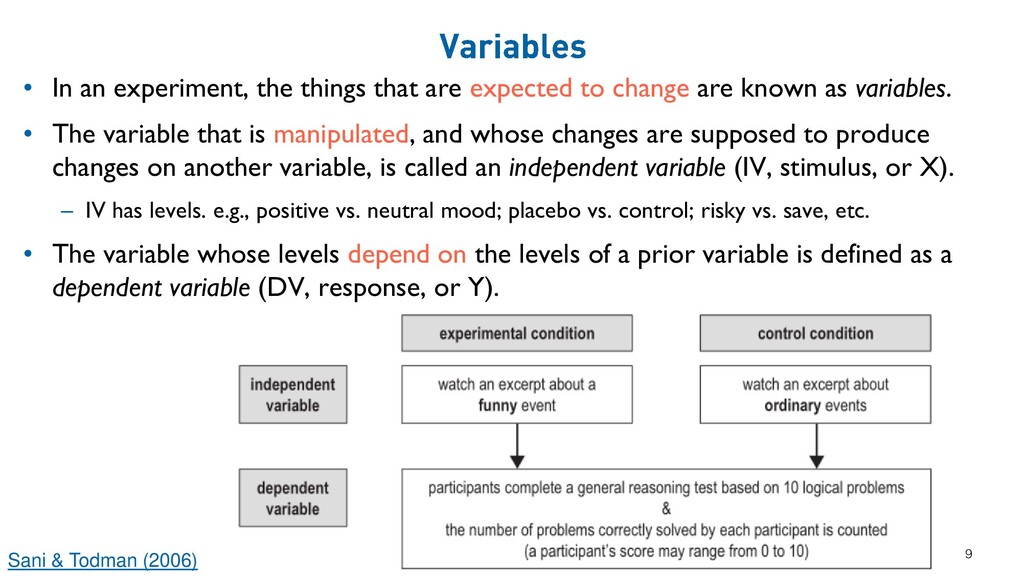
    change are known as variables. • The variable that is manipulated, and whose changes are supposed to produce changes on another variable, is called an independent variable (IV, stimulus, or X). – IV has levels. e.g., positive vs. neutral mood; placebo vs. control; risky vs. save, etc. • The variable whose levels depend on the levels of a prior variable is defined as a dependent variable (DV, response, or Y). 9 Sani & Todman (2006)
  7. • How do we know watching funny vs. non-funny videos

    induces positive vs. neutral mood? • We could ask participants to define their mood by specifying whether it is, say, ‘good’, ‘neutral’, or ‘bad’, or give a rating on a 1 – 9 scale. • But, this manipulation check has to be orthogonal to DV – we use manipulation check to make sure the experiment induces the conditions we want, not to check whether the experiment (dis)confirms our hypothesis. 10
  8. 11 Sani & Todman (2006) A simple randomization: flipping a

    coin each time a new participant arrives, and allocating the participant to the “funny” condition if the coin is a head, or to “ordinary” condition if a tail appears. → to control for nuisance/confounding variables
  9. Is this experiment appropriately designed? A project student wants to

    examine how caffeine affects performance on a memory test. All participants were asked not to consume caffeinated drinks within 24h before the test. The first 20 participants to come to the department were given a cup of caffeinated coffee before the memory test. The next 20 participants to come to the department were given a cup of decaffeinated coffee before the memory test. The test performance of each group was used as dependent variable. 12 Q: What is wrong with this experimental design? (A) Nothing. (B) Allocation of participants to groups. (C) Sample size.
  10. • “True” experiments – involve full control of the experimenter

    over allocation and scheduling of the treatment → complete randomization – e.g., placebo vs. control • Quasi-experiments – no full control over the allocation of participants to the different levels of the independent variable → partial randomization – e.g., autistic individuals vs. healthy control 13
  11. 14 • each participant is tested under all conditions •

    e.g., learning performance at the beginning vs. at the end of the semester
  12. 15 • each participant is tested in only one condition

    • e.g., mood → IQ performance in the previous example
  13. • Ordering effect • It is not ideal to always

    have (1) real/violent, (2) real/nonviolent, (3) cartoon/violent, (4) cartoon/nonviolent • Possible solution: counterbalance – 1 2 3 4 – 2 3 4 1 – 3 4 1 2 – 4 1 2 3 18
  14. • Correlational research – e.g., relationship between stress level and

    physical symptoms – note: Correlation does not imply causation! • Survey research – e.g., empathy questionnaire • Observational research – e.g., how infants naturally behave within their first 3 – 6 months • etc. 21
  15. 24 Sani & Todman (2006) Null hypothesis (H 0 ):

    there’s no difference in performance between conditions Alternative hypothesis (H 1 /H E ): there’s is difference in performance between conditions
  16. • NHST is a method of statistical inference by which

    an experimental factor is tested against a hypothesis of no effect or no relationship based on a given observation. • the p-value is used to reject the null hypothesis • what is the p-value? 25 (A) The probability of failing to reject the null hypothesis, given the observed results. (B) The probability that the null hypothesis is true, given the observed results. (C) The probability of observing results as extreme or more extreme than currently observed, given that the null hypothesis is true. (D) The probability that the observed results are statistically significant, given that the null hypothesis is true.
  17. 27

  18. • one sample t-test – e.g., grades of a class

    is higher than the average of the entire university • independent sample t-test – e,g., IQ performance between the “funny” condition and the “ordinary” condition; appropriate for between-subject designs, when there are two groups • paired t-test – e.g., learning performance at the beginning vs. at the end of the semester; appropriate for within-subject designs, when there are two conditions 28 More reading: https://opentext.wsu.edu/carriecuttler/chapter/13-2-some-basic-null-hypothesis-tests/
  19. • When there are more than two groups or condition

    means to be compared, the most common null hypothesis test is the analysis of variance (ANOVA). 29 Lammers & Badia (2013)
  20. • The degree of relationship between two variables is calculated

    as a statistic called a correlation index (e.g., Pearson’s r), which can vary from −1 (a perfect negative relationship), through zero (no relationship), to +1 (a perfect positive relationship). 30 Lammers & Badia (2013)
  21. • Appropriate when we are interested to make predictions: (i)

    how much one variable will change on the basis of known changes on another variable, and (ii) how a particular individual with a given score on one variable will score on another variable. 31 Sani & Todman (2006) # of nations = −3.15 + 0.97 × Age