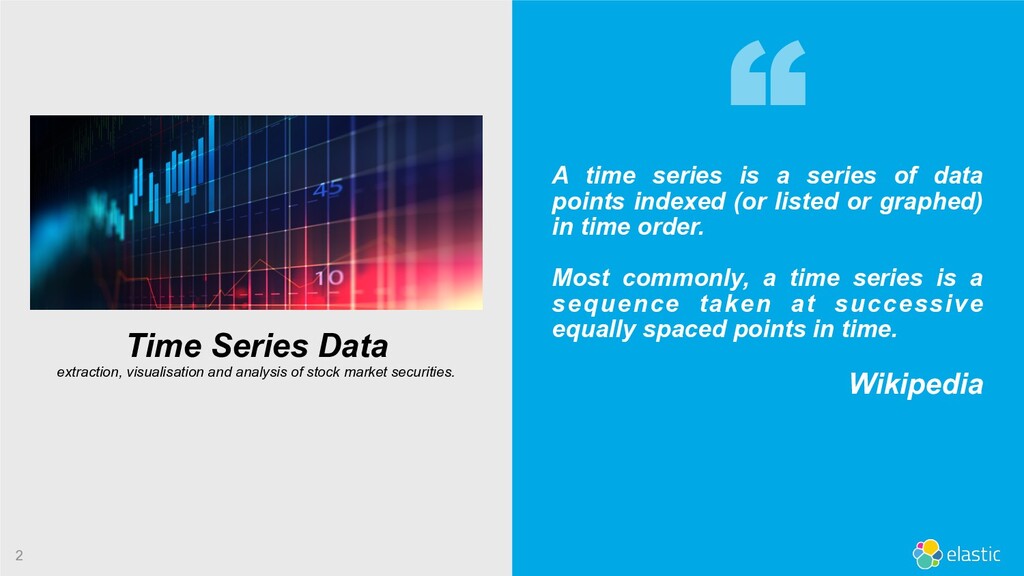
indexed (or listed or graphed) in time order. Most commonly, a time series is a sequence taken at successive equally spaced points in time. Wikipedia Time Series Data extraction, visualisation and analysis of stock market securities.
events where information refers to a moment in time.. ‒ logs, catalogs, metrics, stock market securities, production data, etc ‒ they usually grow very fast as long as the event exists • They must be "denormalised" and structured in the correct manner before an analysis can be performed. ‒ denormalising is the standard way to indexing and storing data in a search engine or in any NoSQL database. Source: elastic.co
series data in Elasticsearch is simple but requires that fields are correctly mapped. Kibana natively has tools that allow you to analyse Time Series data in all forms such as TSVB (Time Series Visual Builder) Let's see some...
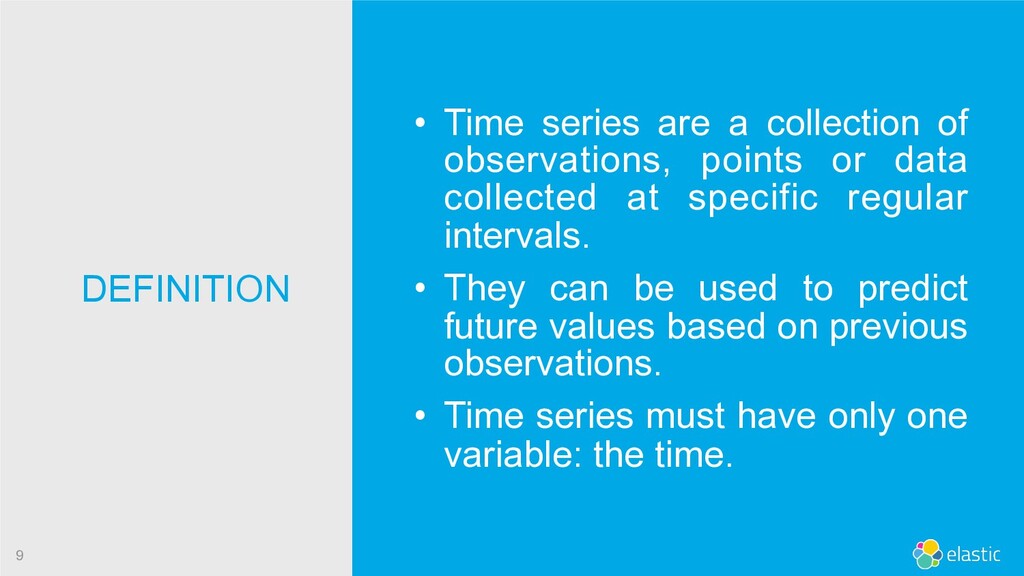
or data collected at specific regular intervals. • They can be used to predict future values based on previous observations. • Time series must have only one variable: the time. DEFINITION
graphs. • Other information can be o v e r l a p p e d t o f i n d correlations. • They are indispensable in the search for patterns (graphical or numerical). REPRESENTATION
• Models recognition. • Weather or earthquake forecast. • Astronomy and in any sector of applied science and engineering. • IoT and industrial applications. USAGE
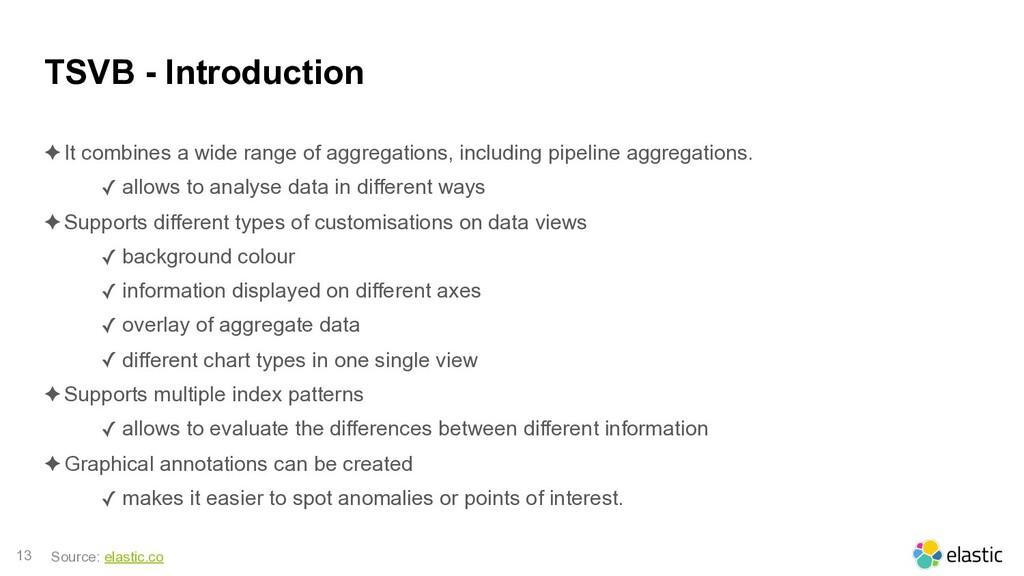
of aggregations, including pipeline aggregations. ✓ allows to analyse data in different ways ✦ Supports different types of customisations on data views ✓ background colour ✓ information displayed on different axes ✓ overlay of aggregate data ✓ different chart types in one single view ✦ Supports multiple index patterns ✓ allows to evaluate the differences between different information ✦ Graphical annotations can be created ✓ makes it easier to spot anomalies or points of interest. Source: elastic.co
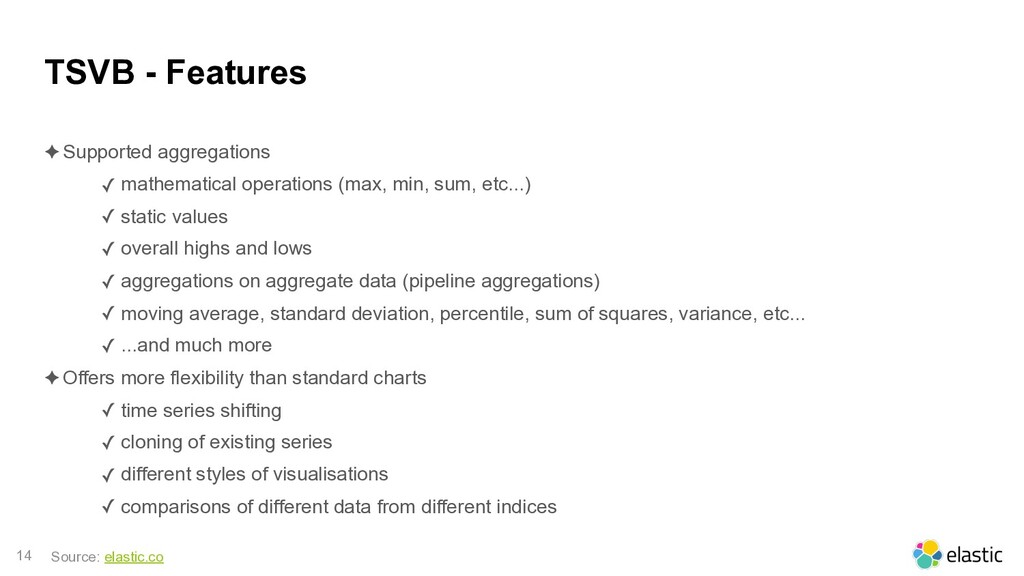
(max, min, sum, etc...) ✓ static values ✓ overall highs and lows ✓ aggregations on aggregate data (pipeline aggregations) ✓ moving average, standard deviation, percentile, sum of squares, variance, etc... ✓ ...and much more ✦ Offers more flexibility than standard charts ✓ time series shifting ✓ cloning of existing series ✓ different styles of visualisations ✓ comparisons of different data from different indices Source: elastic.co
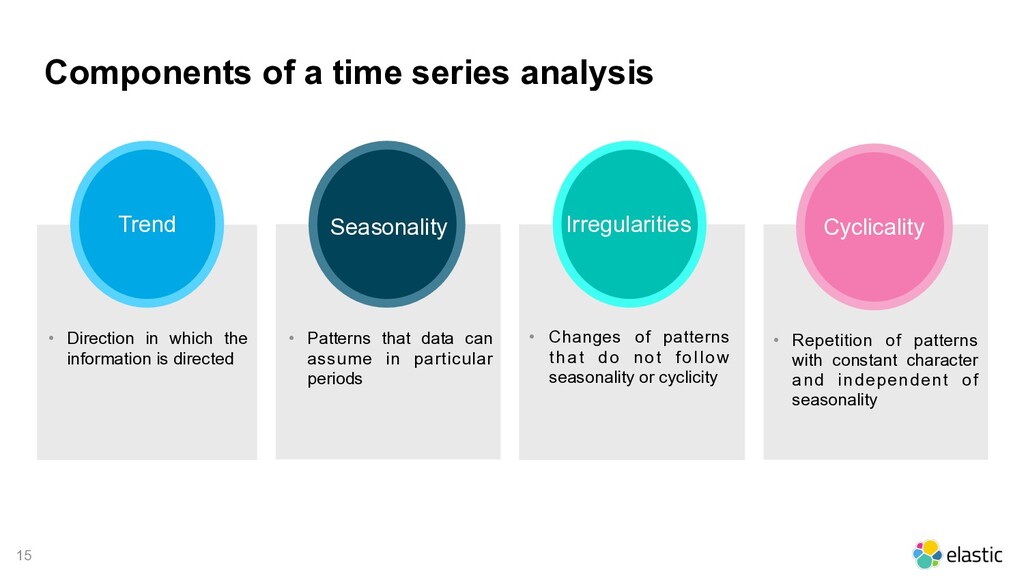
in which the information is directed Irregularities • Changes of patterns that do not follow seasonality or cyclicity • Patterns that data can assume in particular periods Cyclicality • Repetition of patterns with constant character and independent of seasonality Seasonality
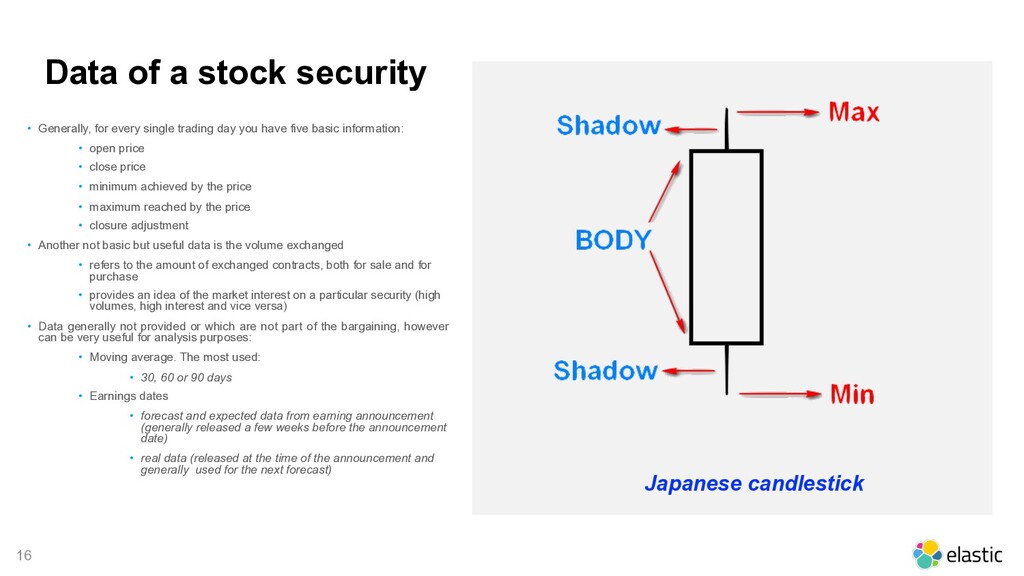
single trading day you have five basic information: • open price • close price • minimum achieved by the price • maximum reached by the price • closure adjustment • Another not basic but useful data is the volume exchanged • refers to the amount of exchanged contracts, both for sale and for purchase • provides an idea of the market interest on a particular security (high volumes, high interest and vice versa) • Data generally not provided or which are not part of the bargaining, however can be very useful for analysis purposes: • Moving average. The most used: • 30, 60 or 90 days • Earnings dates • forecast and expected data from earning announcement (generally released a few weeks before the announcement date) • real data (released at the time of the announcement and generally used for the next forecast) Japanese candlestick
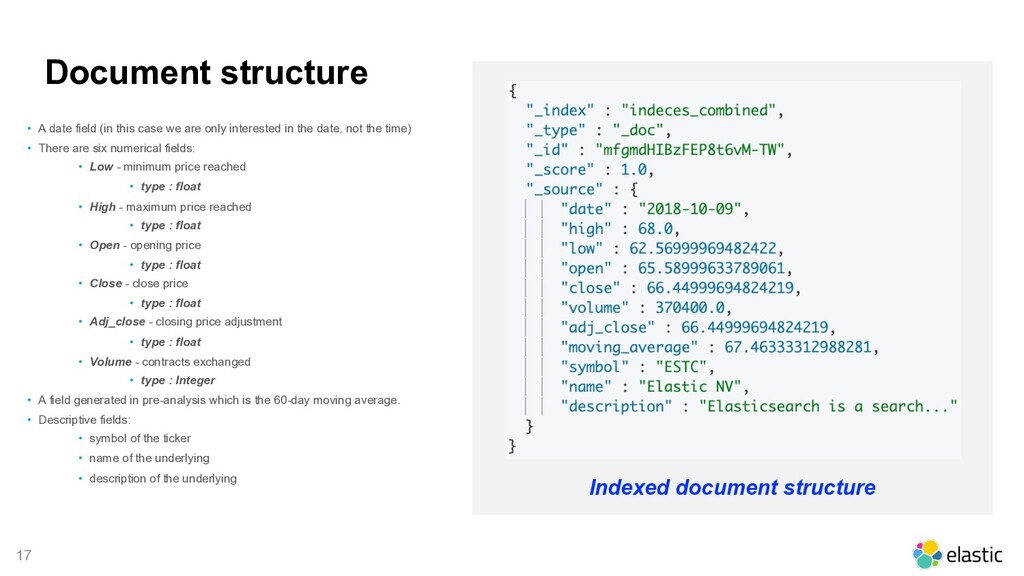
we are only interested in the date, not the time) • There are six numerical fields: • Low - minimum price reached • type : float • High - maximum price reached • type : float • Open - opening price • type : float • Close - close price • type : float • Adj_close - closing price adjustment • type : float • Volume - contracts exchanged • type : Integer • A field generated in pre-analysis which is the 60-day moving average. • Descriptive fields: • symbol of the ticker • name of the underlying • description of the underlying Indexed document structure
information purposes only. Neither Elastic nor the author can guarantee the accuracy of the data or information provided, when applied in specific circumstances. If any individual or entity chooses to utilise the information or data provided in this presentation, they do so at their own risk. No liability will be accepted by Elastic or the author for any claims, losses, damages or costs (arising directly or indirectly) howsoever caused by any reliance on the data or information provided in this presentation. The contents of this presentation belong to Elastic and/or the author and may not be reproduced without express written consent. Source: elastic.co
freely downloadable and usable without restriction, at the following github address: https://github.com/lucagennari-es/time-series-data-meetup.git GitHub page: https://github.com/lucagennari-es/time-series-data-meetup Source: elastic.co