Manji role: Software Engineer team: Verda Reliability Engineering team activities: - Development of monitoring system - Direction of incident handling - Implement of on-call system - User support and training - and more manji0 manji0#9999
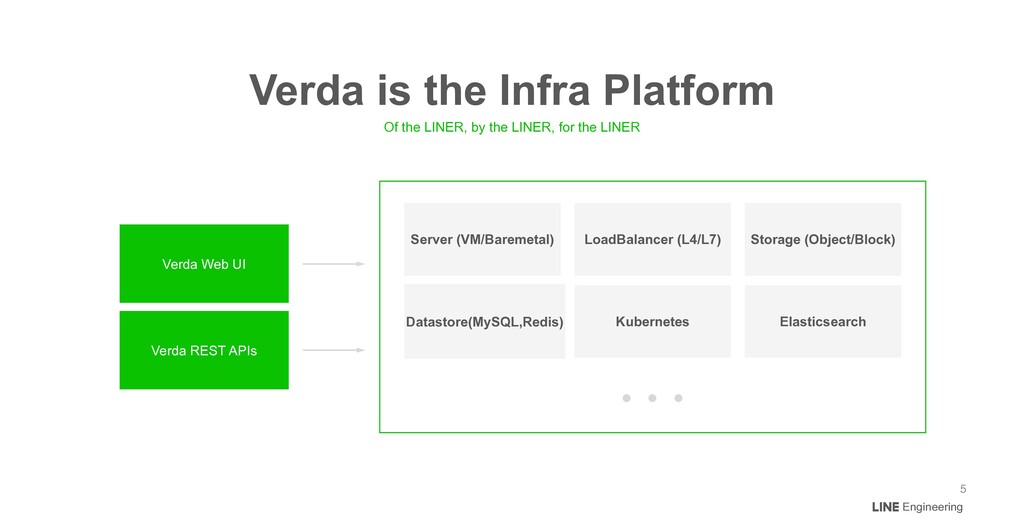
Verda is the Infra Platform 5 Verda Web UI Verda REST APIs Server (VM/Baremetal) LoadBalancer (L4/L7) Storage (Object/Block) Datastore(MySQL,Redis) Kubernetes Elasticsearch ɾɾɾ
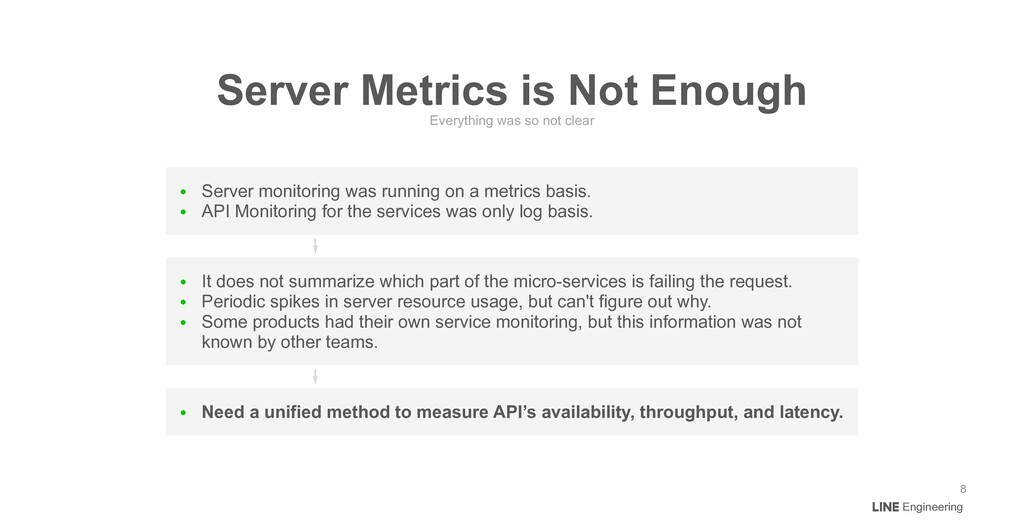
API Monitoring for the services was only log basis. • It does not summarize which part of the micro-services is failing the request. • Periodic spikes in server resource usage, but can't figure out why. • Some products had their own service monitoring, but this information was not known by other teams. • Need a unified method to measure API’s availability, throughput, and latency. Everything was so not clear Server Metrics is Not Enough Engineering 8
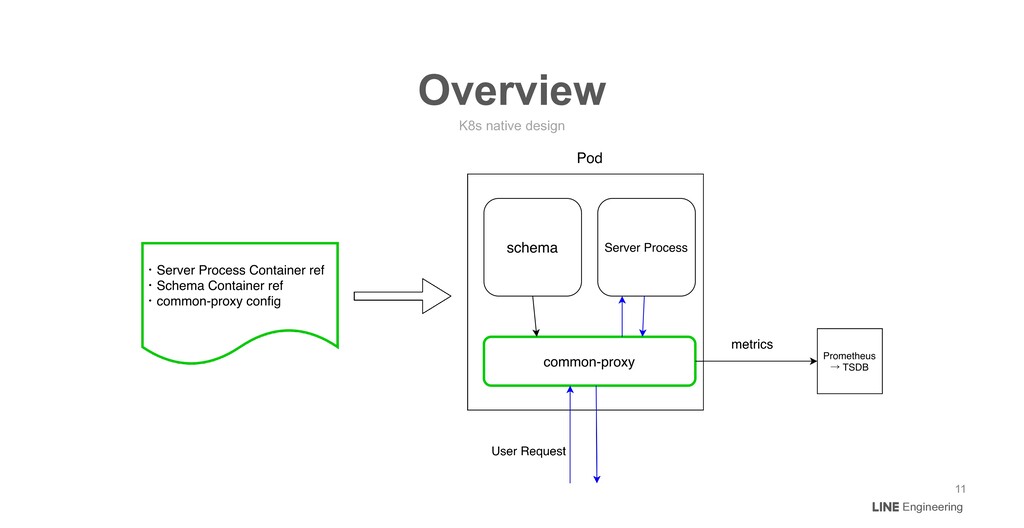
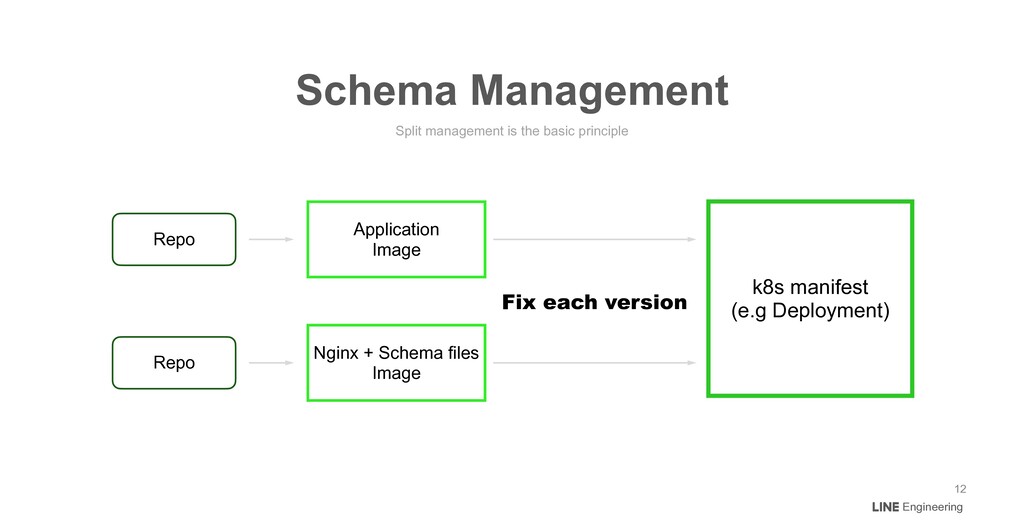
of them. • The same can be done for other services by introducing the proxy and schema. • Verda k8s team developed “verda-common-proxy”, that is simple http-proxy sidecar that supports exporting metrics defined by OpenAPI schema. • Some components already use the proxy for collecting access log. That is a sidecar proxy We Already Have the Solution Engineering 9
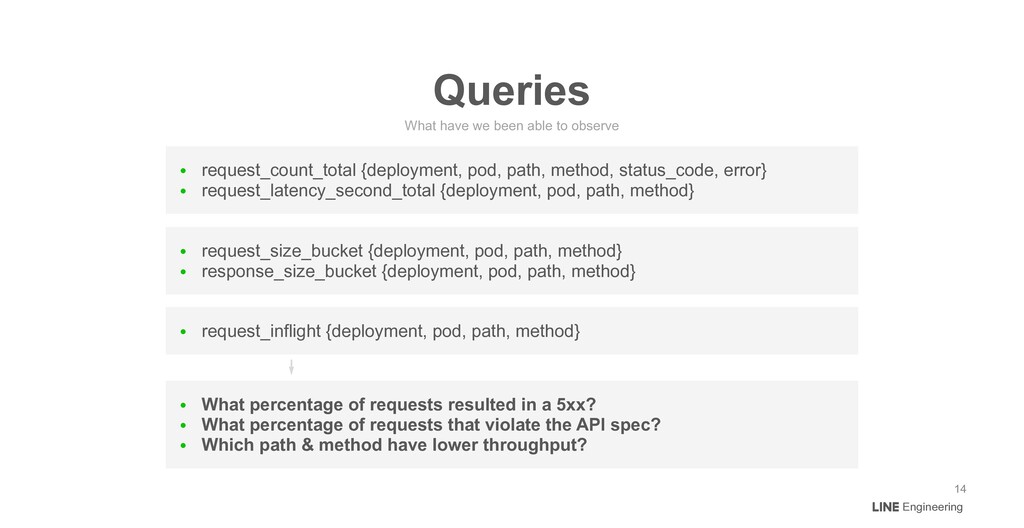
{deployment, pod, path, method} • request_inflight {deployment, pod, path, method} What have we been able to observe Queries Engineering 14 • request_size_bucket {deployment, pod, path, method} • response_size_bucket {deployment, pod, path, method} • What percentage of requests resulted in a 5xx? • What percentage of requests that violate the API spec? • Which path & method have lower throughput?
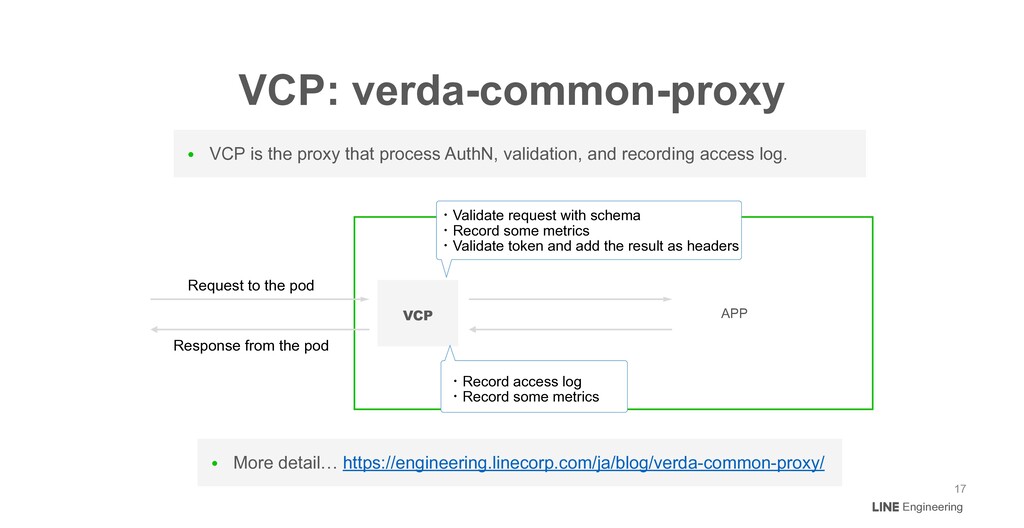
recording access log. VCP: verda-common-proxy Engineering 17 • More detail… https://engineering.linecorp.com/ja/blog/verda-common-proxy/ VCP APP ɾValidate request with schema ɾRecord some metrics ɾValidate token and add the result as headers ɾRecord access log ɾRecord some metrics Request to the pod Response from the pod
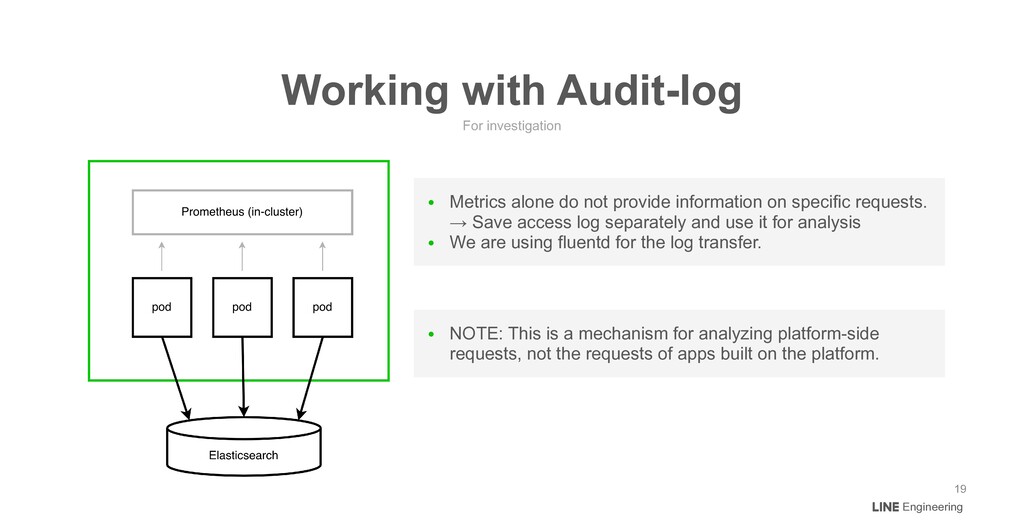
do not provide information on specific requests. → Save access log separately and use it for analysis • We are using fluentd for the log transfer. • NOTE: This is a mechanism for analyzing platform-side requests, not the requests of apps built on the platform.
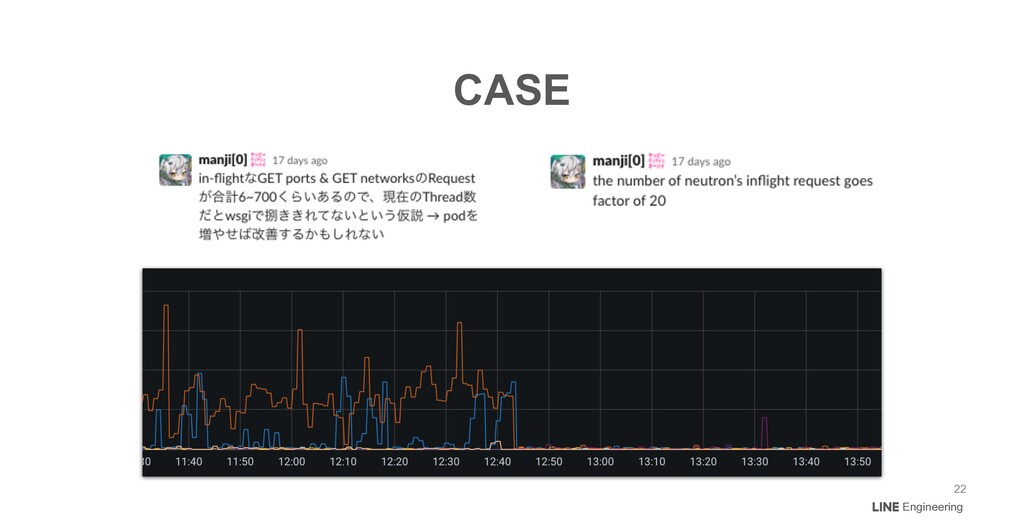
API endpoint referenced by HV, and the load on the new endpoint's resources skyrocketed. • The failure rate of networking management API increased dramatically, greatly affecting the creation of VMs and other services. • Solved by calculating the throughput from the API Monitoring values and scaling the pod to an appropriate value. CASE Engineering 21
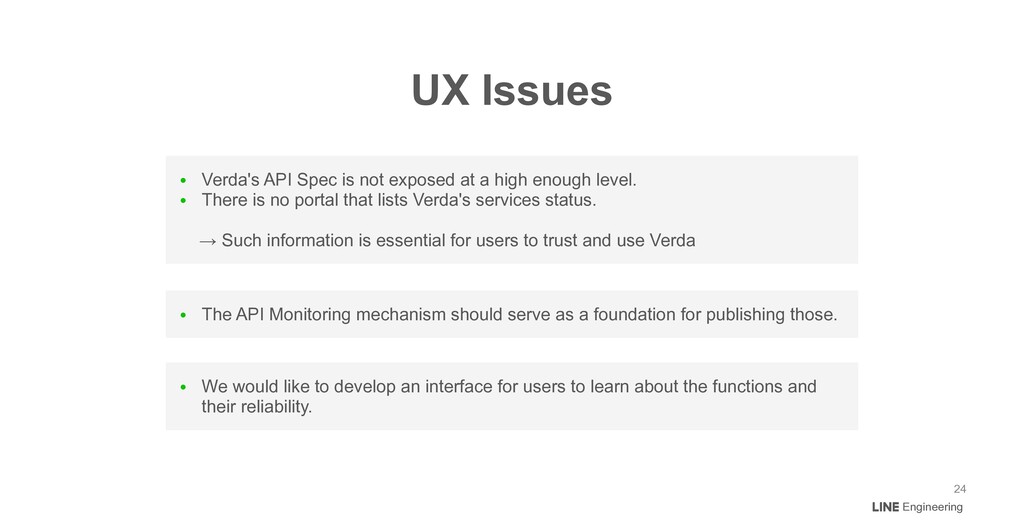
for publishing those. • Verda's API Spec is not exposed at a high enough level. • There is no portal that lists Verda's services status. → Such information is essential for users to trust and use Verda • We would like to develop an interface for users to learn about the functions and their reliability. UX Issues Engineering 24
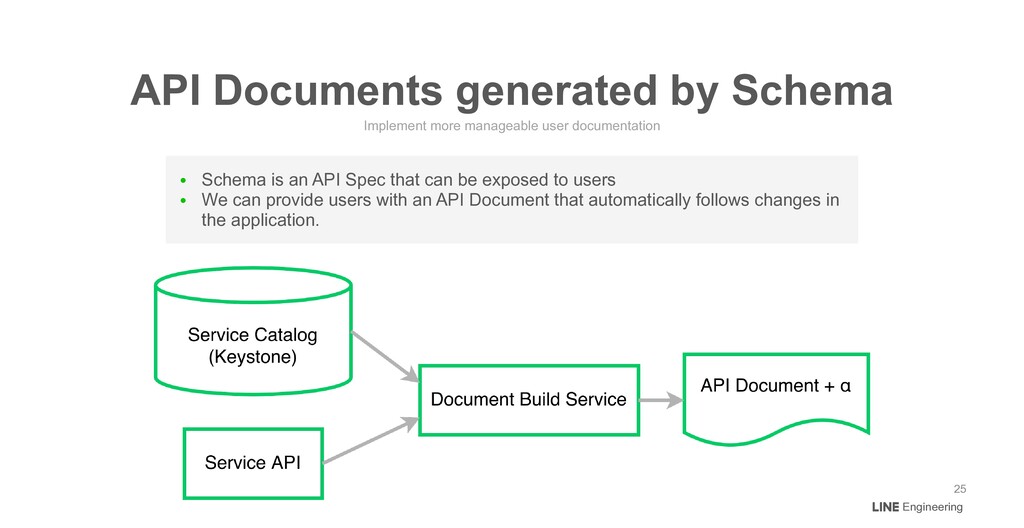
to users • We can provide users with an API Document that automatically follows changes in the application. Implement more manageable user documentation API Documents generated by Schema Engineering 25
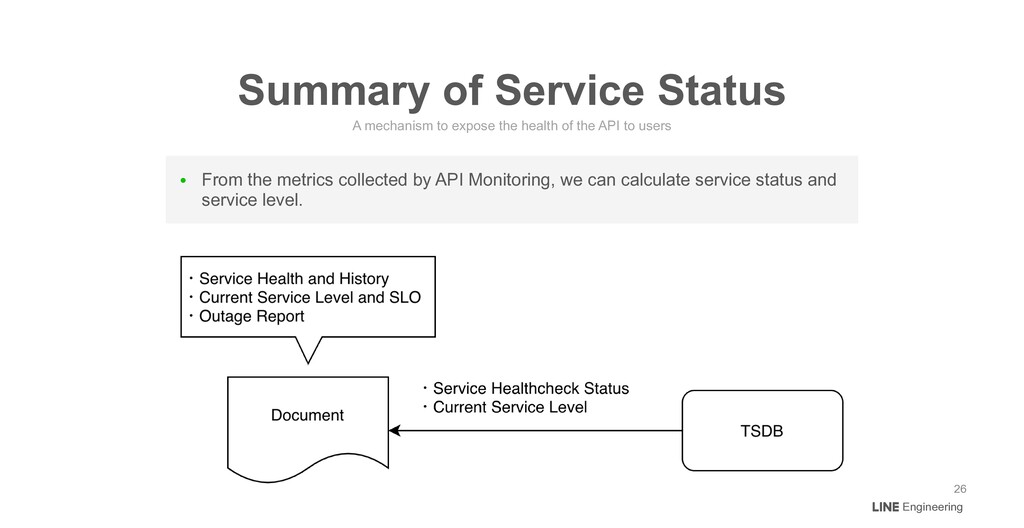
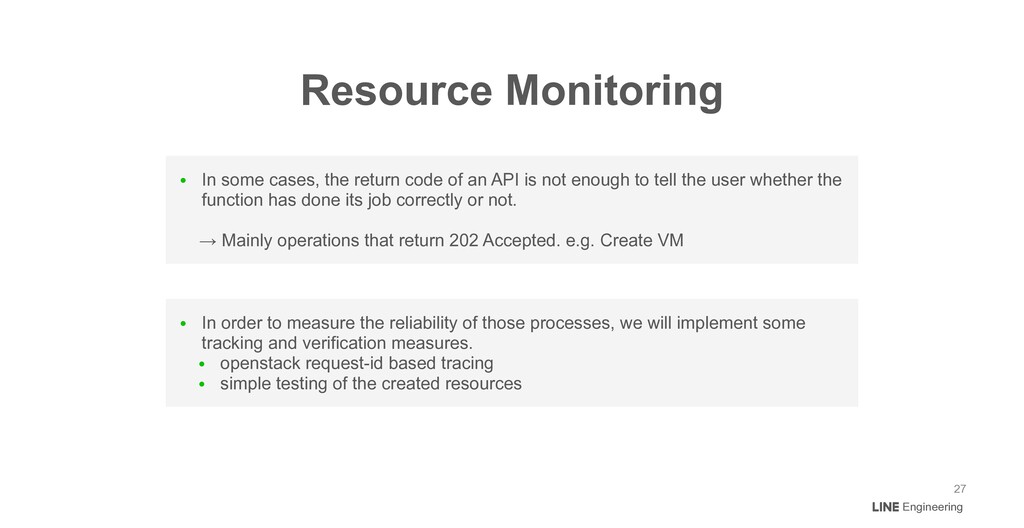
is not enough to tell the user whether the function has done its job correctly or not. → Mainly operations that return 202 Accepted. e.g. Create VM • In order to measure the reliability of those processes, we will implement some tracking and verification measures. • openstack request-id based tracing • simple testing of the created resources Resource Monitoring Engineering 27
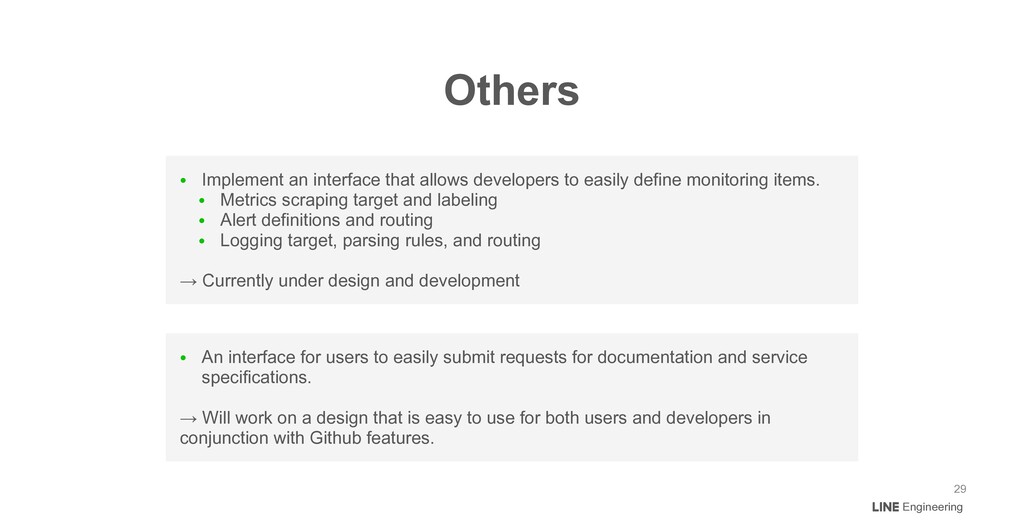
monitoring items. • Metrics scraping target and labeling • Alert definitions and routing • Logging target, parsing rules, and routing → Currently under design and development • An interface for users to easily submit requests for documentation and service specifications. → Will work on a design that is easy to use for both users and developers in conjunction with Github features. Others Engineering 29
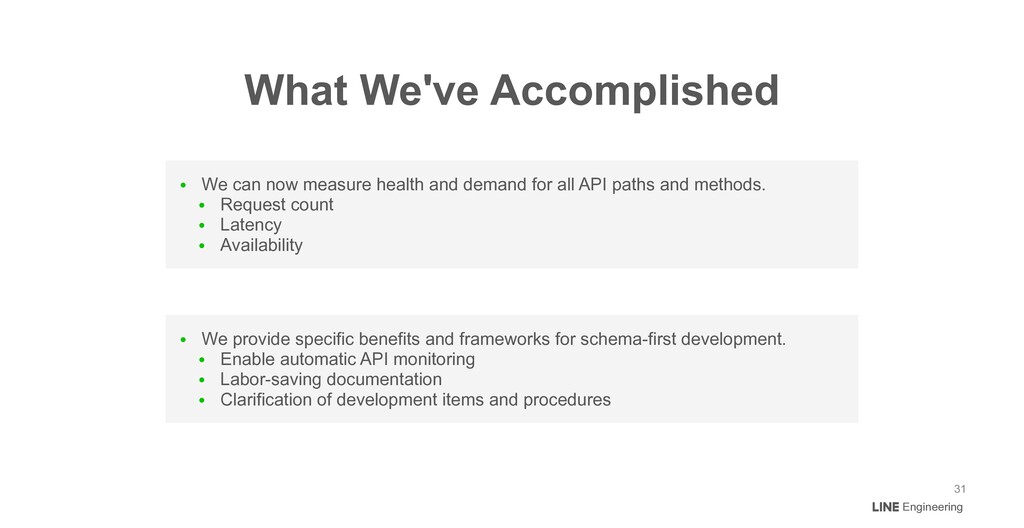
API paths and methods. • Request count • Latency • Availability • We provide specific benefits and frameworks for schema-first development. • Enable automatic API monitoring • Labor-saving documentation • Clarification of development items and procedures What We've Accomplished Engineering 31
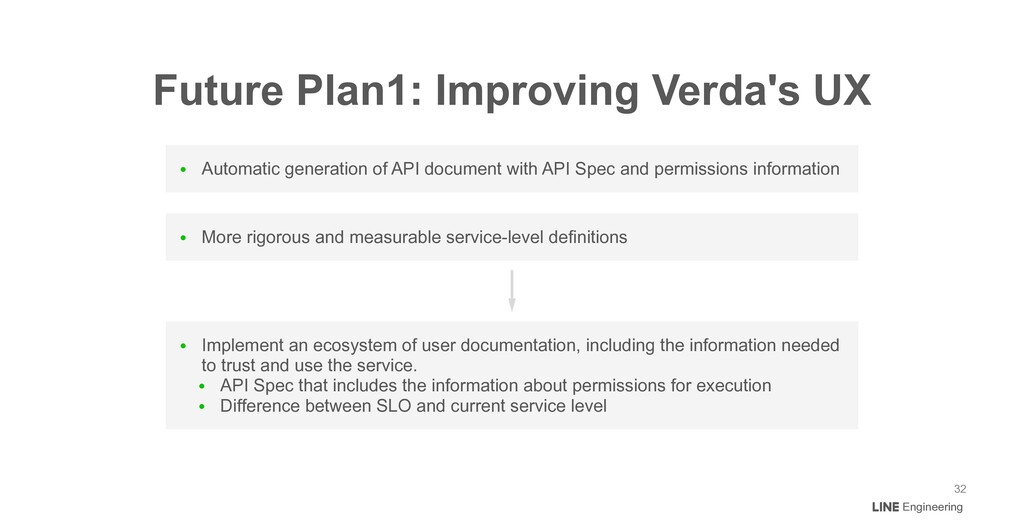
permissions information • More rigorous and measurable service-level definitions Future Plan1: Improving Verda's UX Engineering 32 • Implement an ecosystem of user documentation, including the information needed to trust and use the service. • API Spec that includes the information about permissions for execution • Difference between SLO and current service level
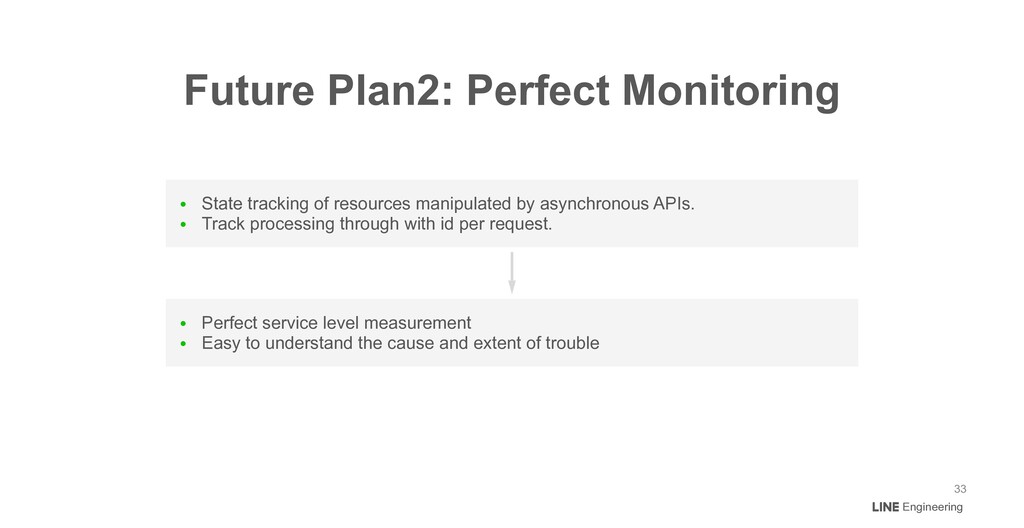
Track processing through with id per request. • Perfect service level measurement • Easy to understand the cause and extent of trouble Future Plan2: Perfect Monitoring Engineering 33