@ LINE Taiwan › SRE Team › Loves Linux Networking, Distributed Systems & Open Source Wei › Site Reliability Engineer @ LINE Taiwan › SRE Team › A Gopher, interested in Kubernetes and Serverless › Sometimes contribute Open Source project.
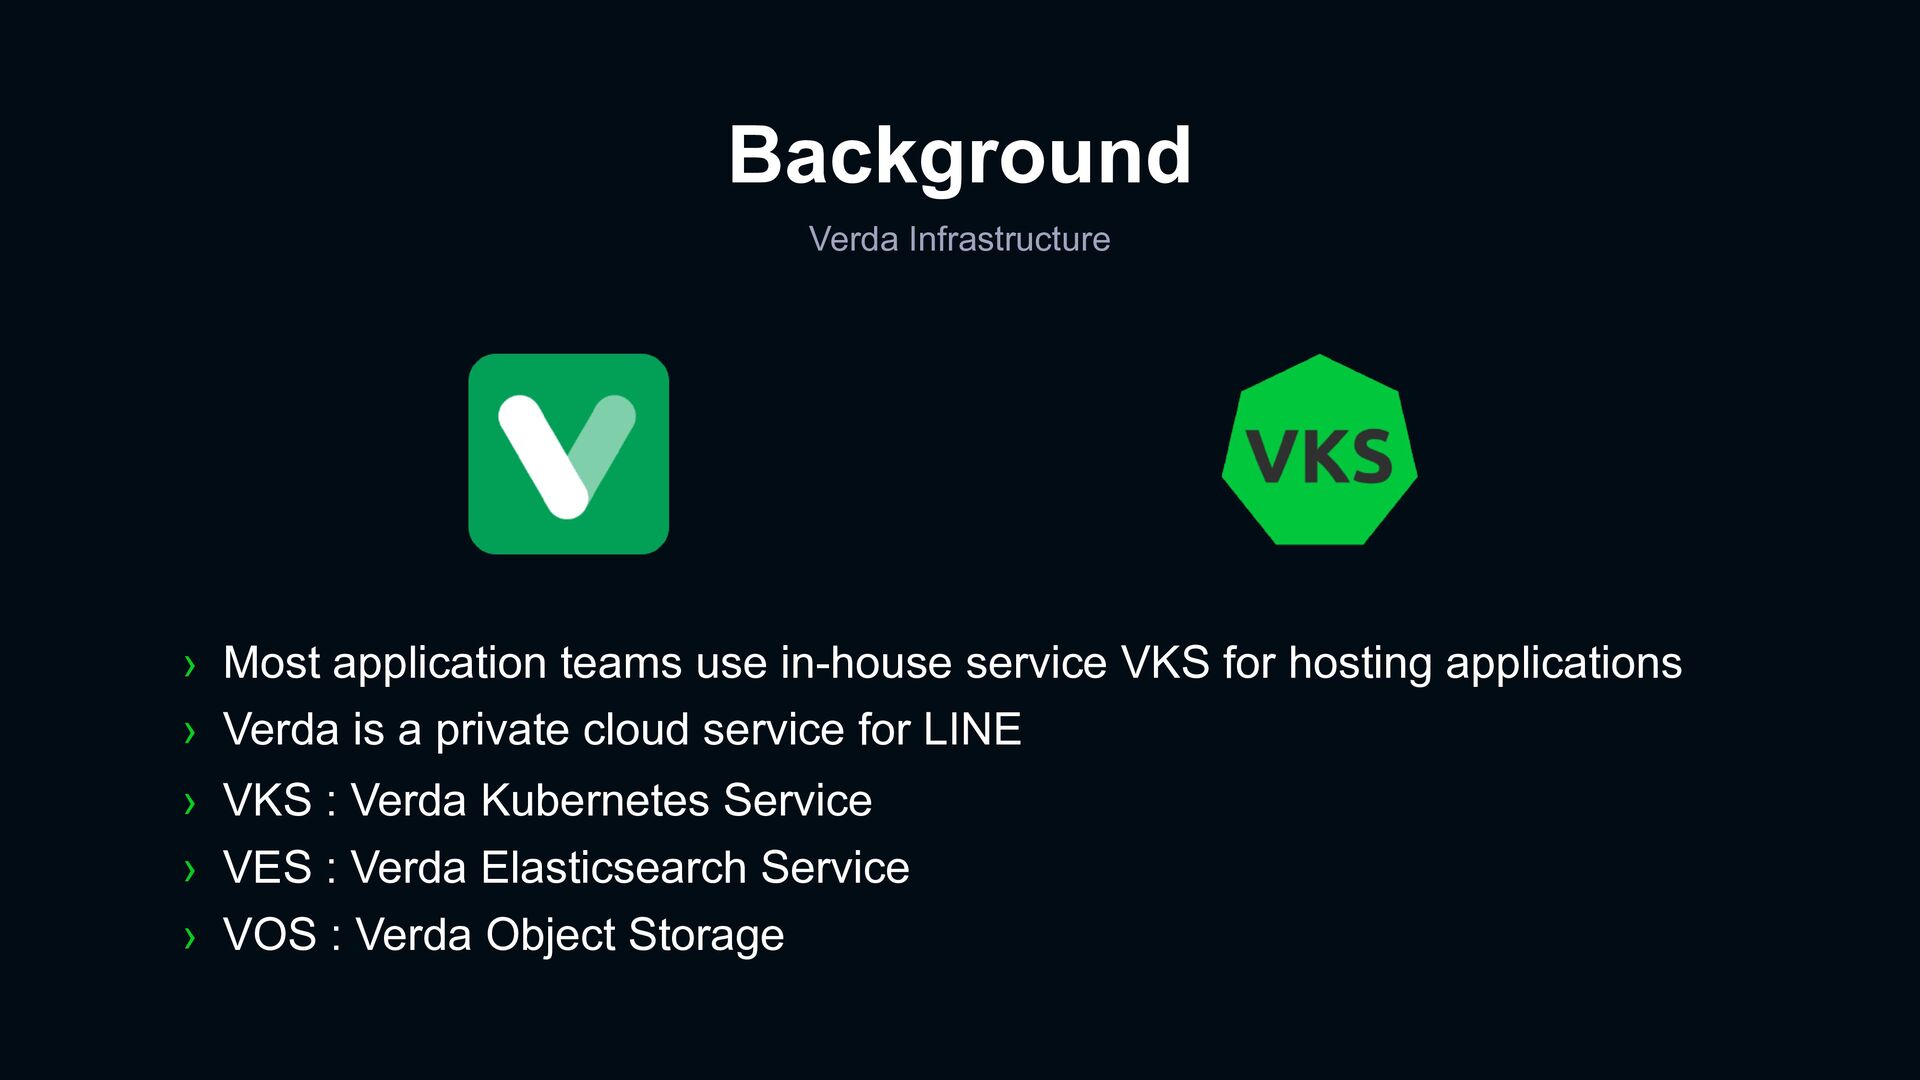
VES : Verda Elasticsearch Service › VOS : Verda Object Storage › Most application teams use in-house service VKS for hosting applications › Verda is a private cloud service for LINE
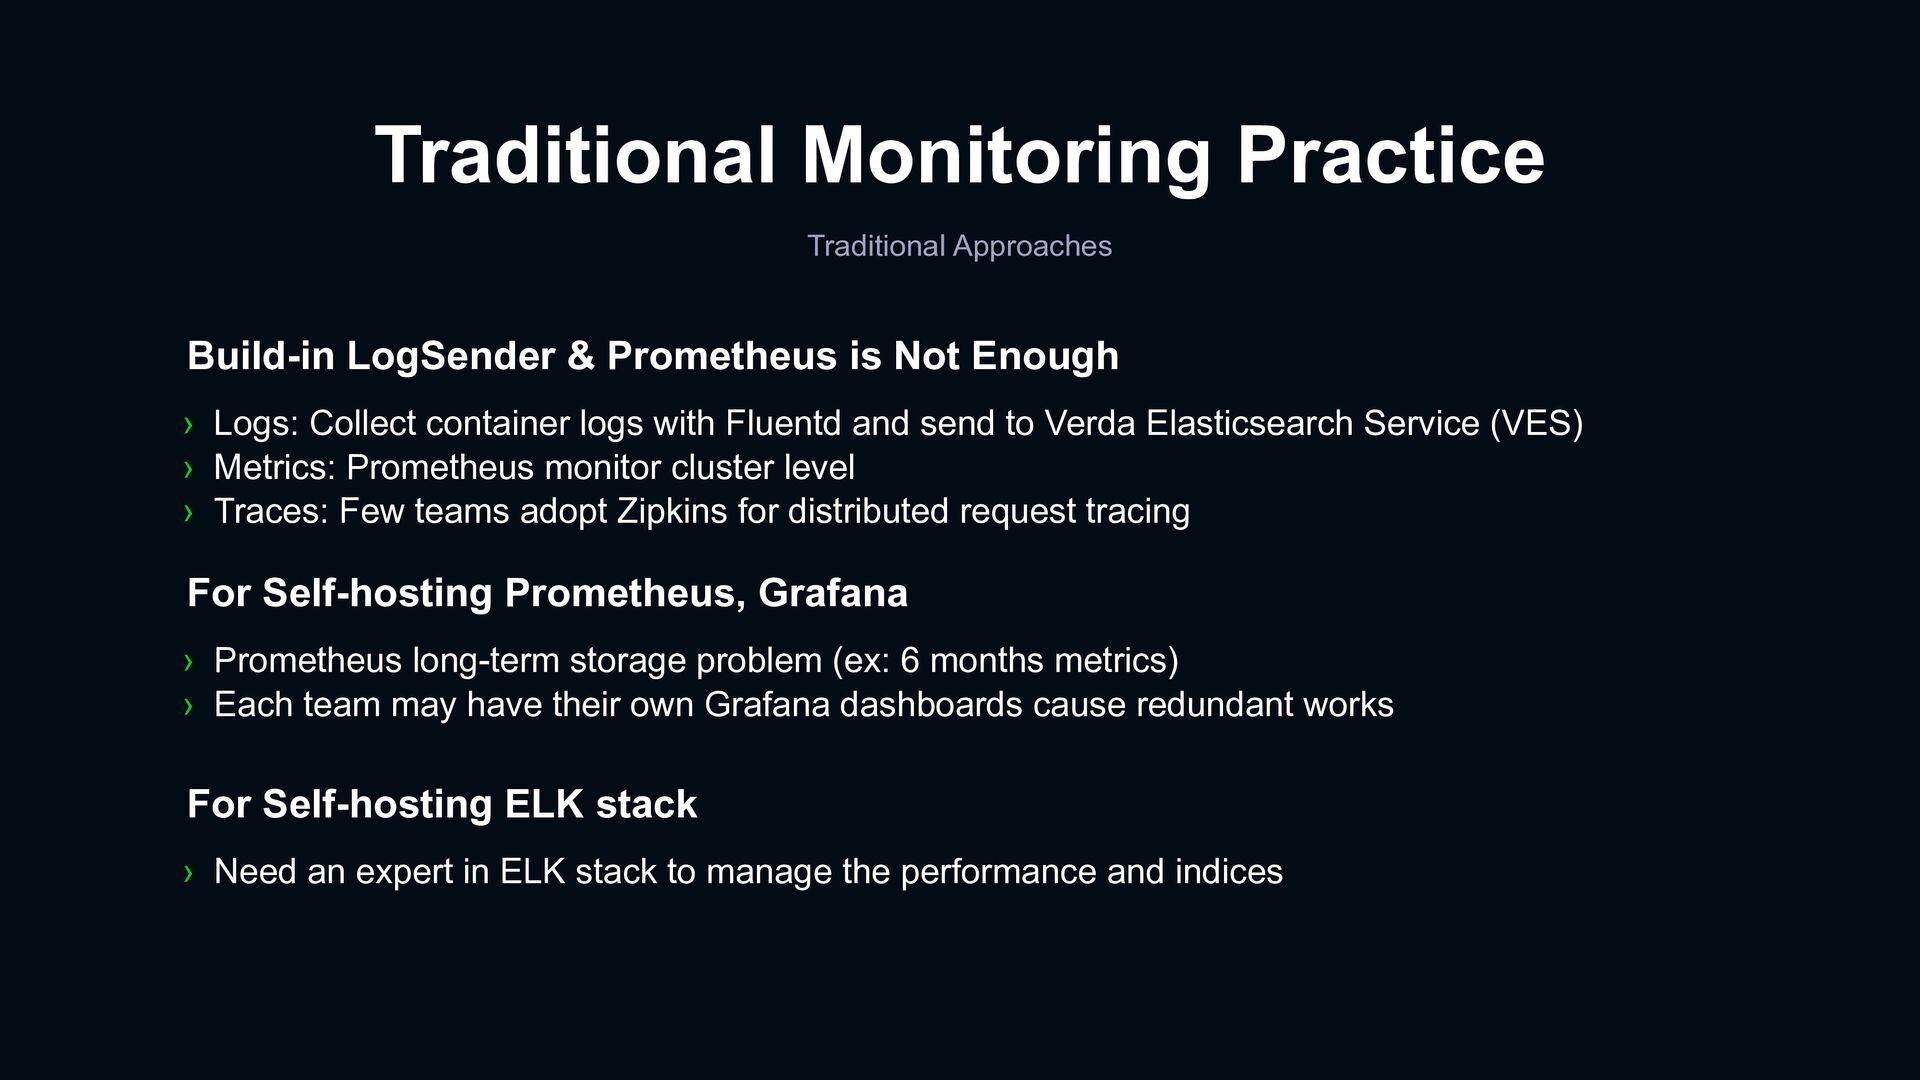
(ex: 6 months metrics) › Each team may have their own Grafana dashboards cause redundant works For Self-hosting Prometheus, Grafana For Self-hosting ELK stack › Need an expert in ELK stack to manage the performance and indices Build-in LogSender & Prometheus is Not Enough › Logs: Collect container logs with Fluentd and send to Verda Elasticsearch Service (VES) › Metrics: Prometheus monitor cluster level › Traces: Few teams adopt Zipkins for distributed request tracing
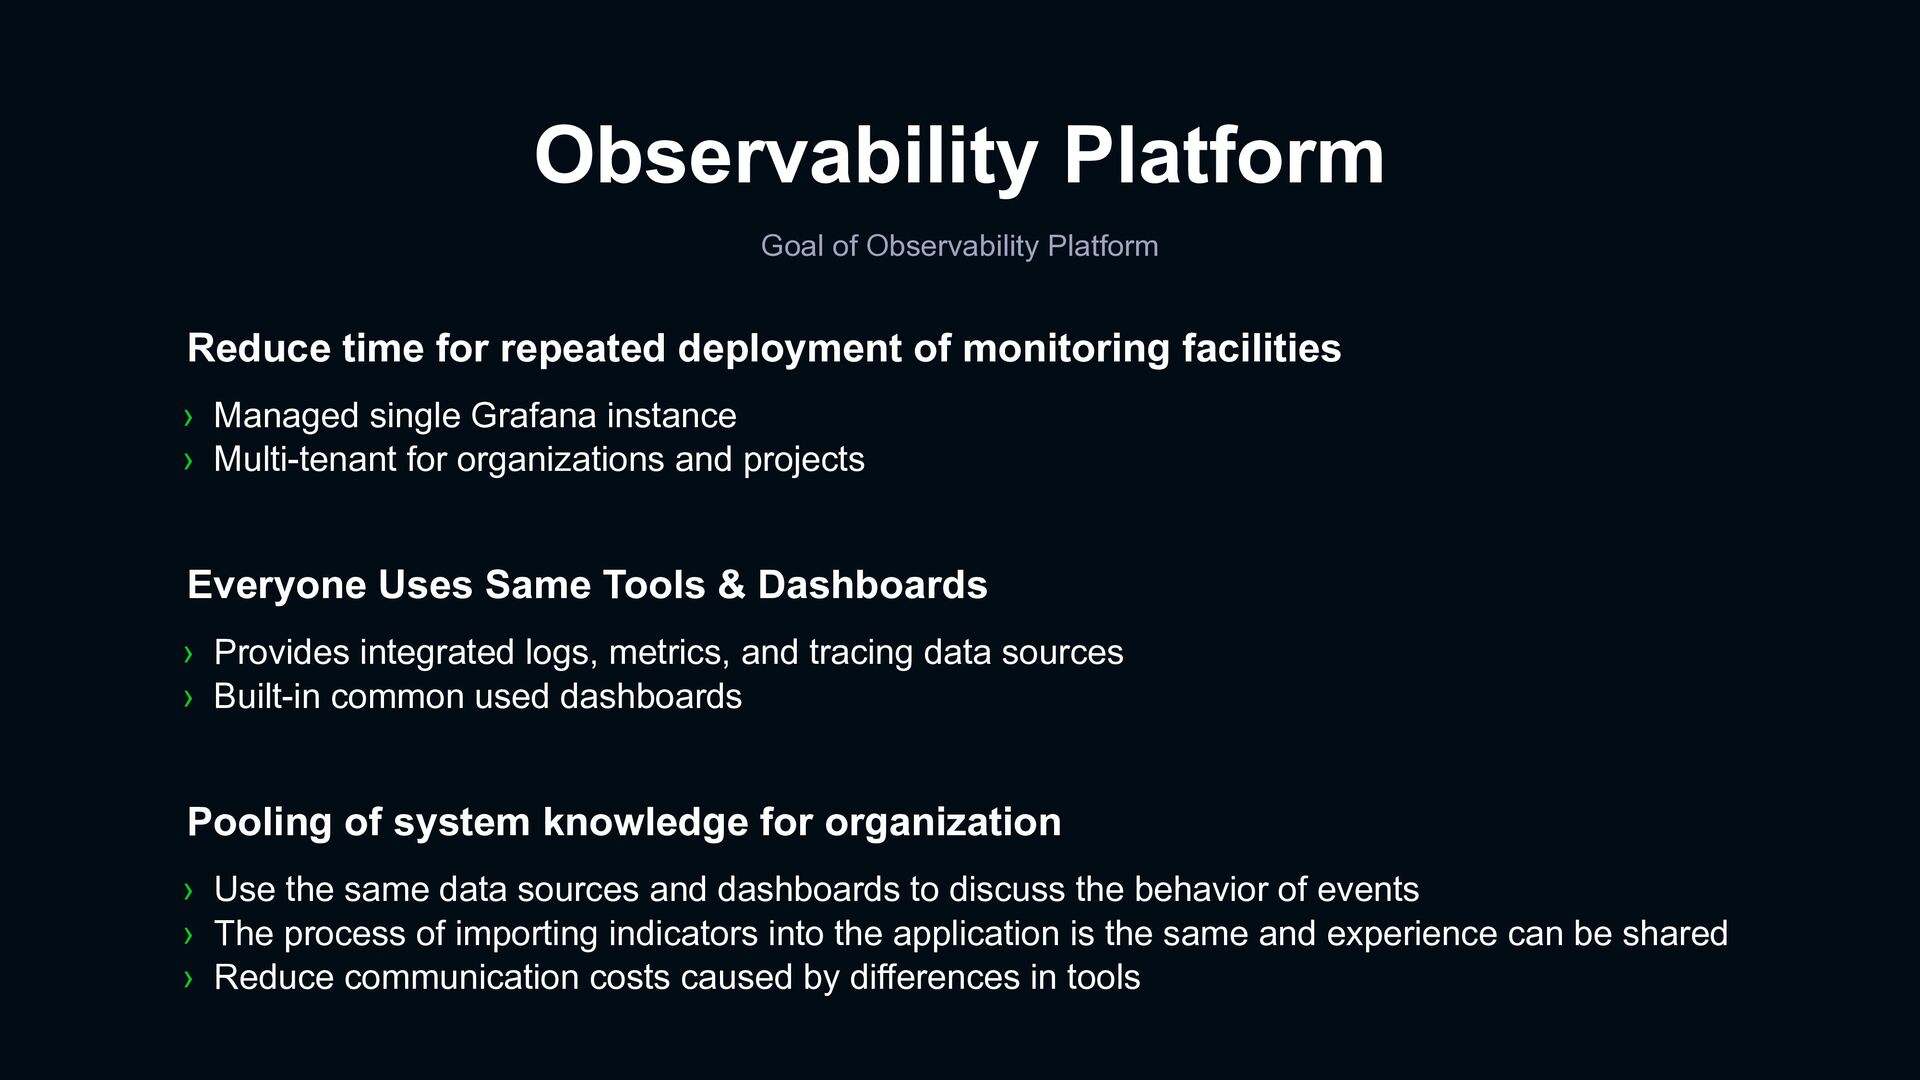
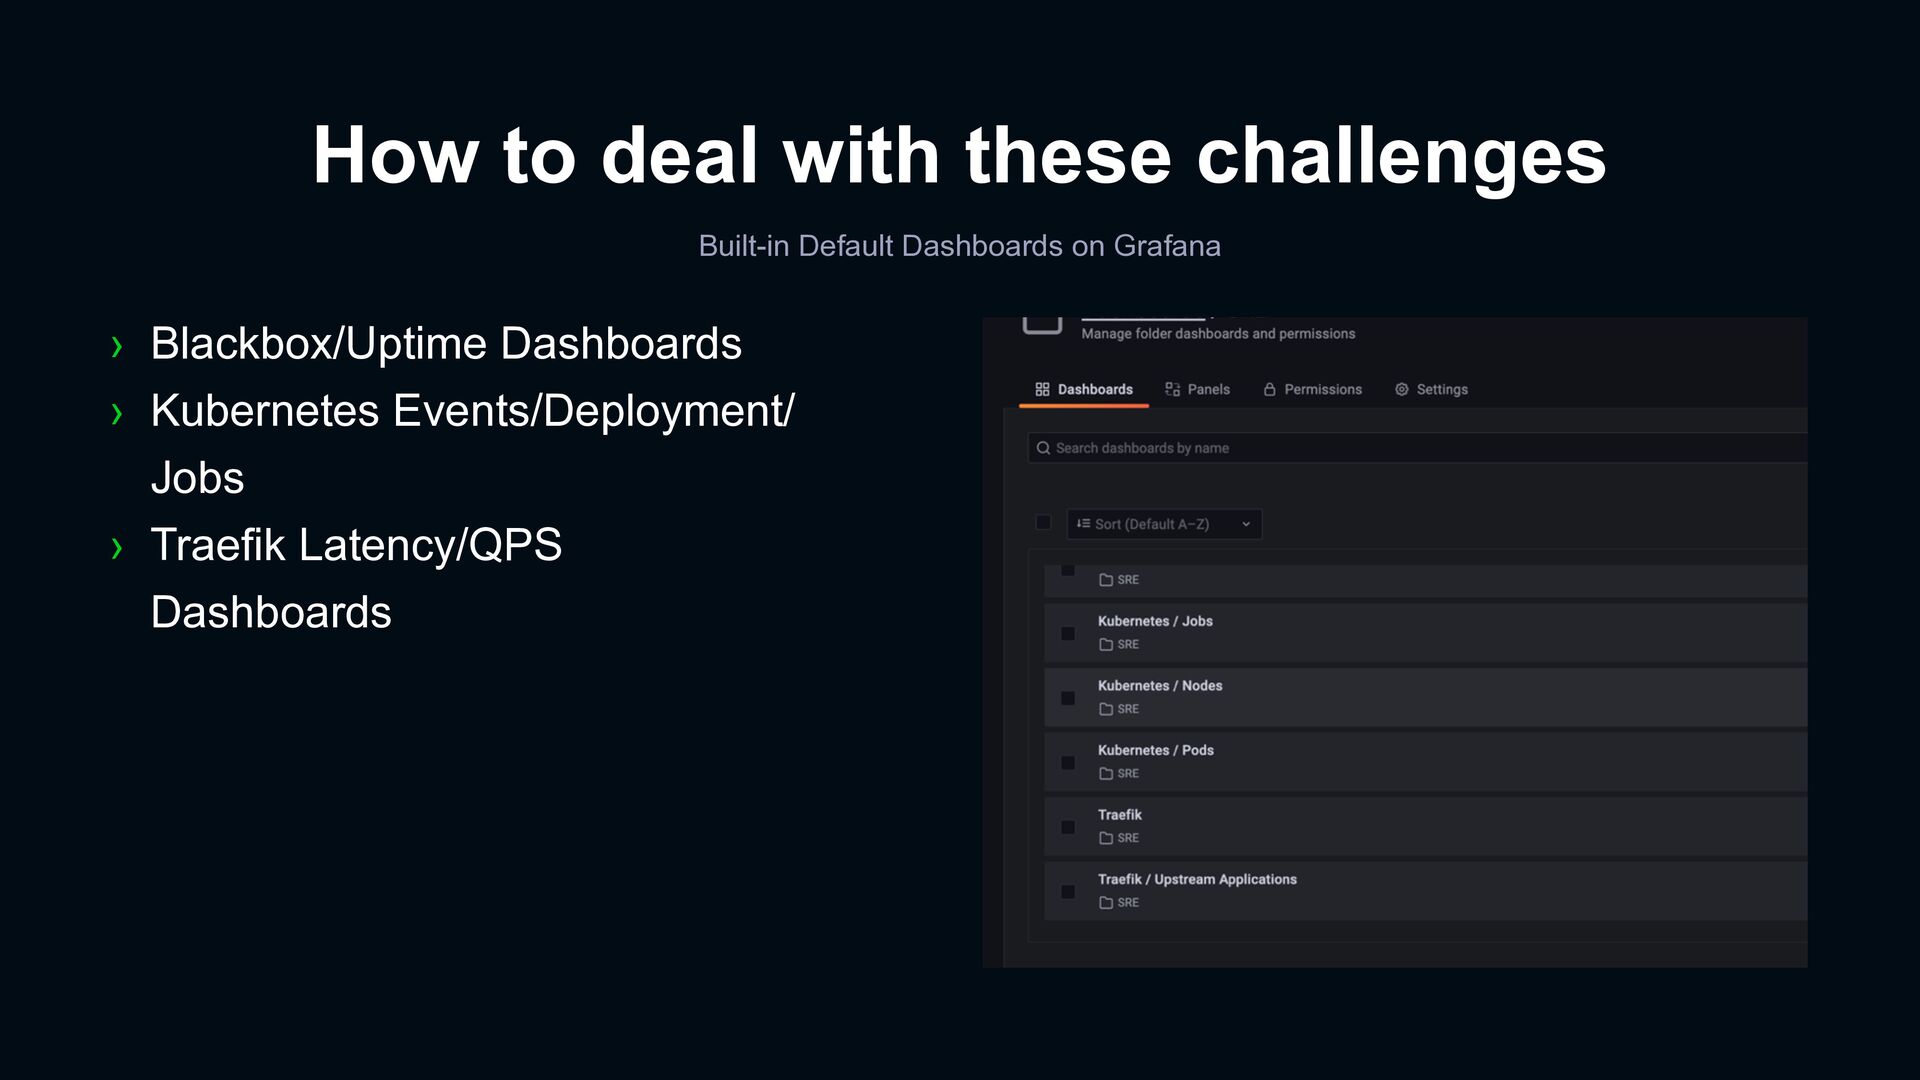
data sources and dashboards to discuss the behavior of events › The process of importing indicators into the application is the same and experience can be shared › Reduce communication costs caused by differences in tools Pooling of system knowledge for organization Everyone Uses Same Tools & Dashboards › Provides integrated logs, metrics, and tracing data sources › Built-in common used dashboards Reduce time for repeated deployment of monitoring facilities › Managed single Grafana instance › Multi-tenant for organizations and projects
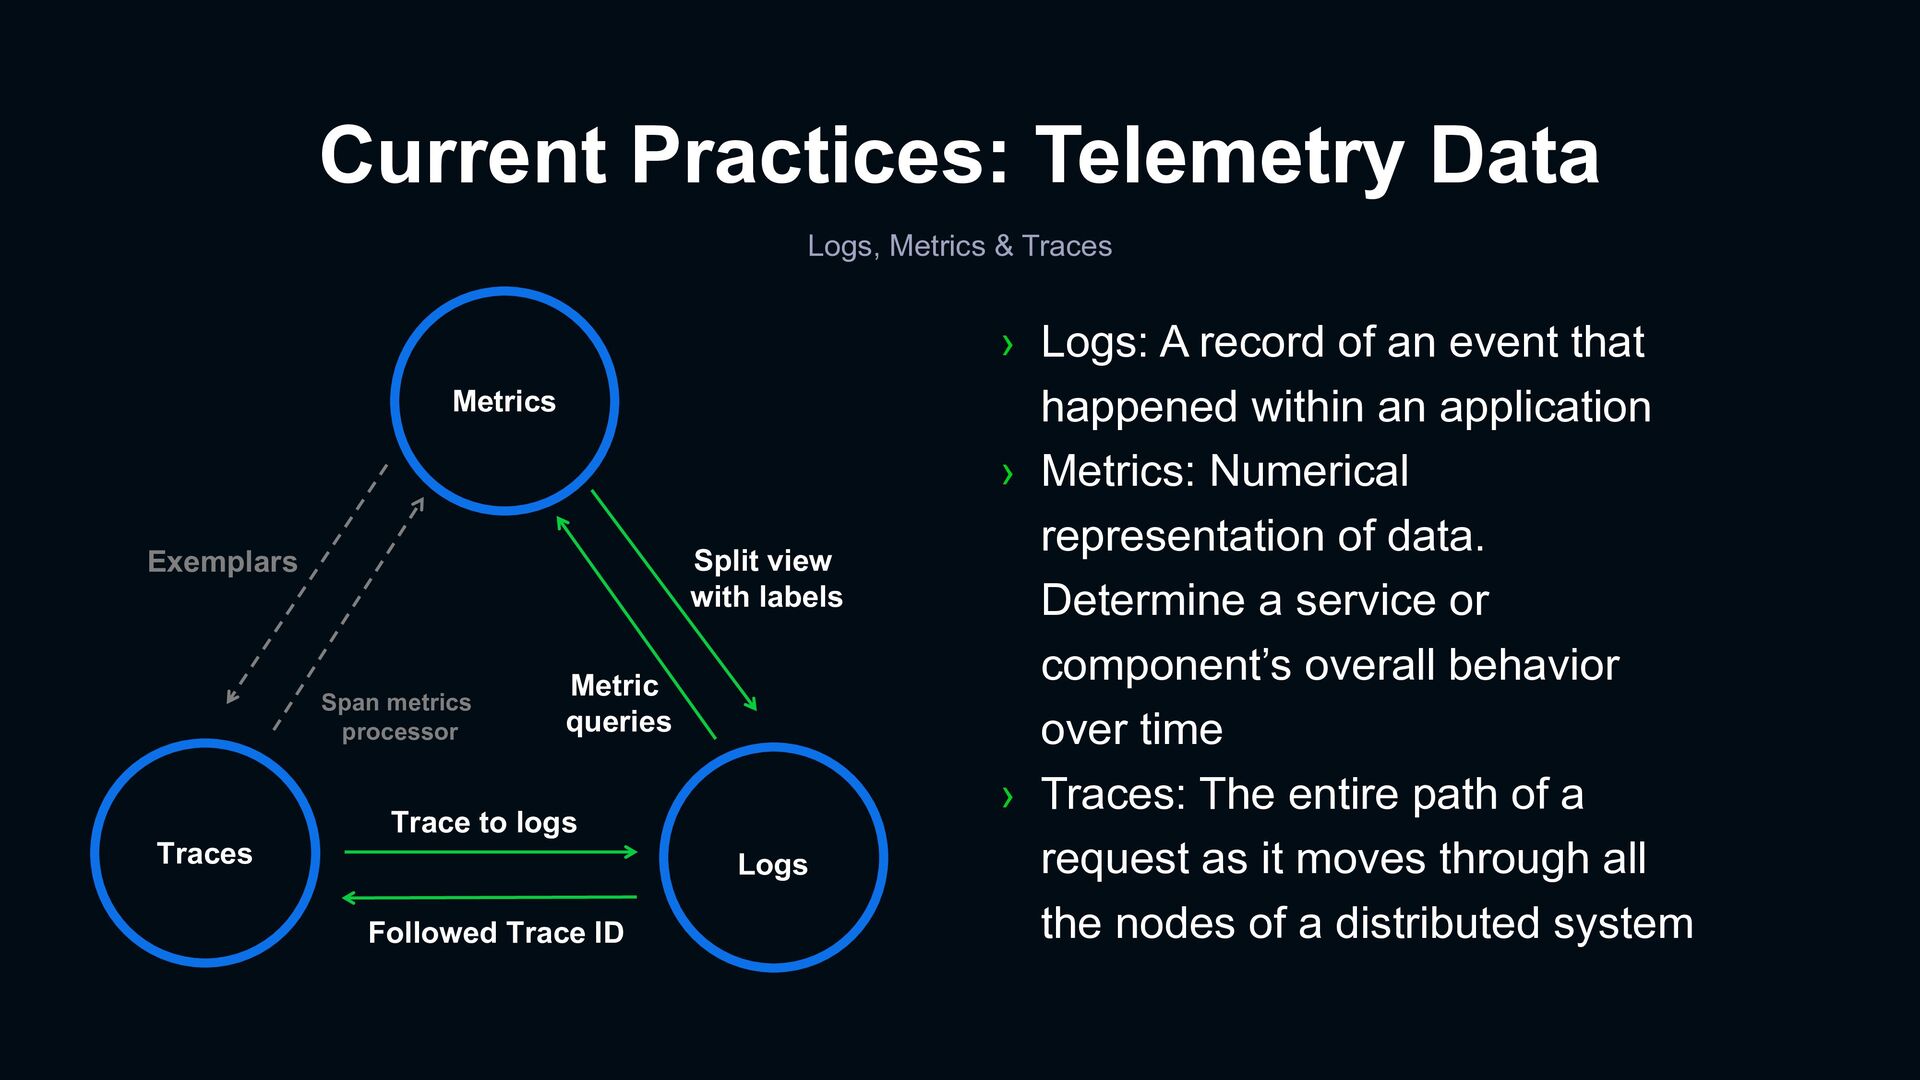
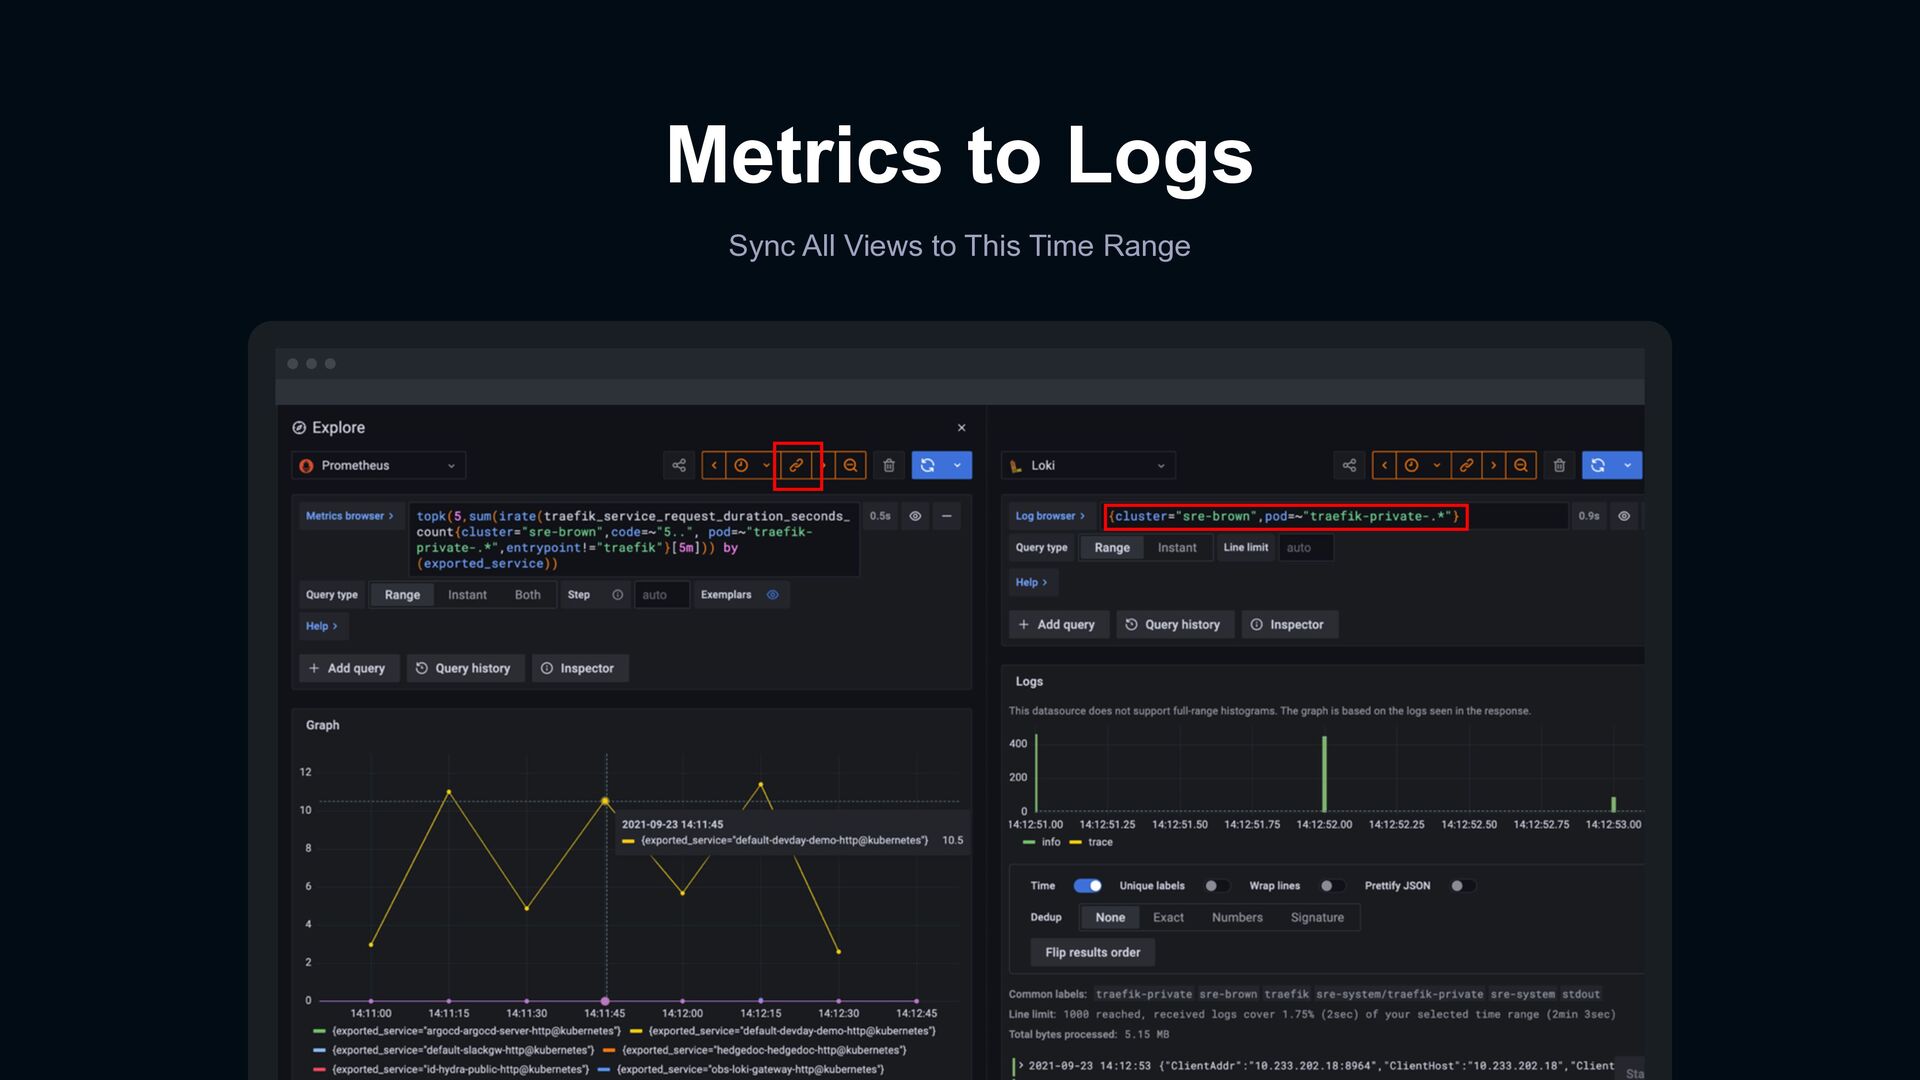
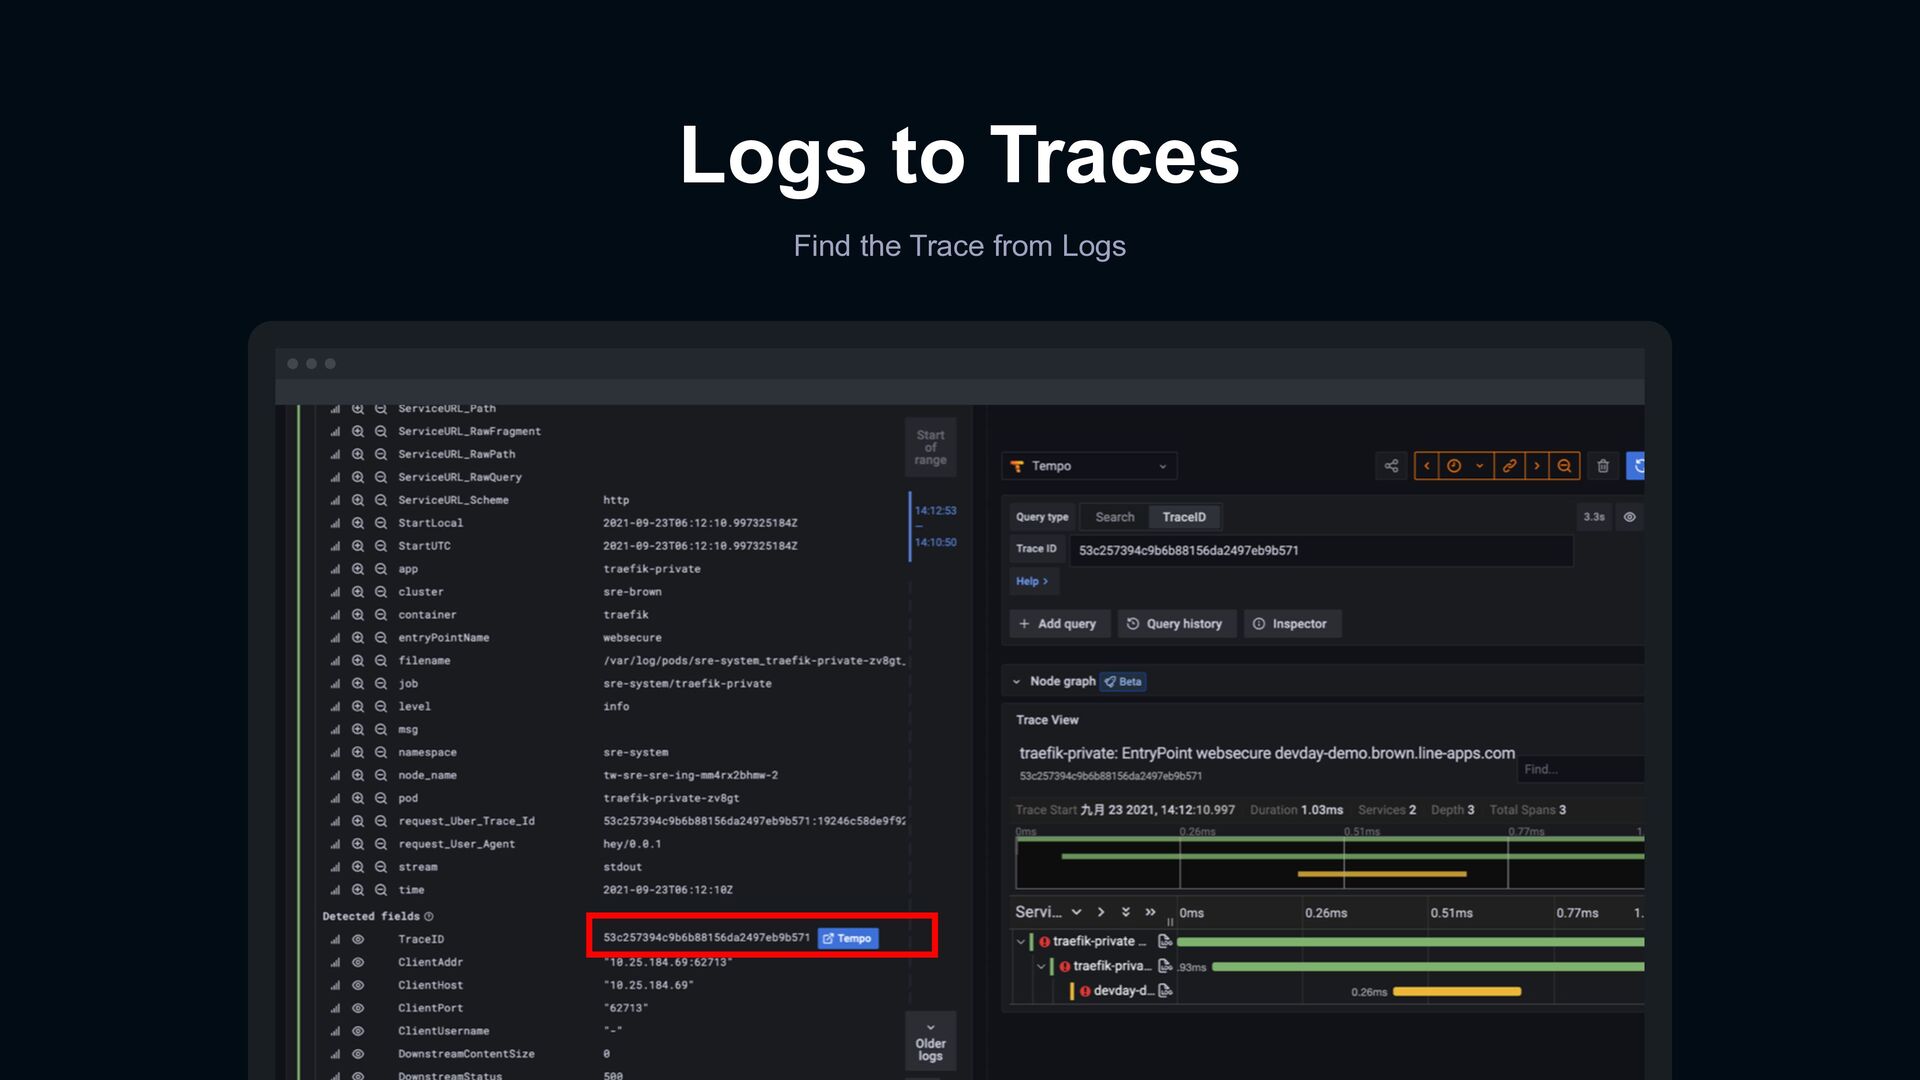
A record of an event that happened within an application › Metrics: Numerical representation of data. Determine a service or component’s overall behavior over time › Traces: The entire path of a request as it moves through all the nodes of a distributed system Exemplars Split view with labels Metric queries Span metrics processor Trace to logs Followed Trace ID Metrics Traces Logs
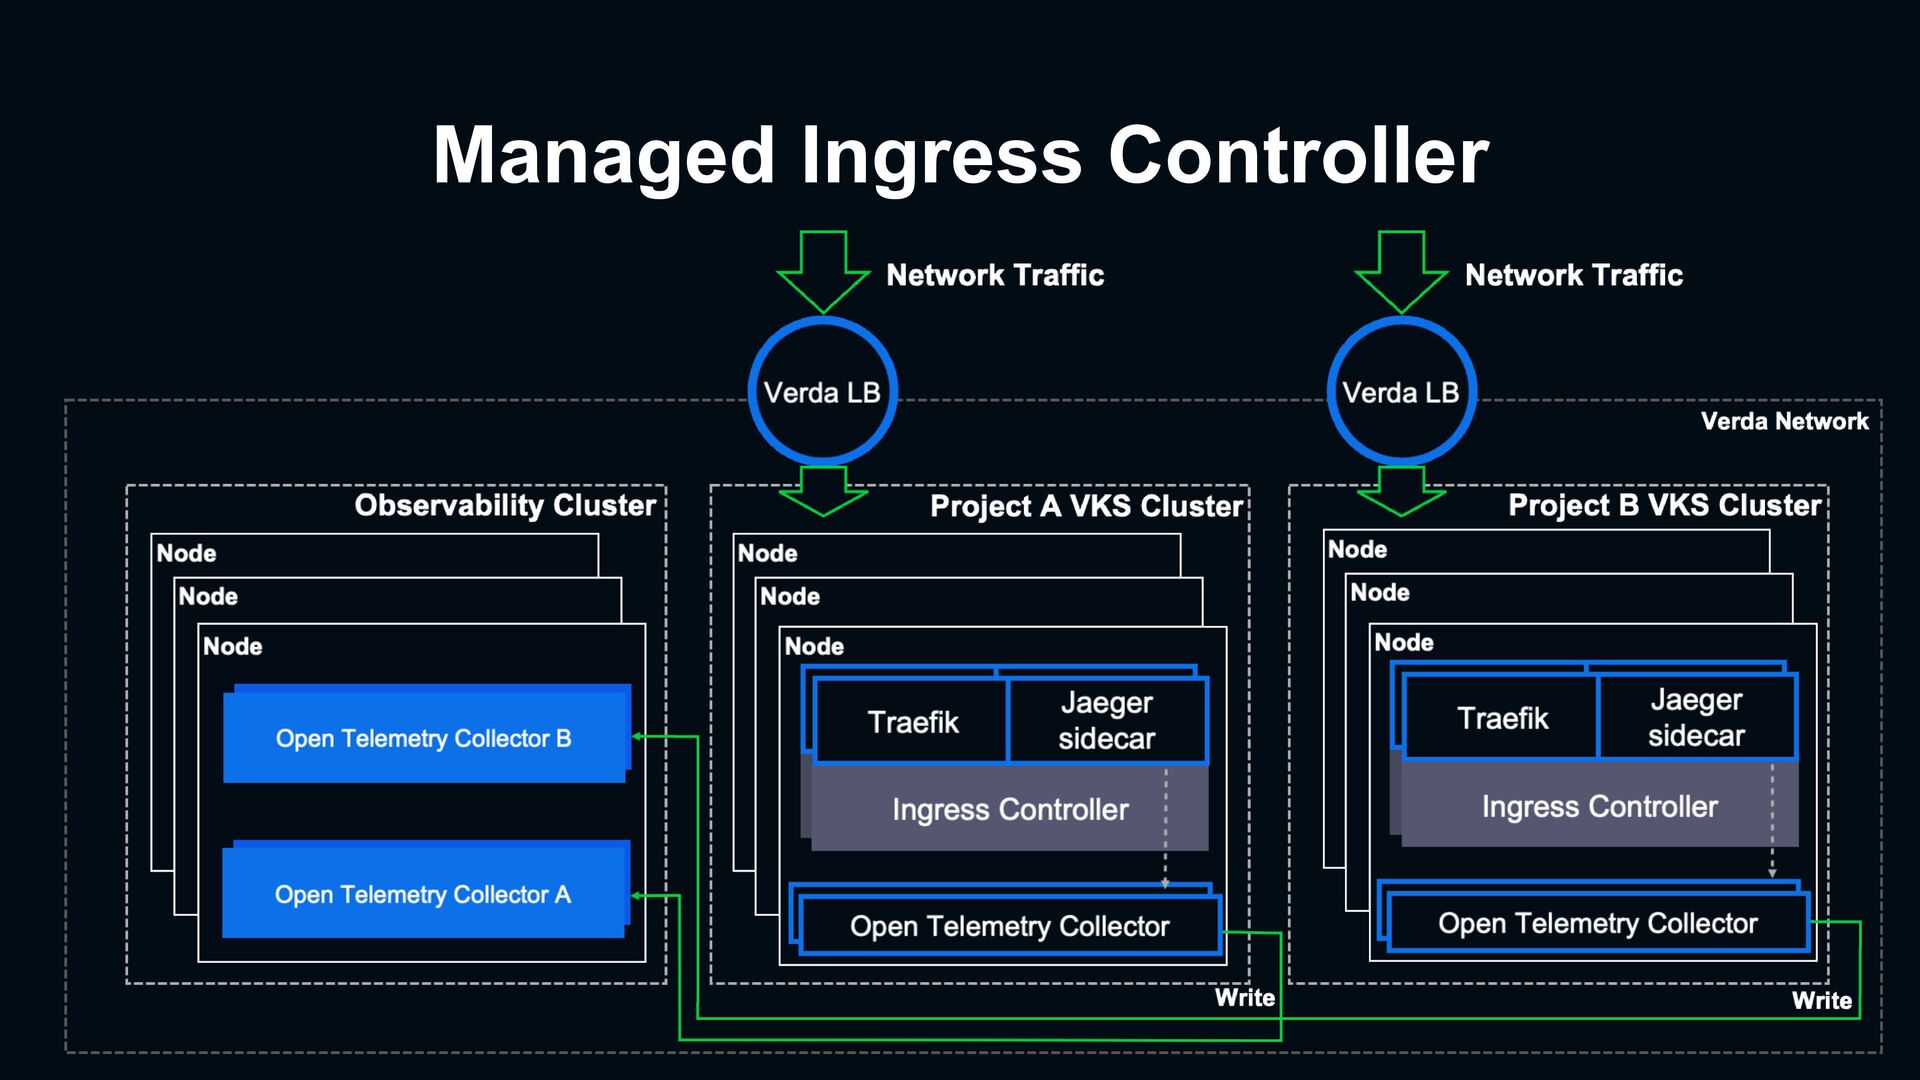
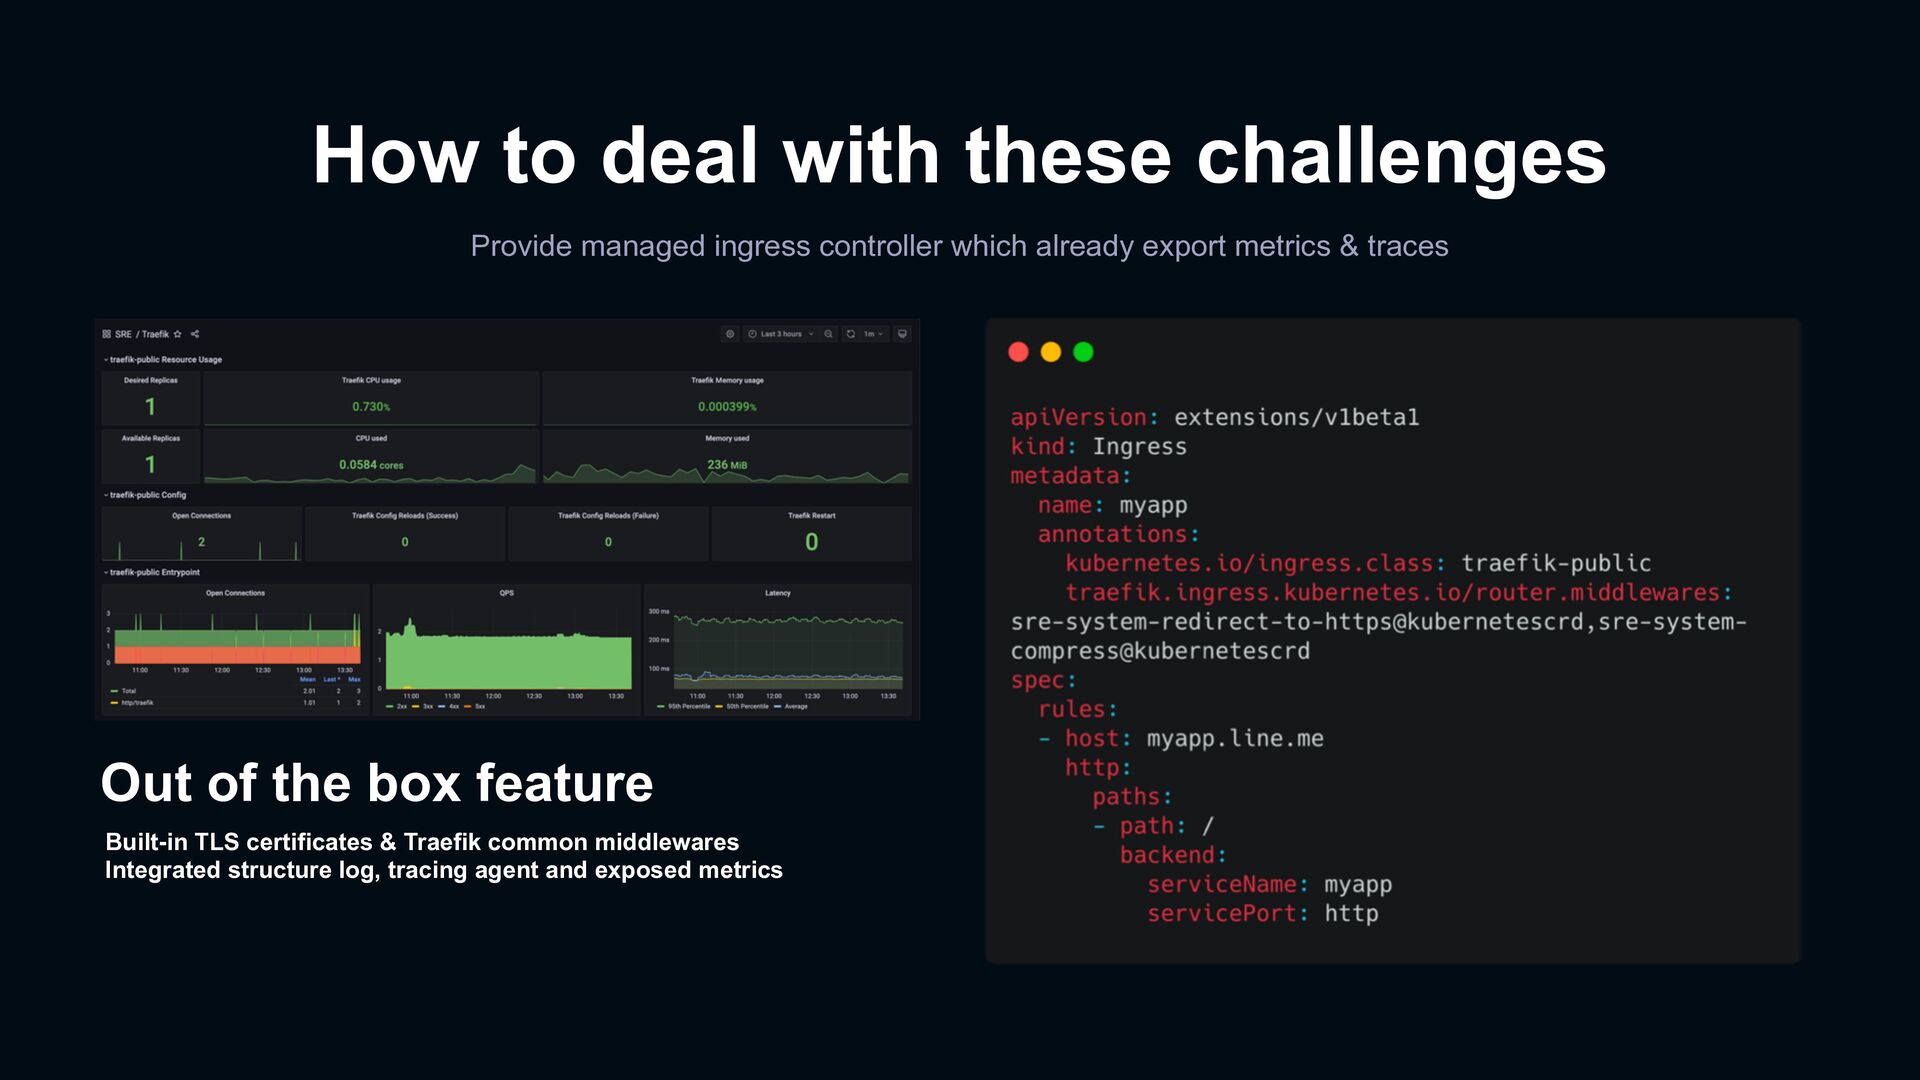
which already export metrics & traces Out of the box feature Built-in TLS certificates & Traefik common middlewares Integrated structure log, tracing agent and exposed metrics
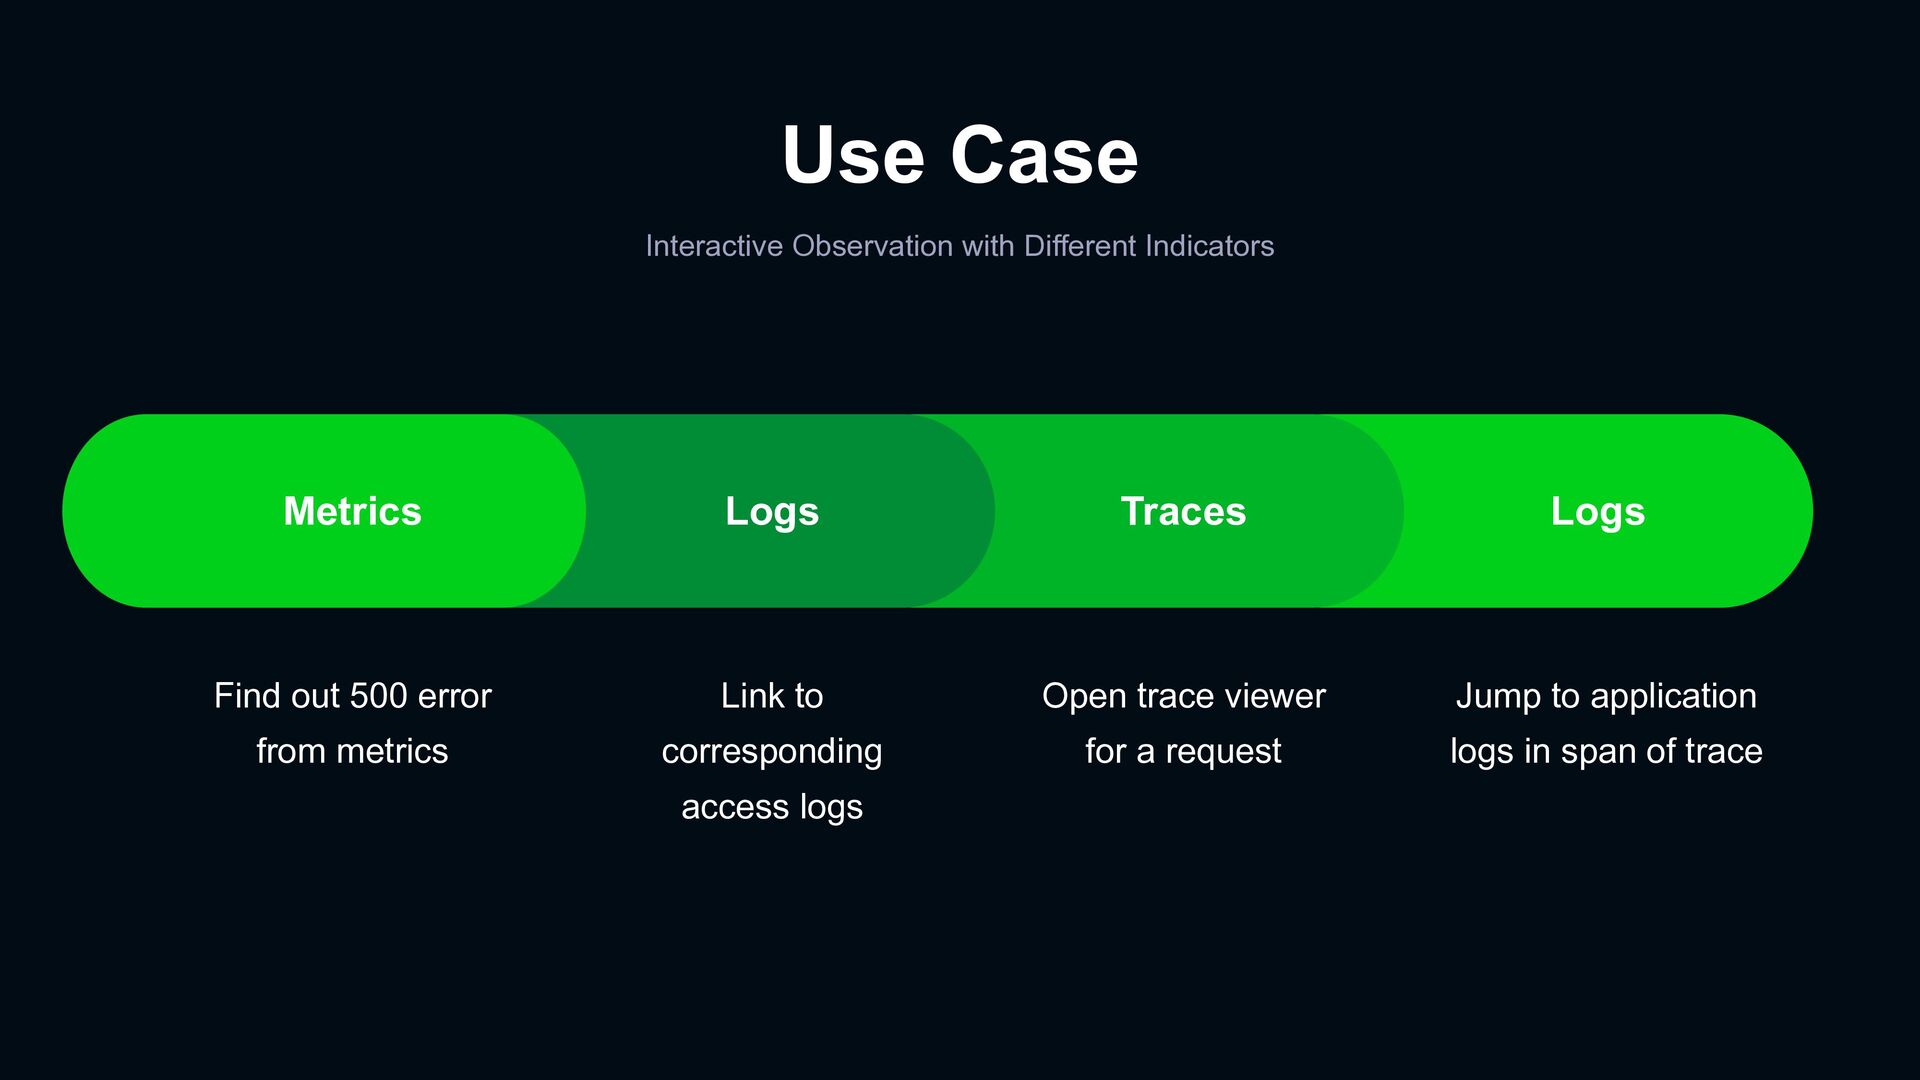
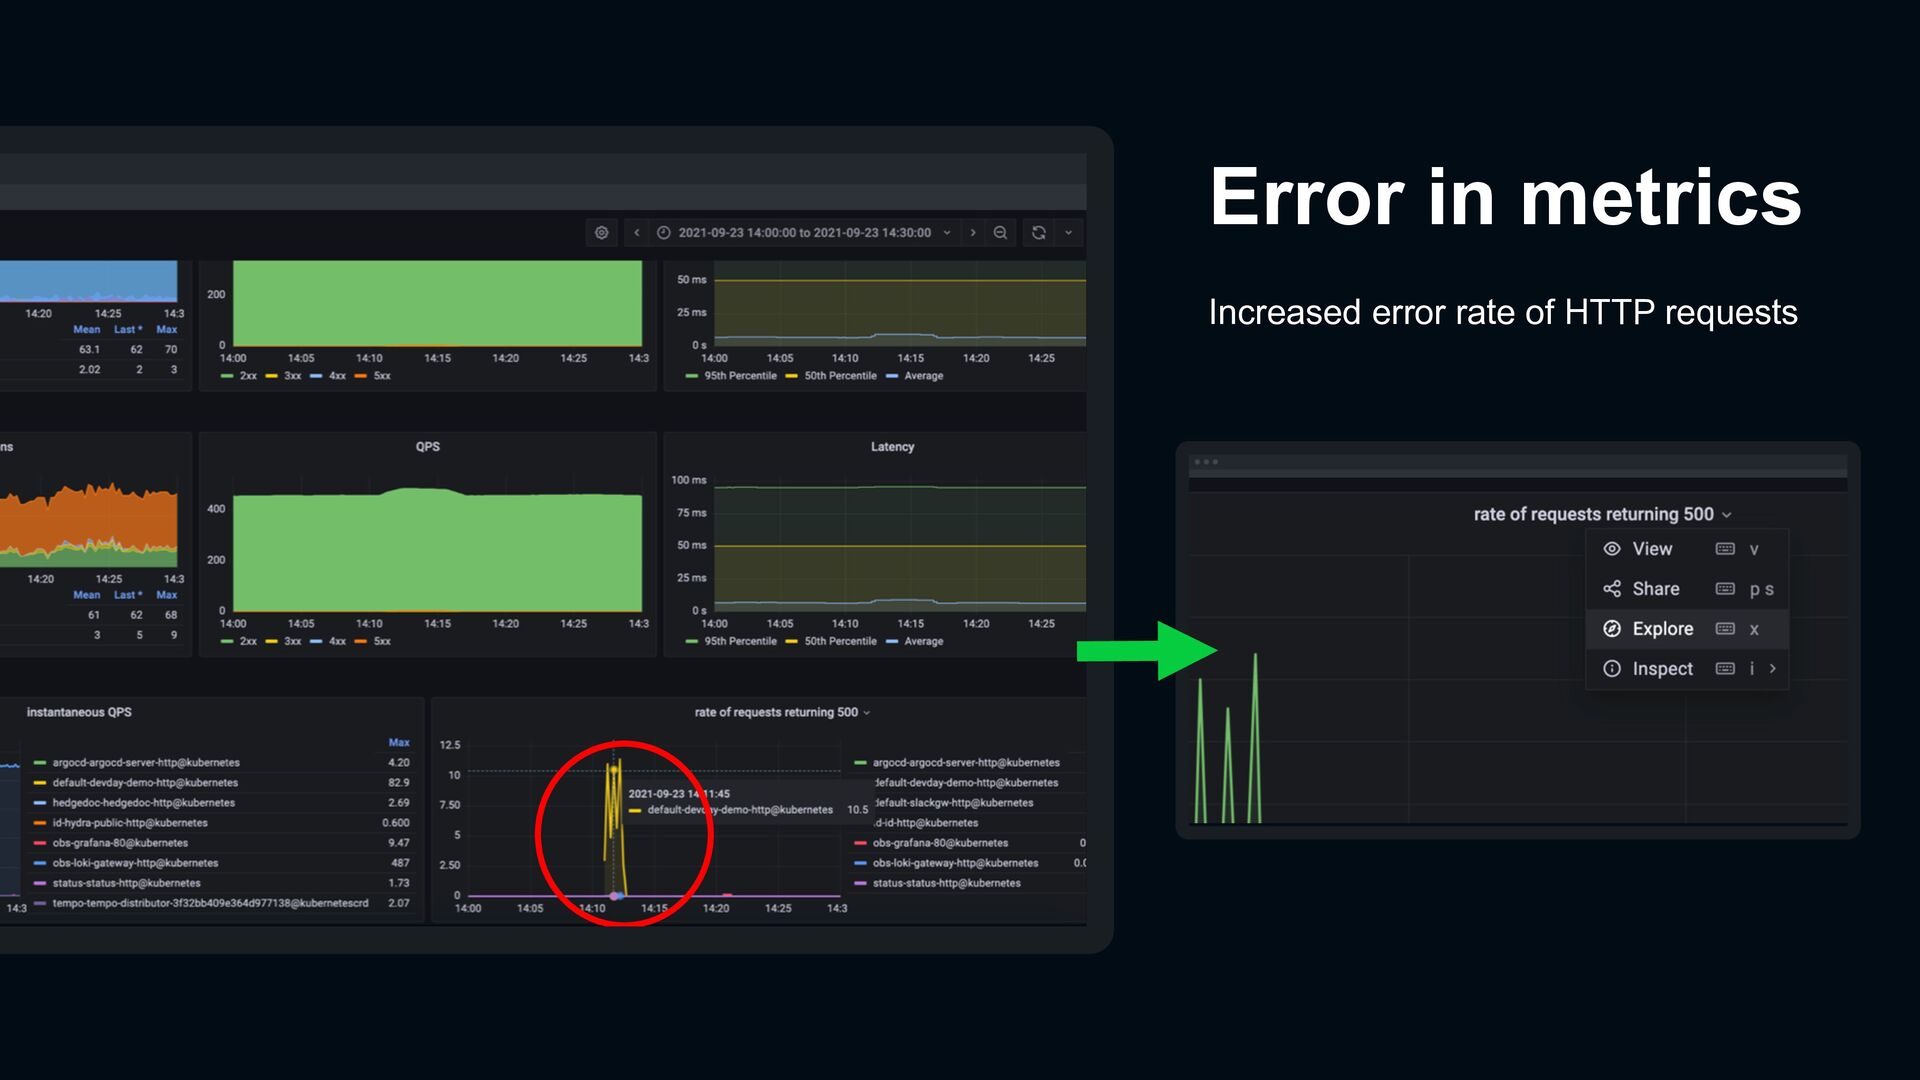
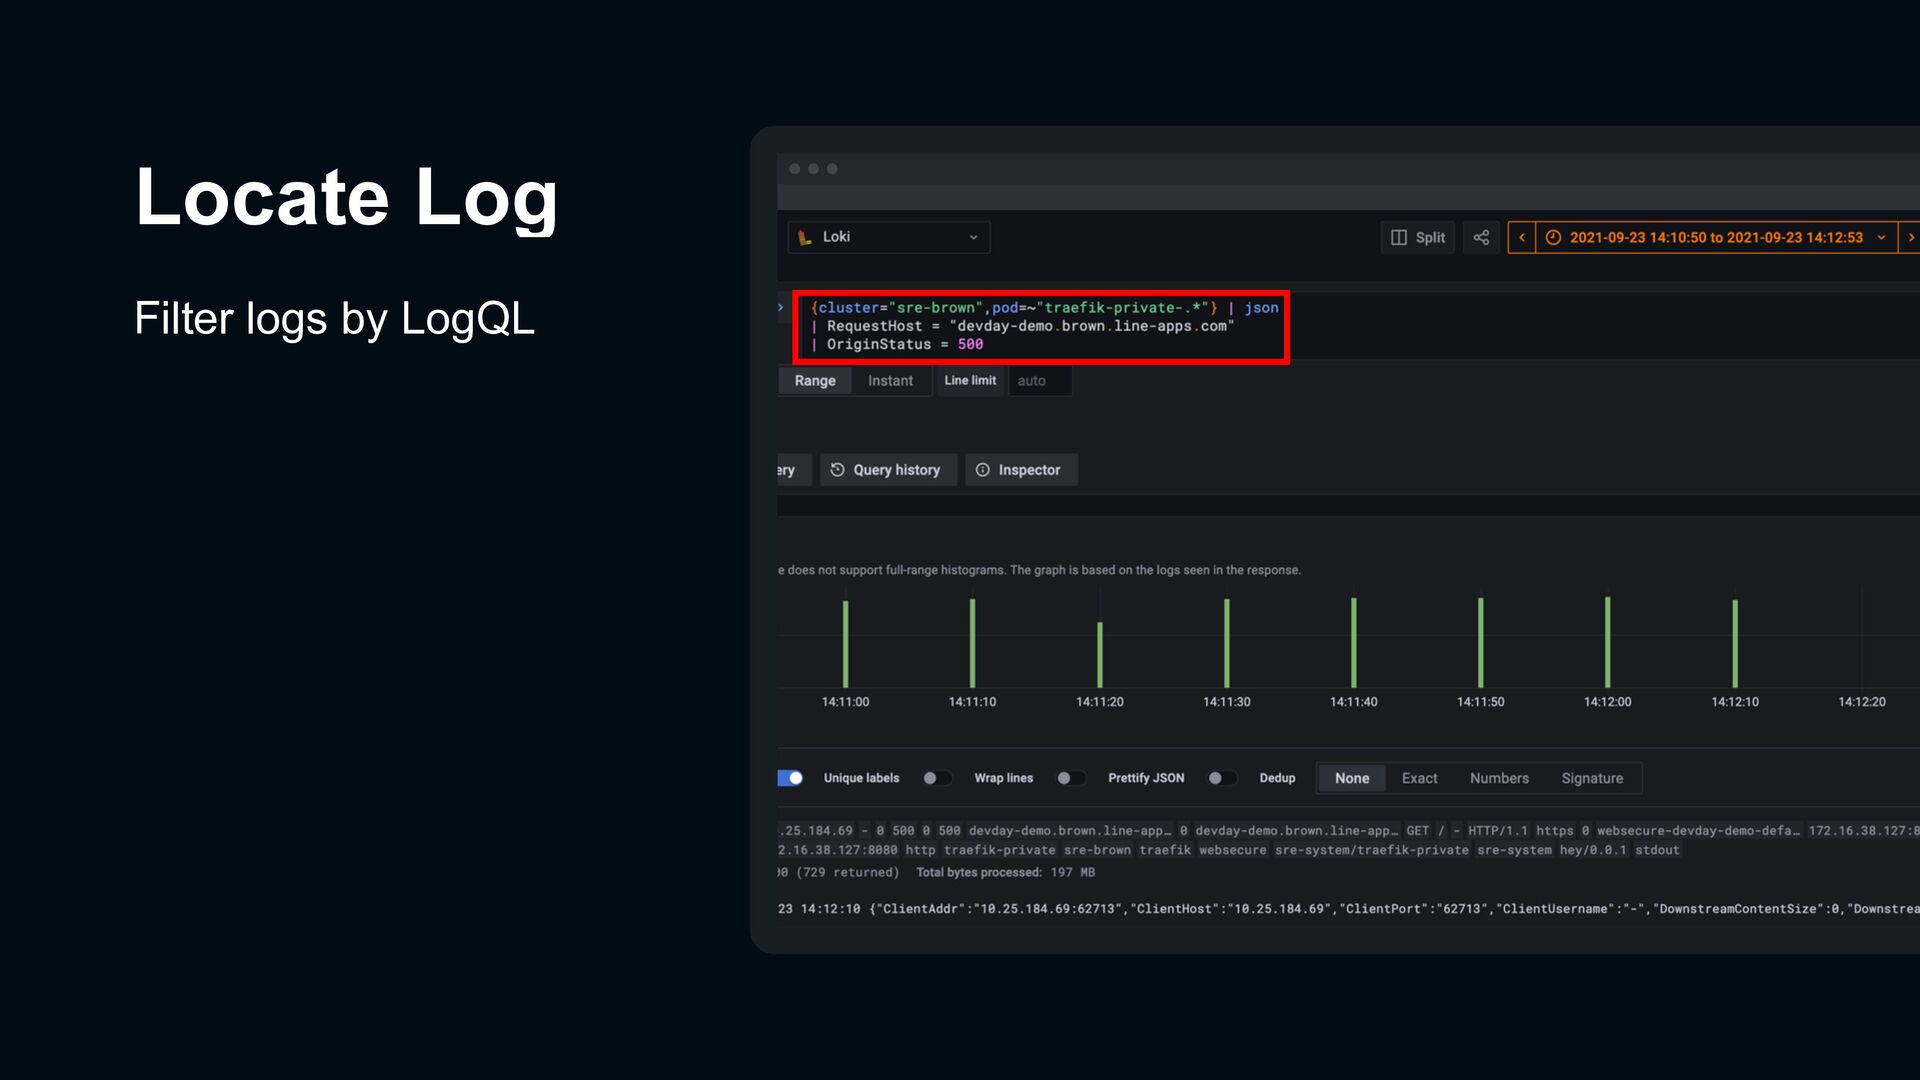
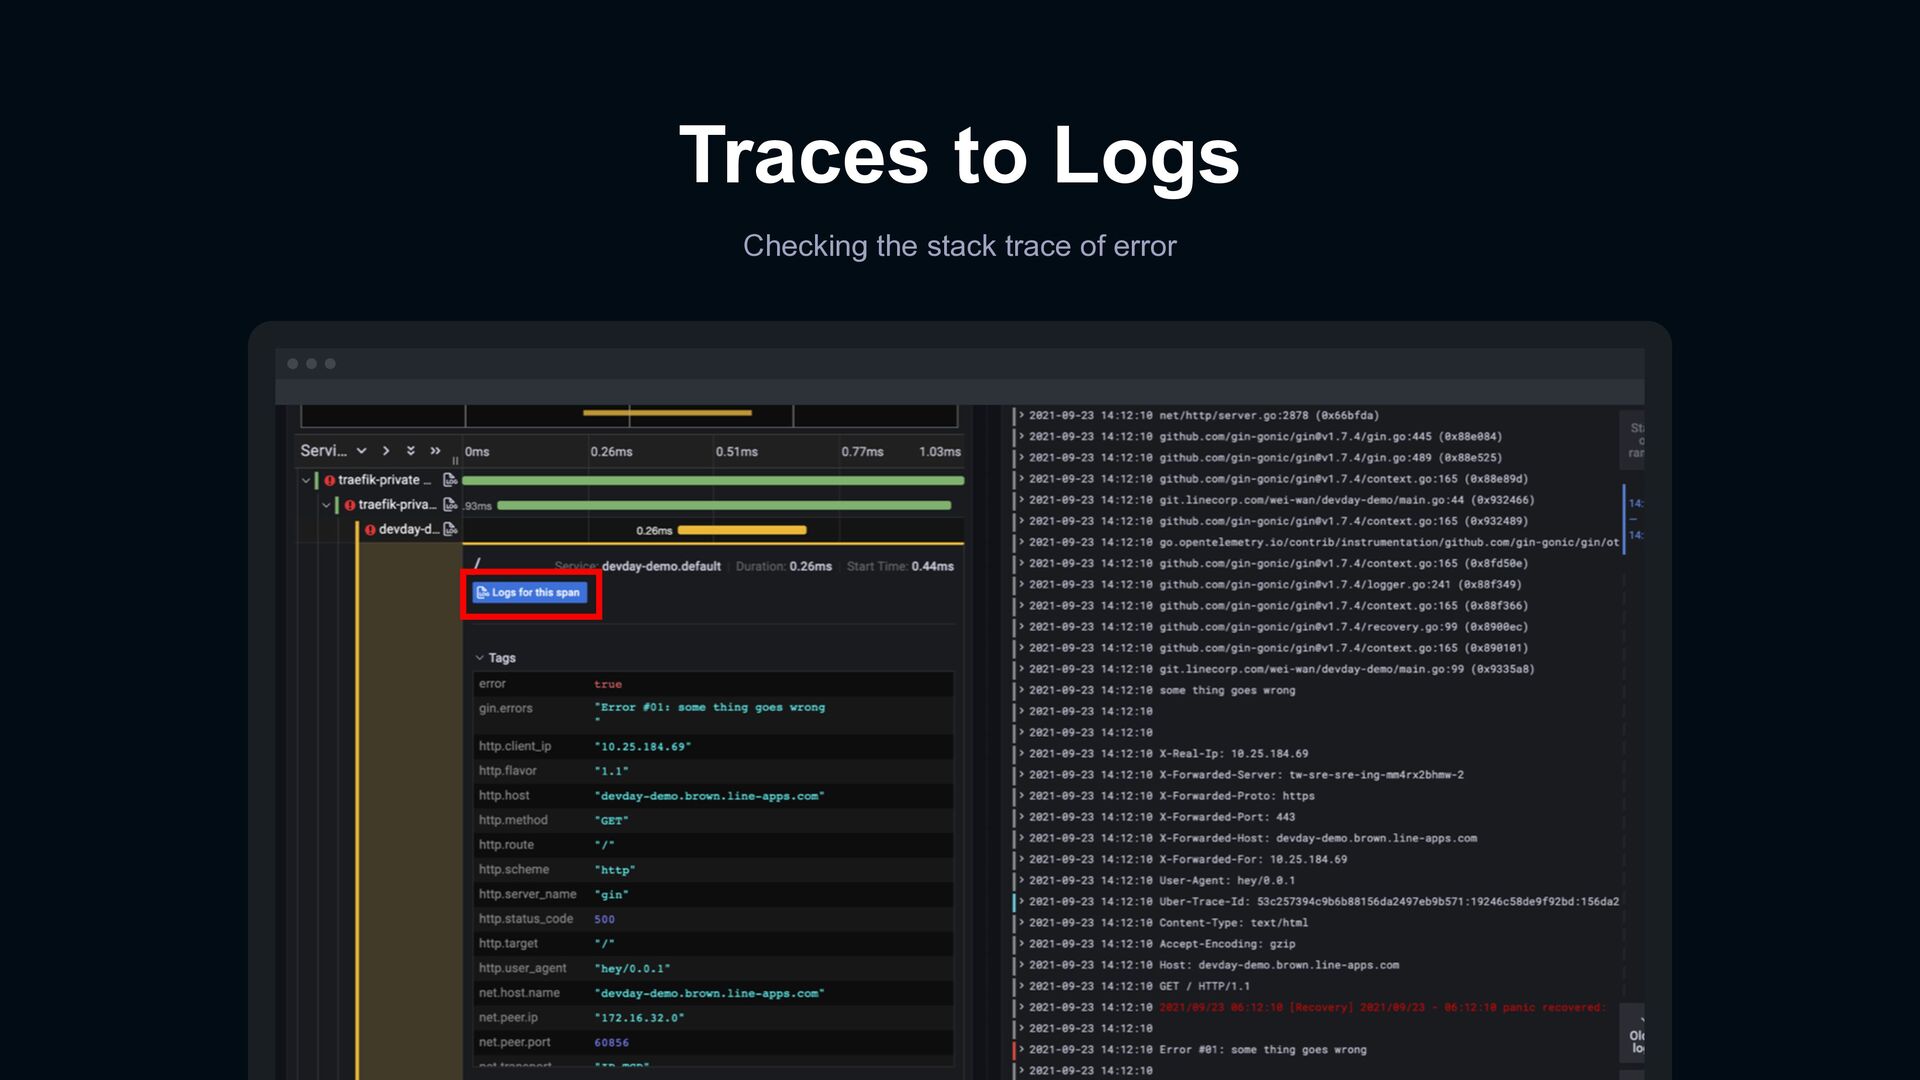
error from metrics Link to corresponding access logs Open trace viewer for a request Jump to application logs in span of trace Logs Traces Logs Metrics
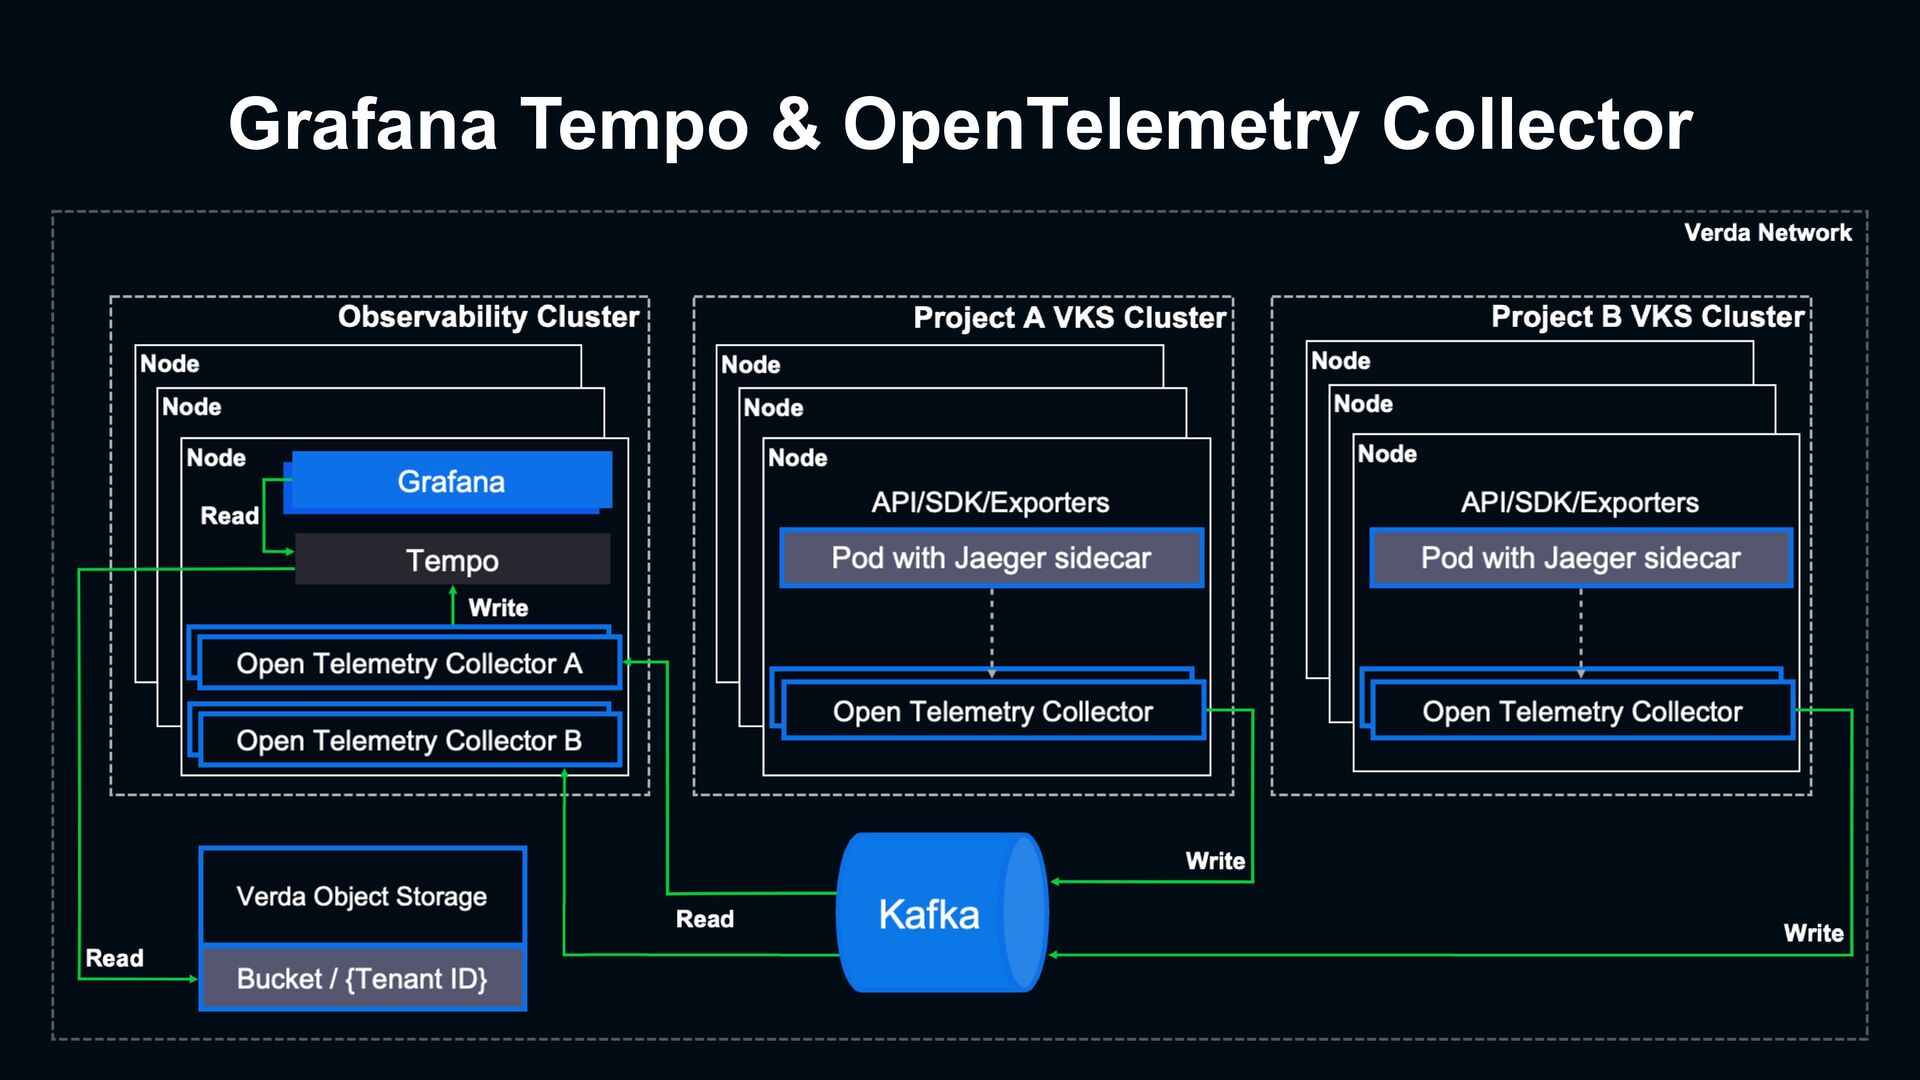
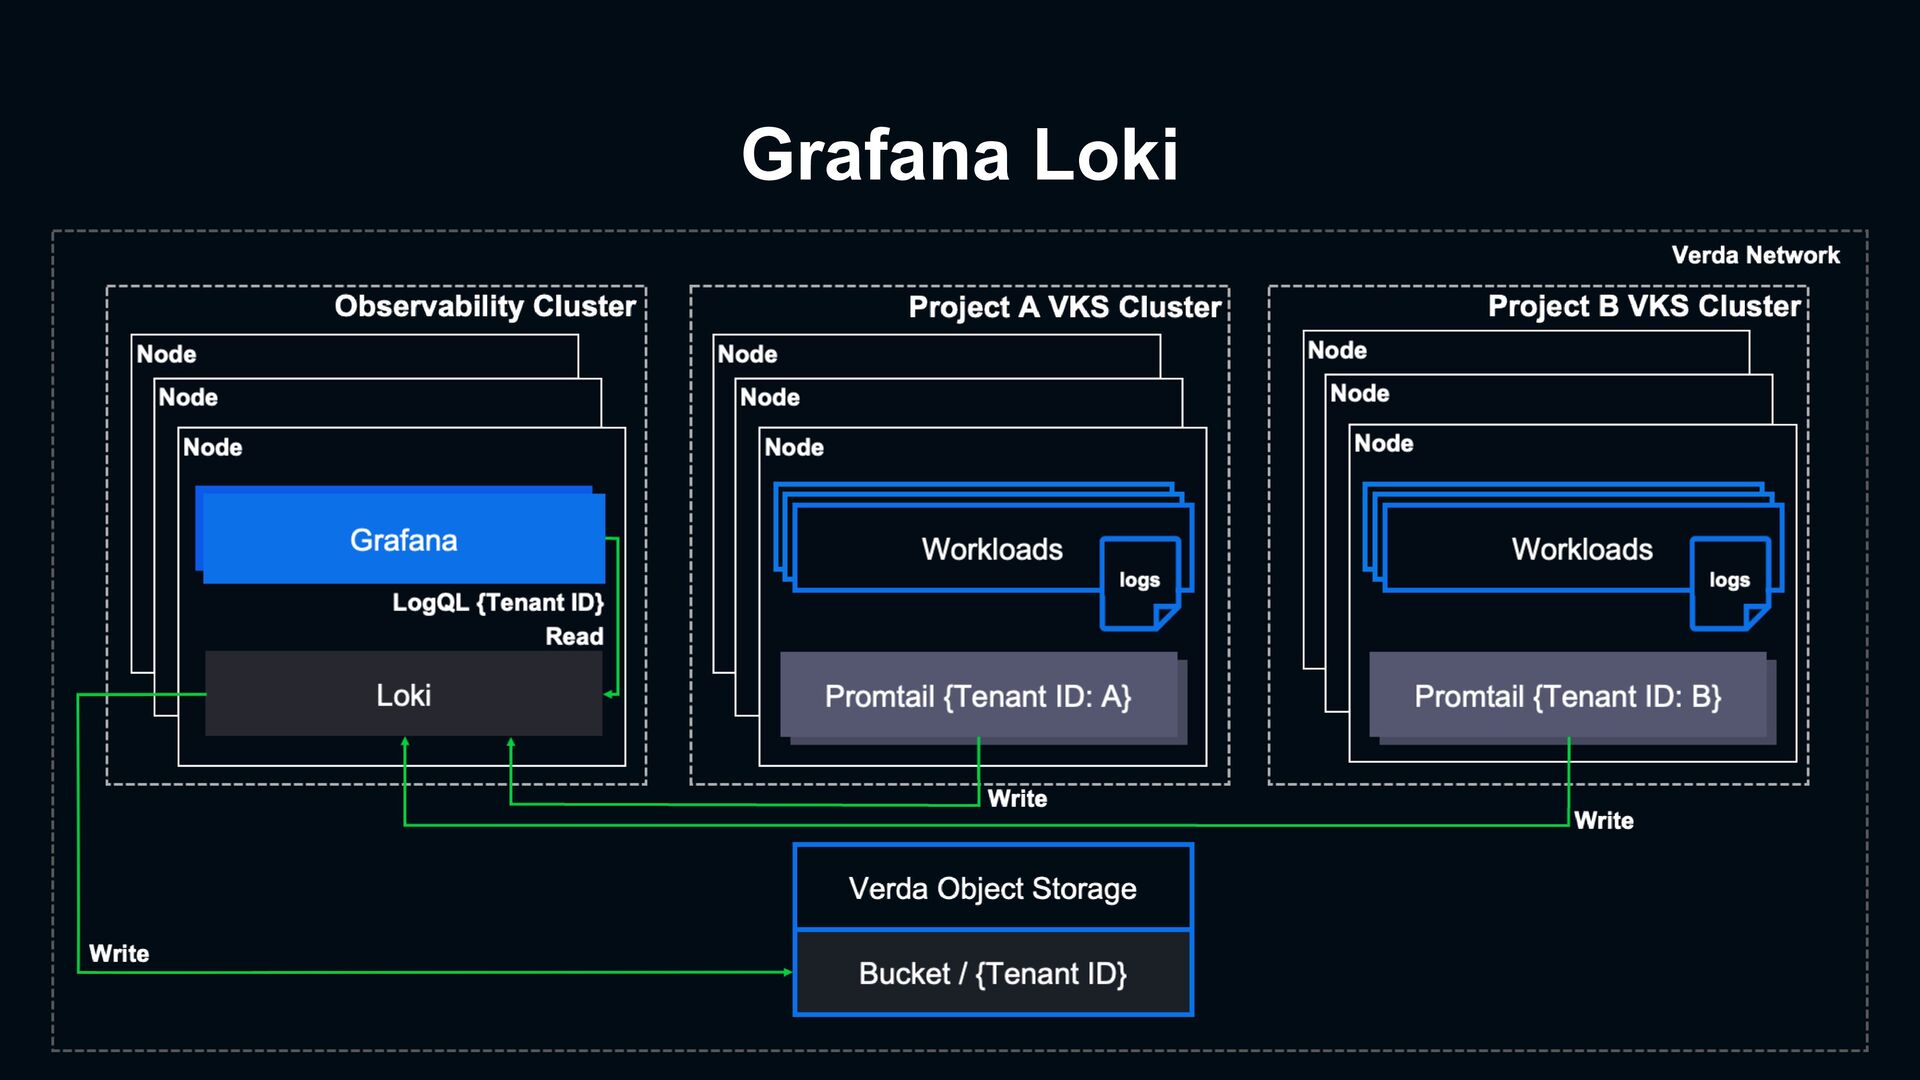
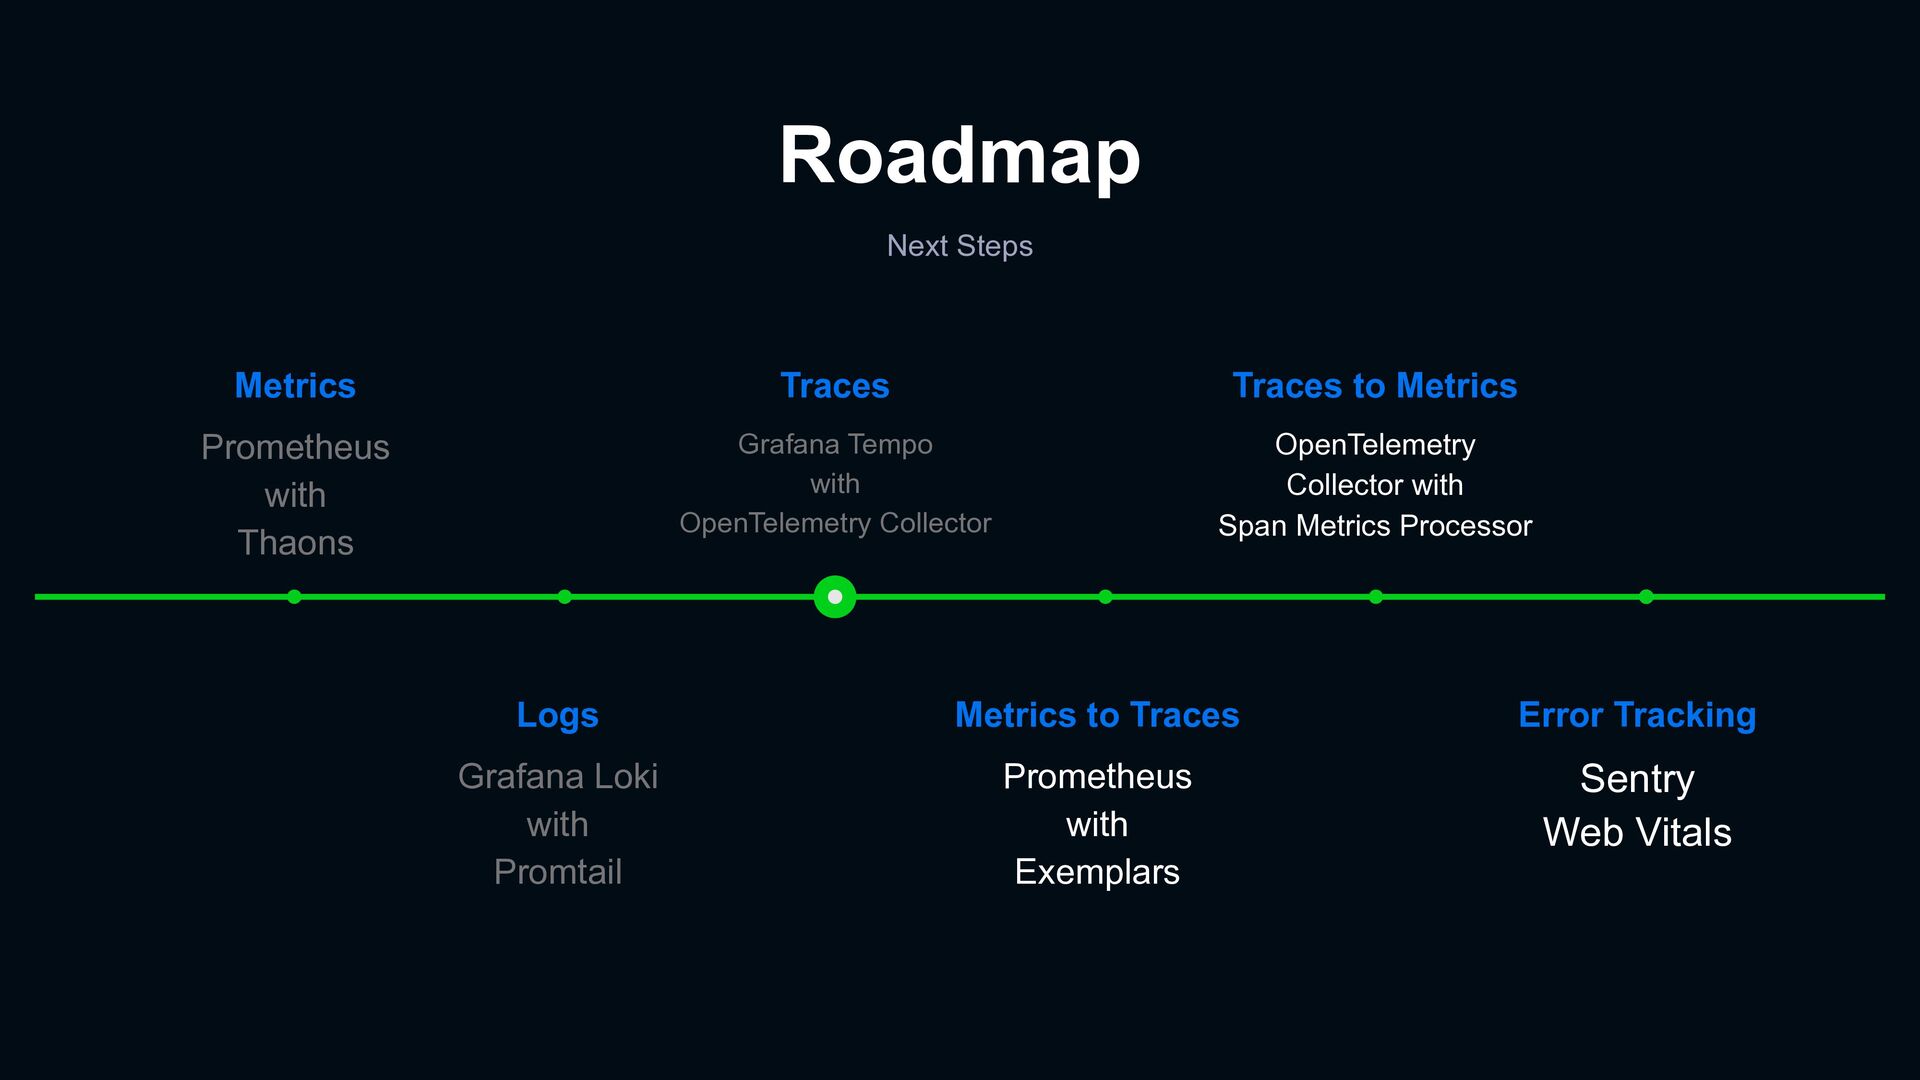
Traces Prometheus with Exemplars Logs Grafana Loki with Promtail Traces to Metrics OpenTelemetry Collector with Span Metrics Processor Traces Grafana Tempo with OpenTelemetry Collector Metrics Prometheus with Thaons
and pooling of system knowledge across organization › Current observability practices speed up for teams to achieve actionable insights from data › Traditional monitoring practices are not enough for teams debugging in a distributed system › Adoption challenges, experience sharing and use cases sharing