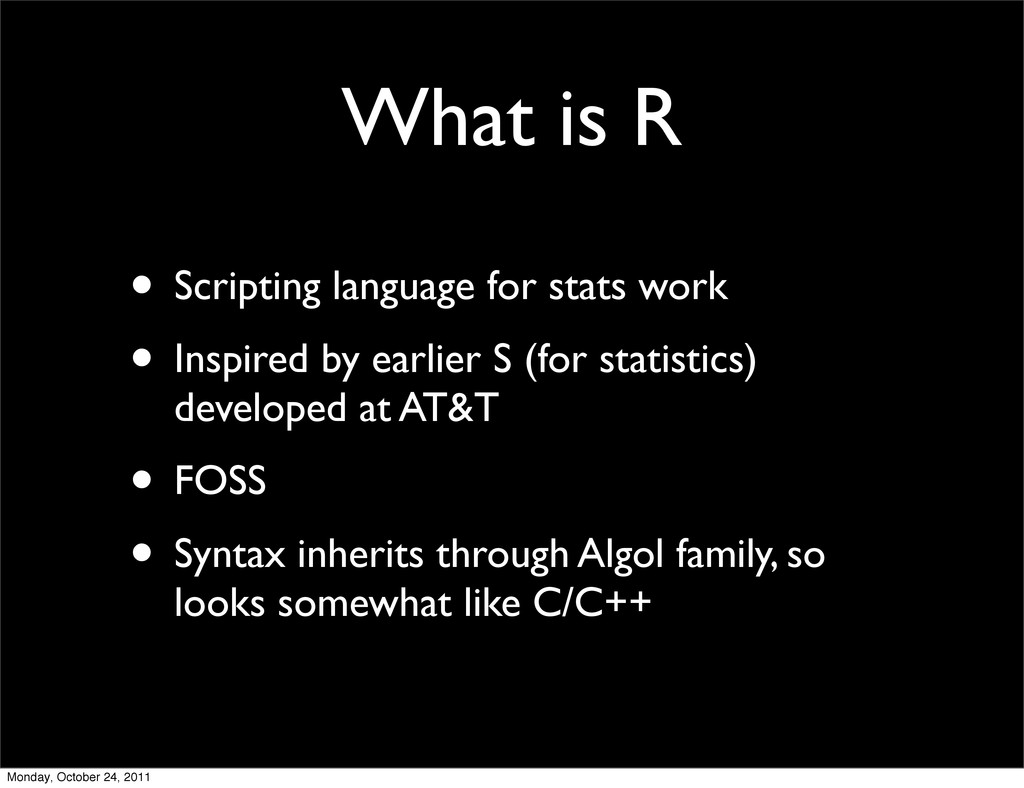
Inspired by earlier S (for statistics) developed at AT&T • FOSS • Syntax inherits through Algol family, so looks somewhat like C/C++ Monday, October 24, 2011
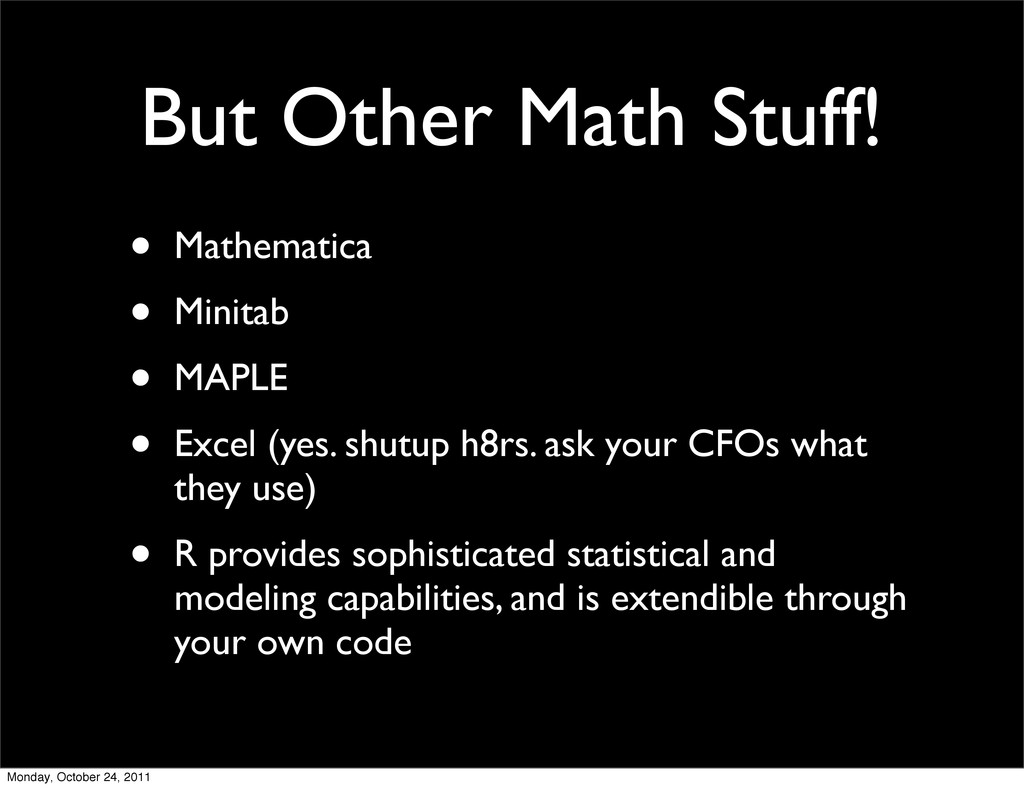
• Excel (yes. shutup h8rs. ask your CFOs what they use) • R provides sophisticated statistical and modeling capabilities, and is extendible through your own code Monday, October 24, 2011
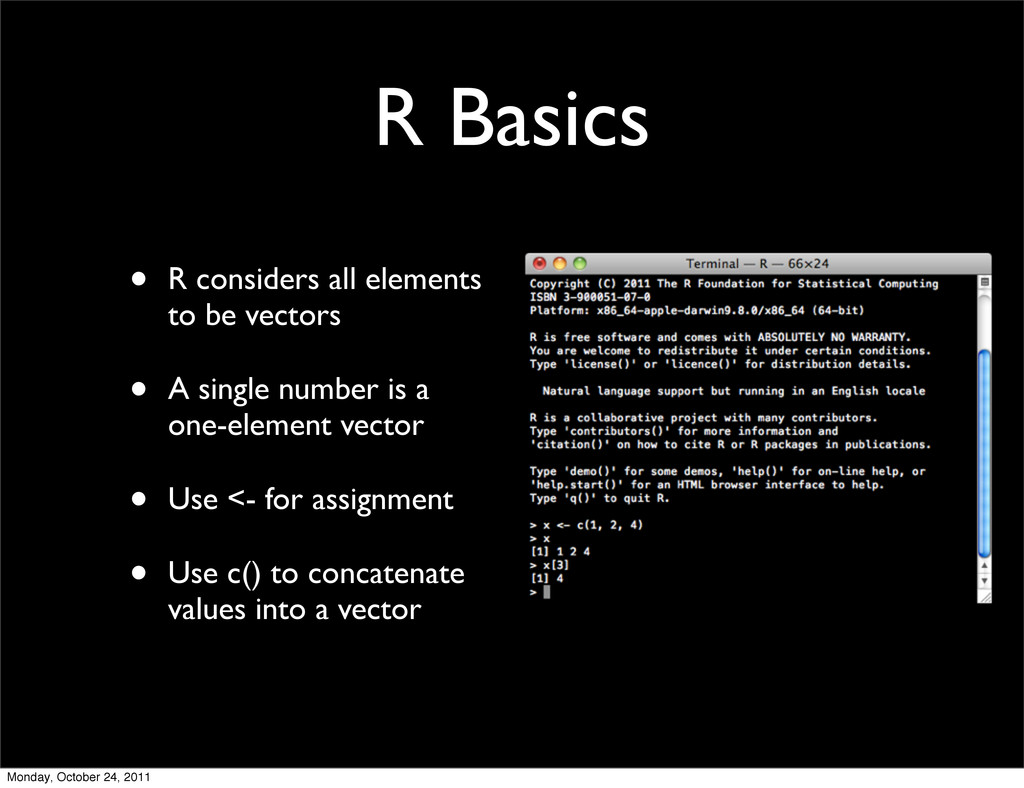
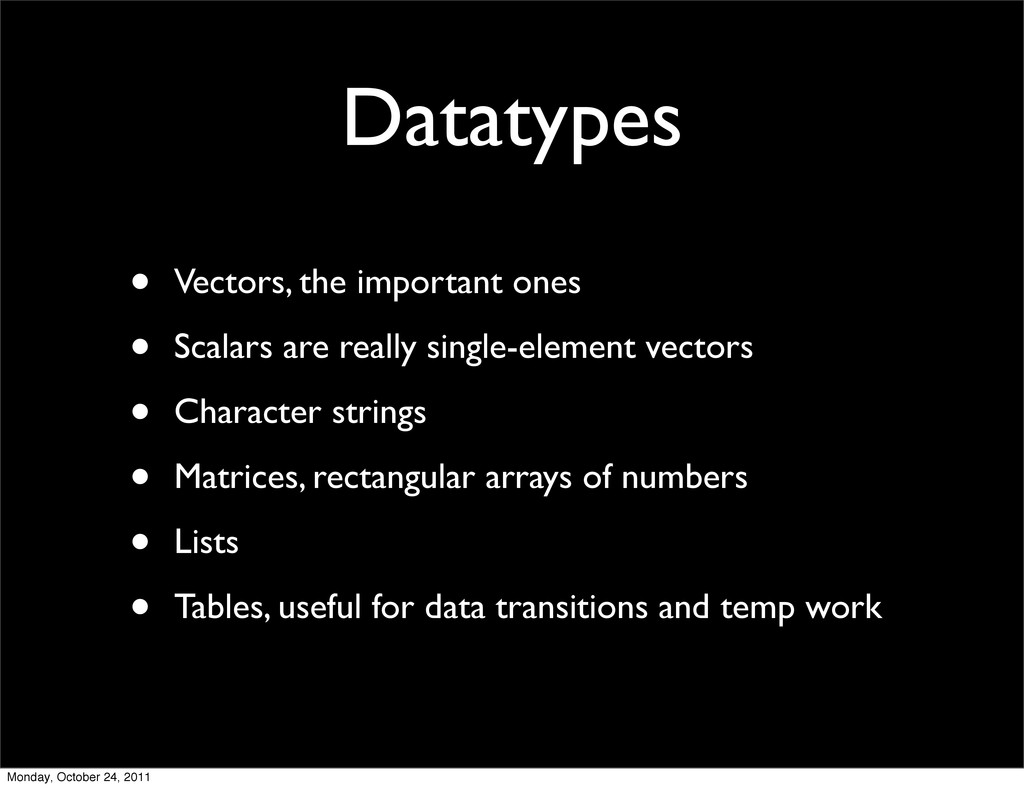
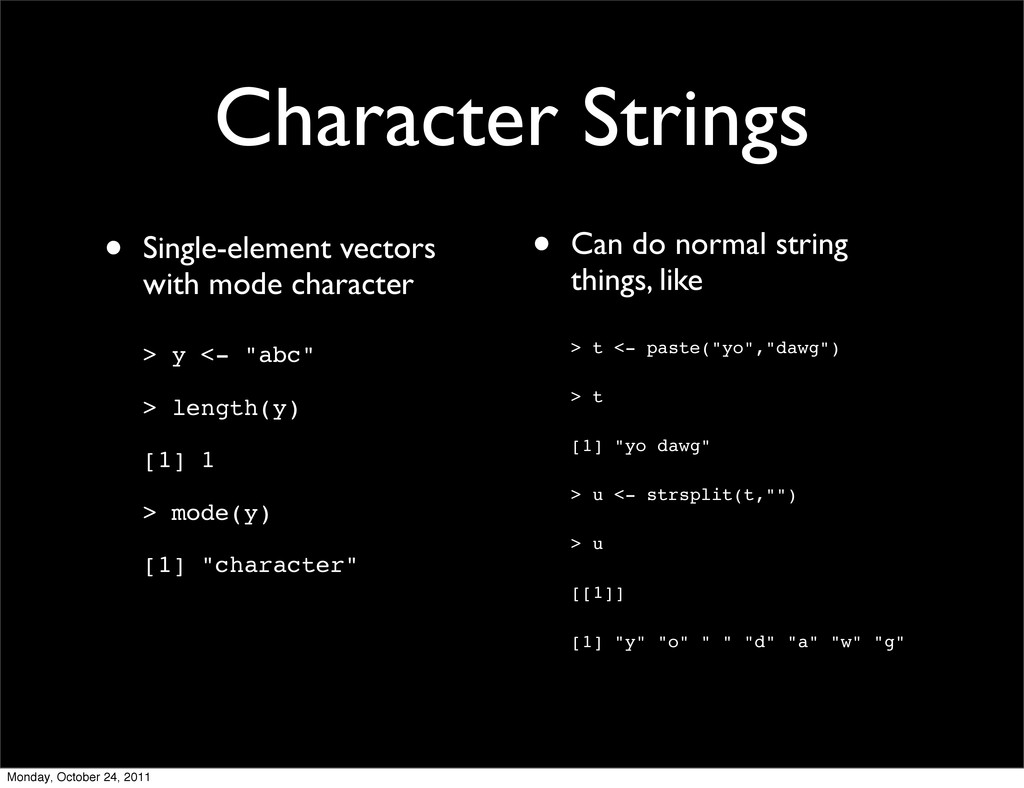
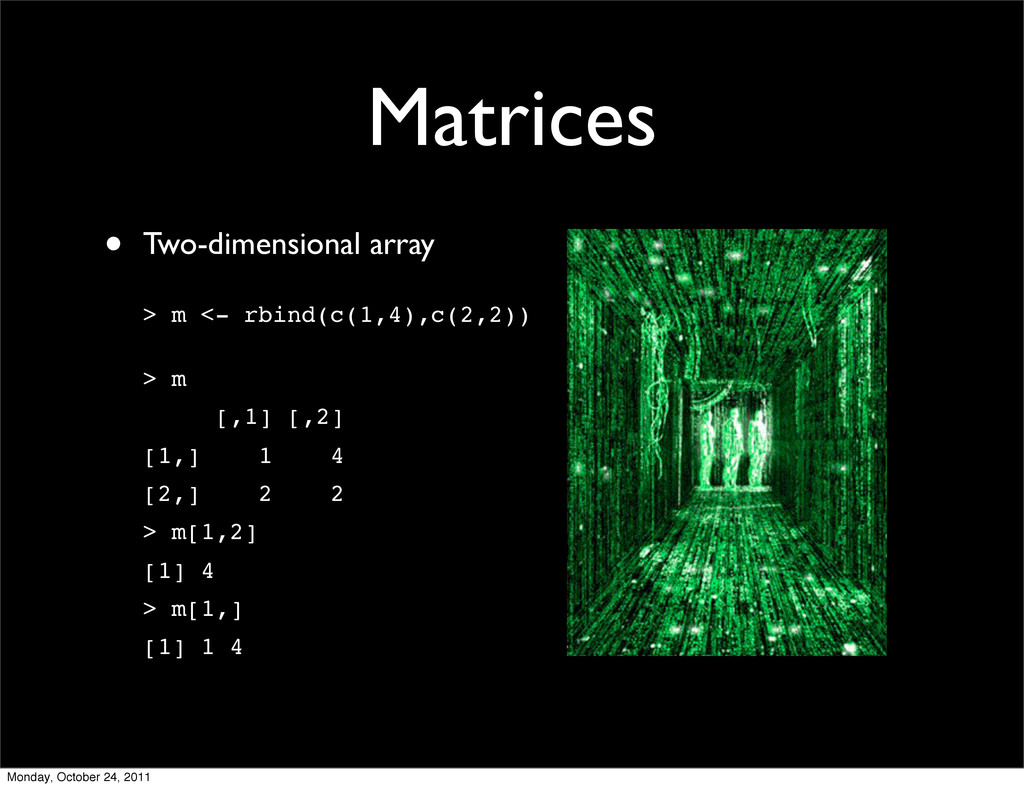
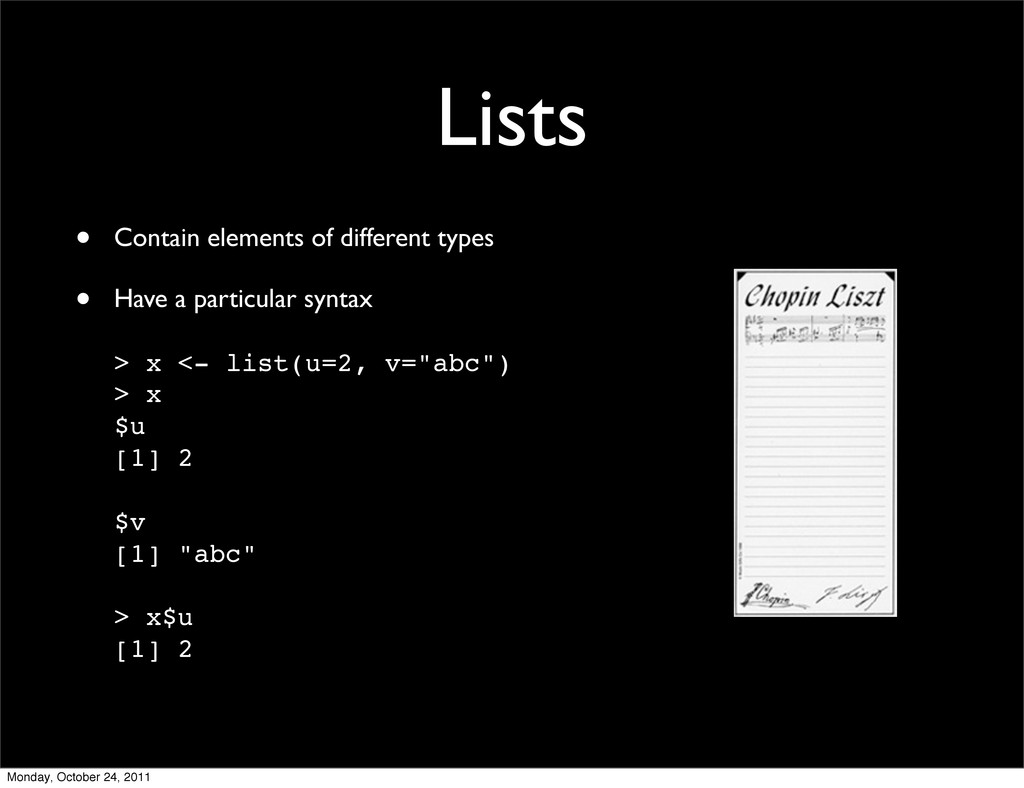
single-element vectors • Character strings • Matrices, rectangular arrays of numbers • Lists • Tables, useful for data transitions and temp work Monday, October 24, 2011
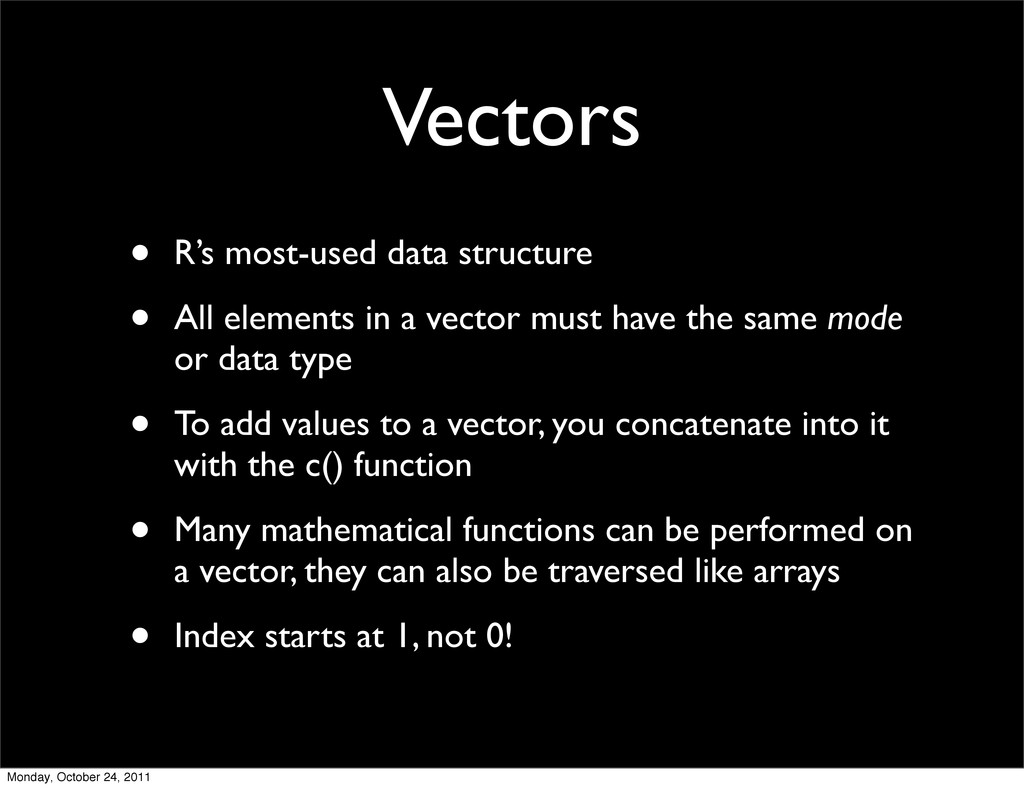
a vector must have the same mode or data type • To add values to a vector, you concatenate into it with the c() function • Many mathematical functions can be performed on a vector, they can also be traversed like arrays • Index starts at 1, not 0! Monday, October 24, 2011
<- "abc" > length(y) [1] 1 > mode(y) [1] "character" • Can do normal string things, like > t <- paste("yo","dawg") > t [1] "yo dawg" > u <- strsplit(t,"") > u [[1]] [1] "y" "o" " " "d" "a" "w" "g" Monday, October 24, 2011
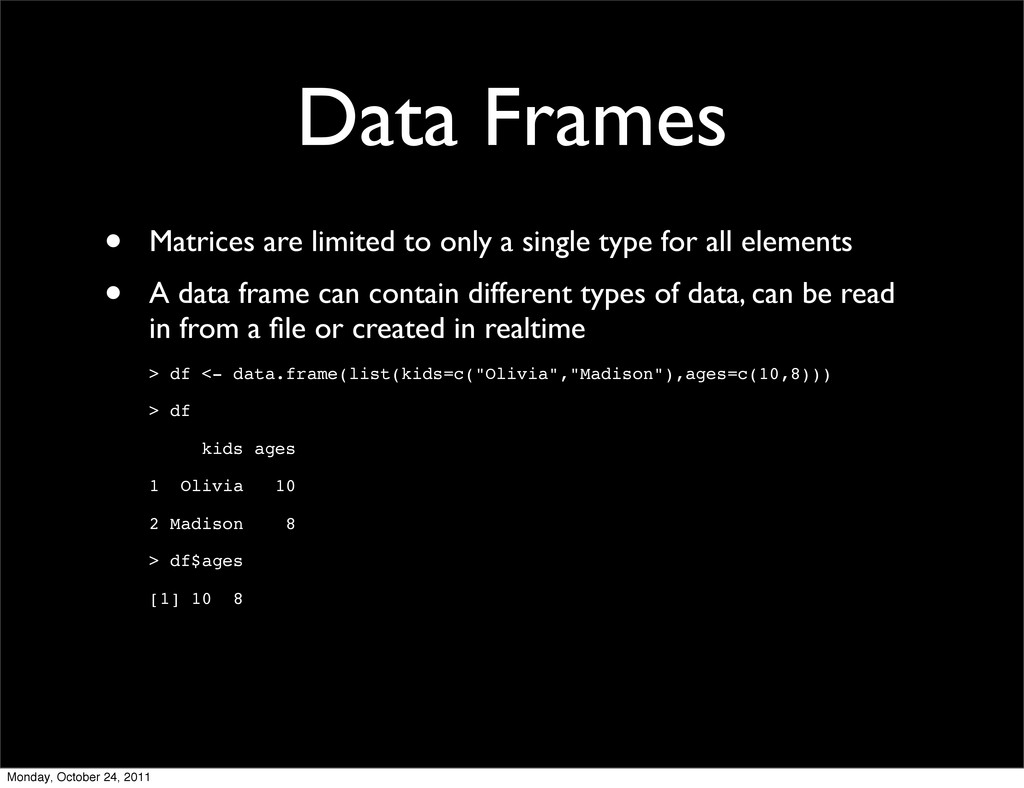
type for all elements • A data frame can contain different types of data, can be read in from a file or created in realtime > df <- data.frame(list(kids=c("Olivia","Madison"),ages=c(10,8))) > df kids ages 1 Olivia 10 2 Madison 8 > df$ages [1] 10 8 Monday, October 24, 2011
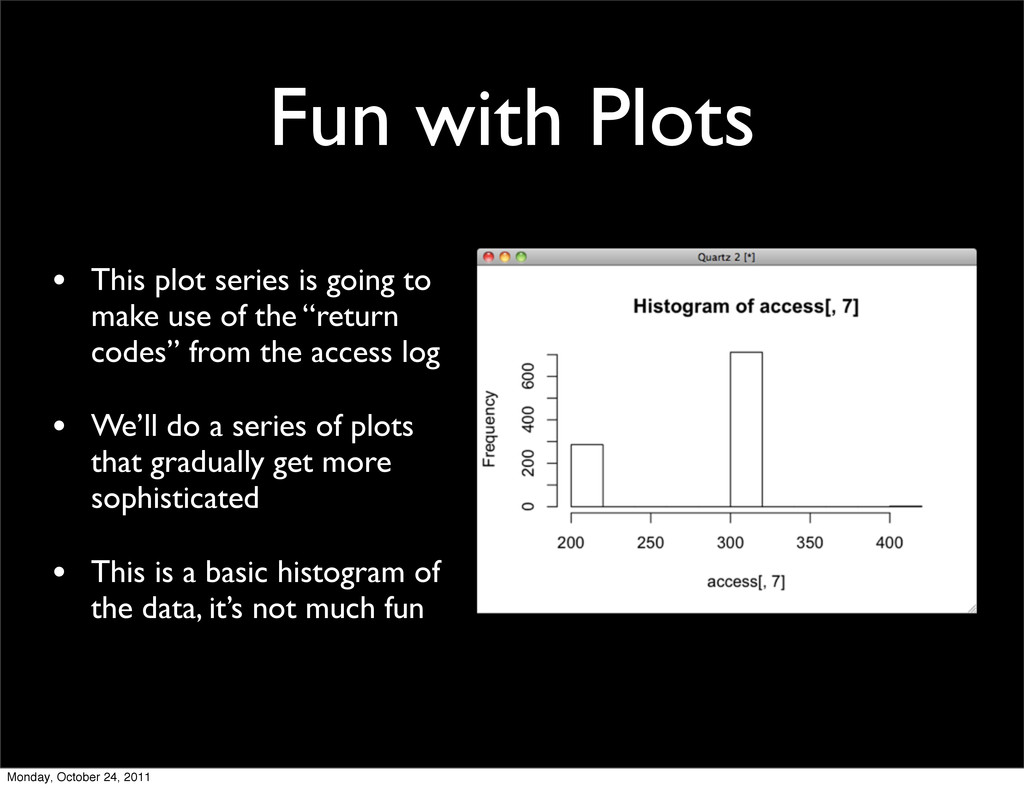
make use of the “return codes” from the access log • We’ll do a series of plots that gradually get more sophisticated • This is a basic histogram of the data, it’s not much fun Monday, October 24, 2011
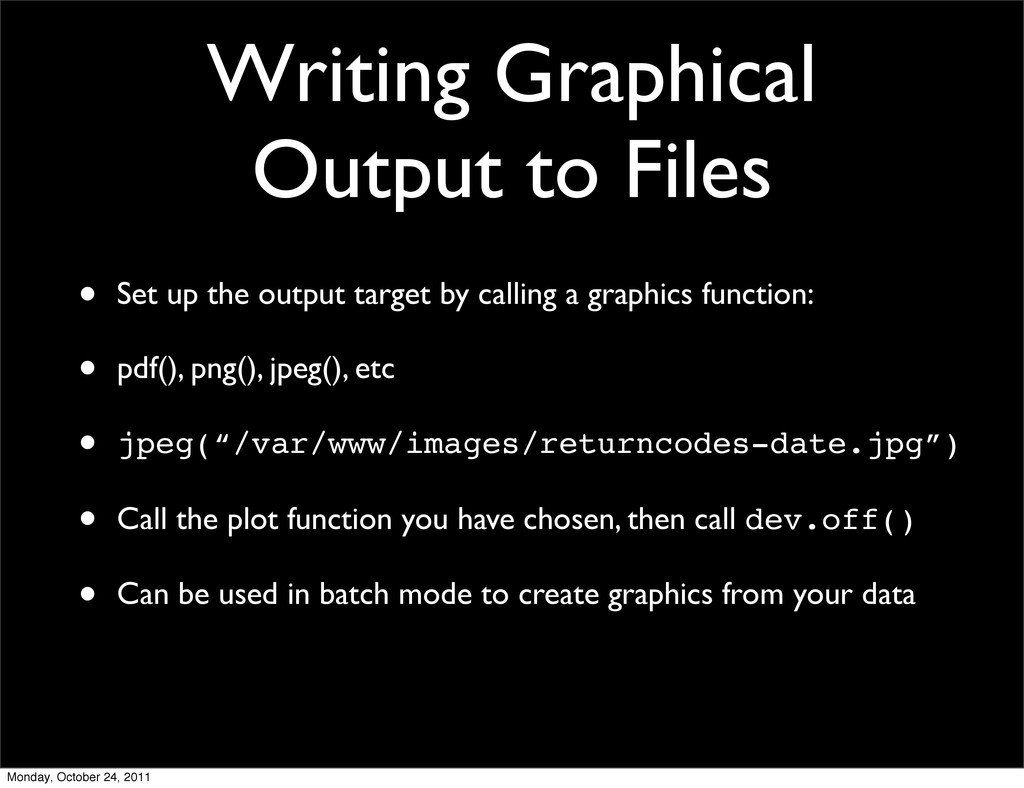
target by calling a graphics function: • pdf(), png(), jpeg(), etc • jpeg(“/var/www/images/returncodes-date.jpg”) • Call the plot function you have chosen, then call dev.off() • Can be used in batch mode to create graphics from your data Monday, October 24, 2011
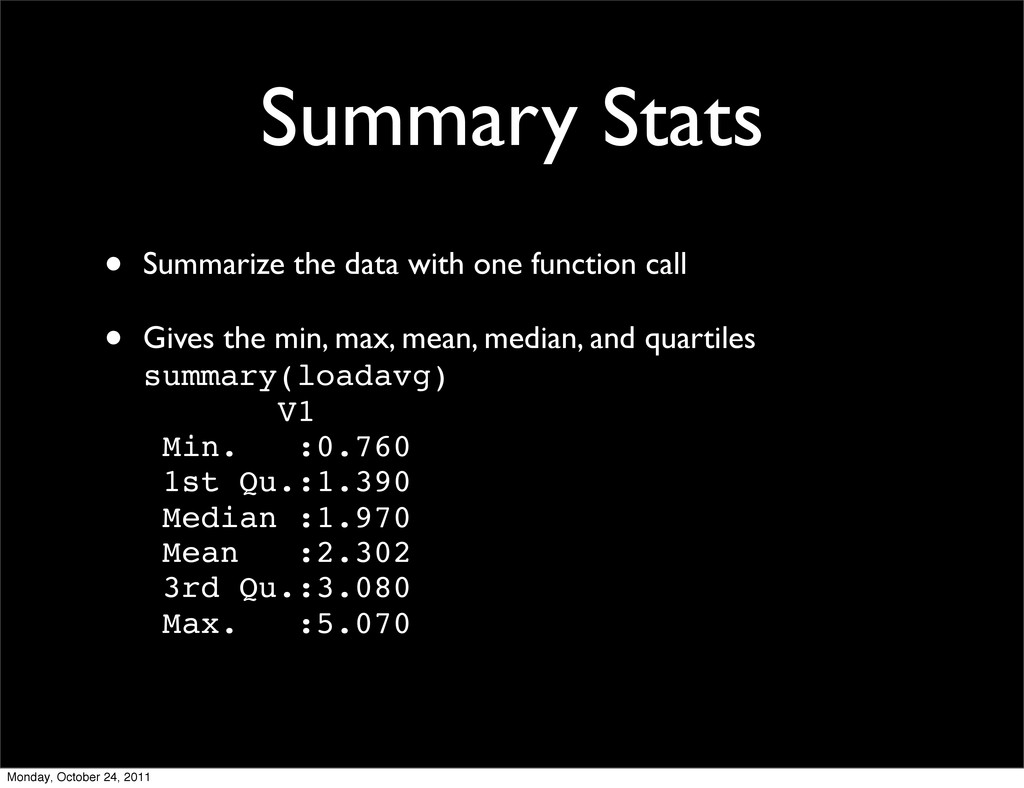
• Gives the min, max, mean, median, and quartiles summary(loadavg) V1 Min. :0.760 1st Qu.:1.390 Median :1.970 Mean :2.302 3rd Qu.:3.080 Max. :5.070 Monday, October 24, 2011
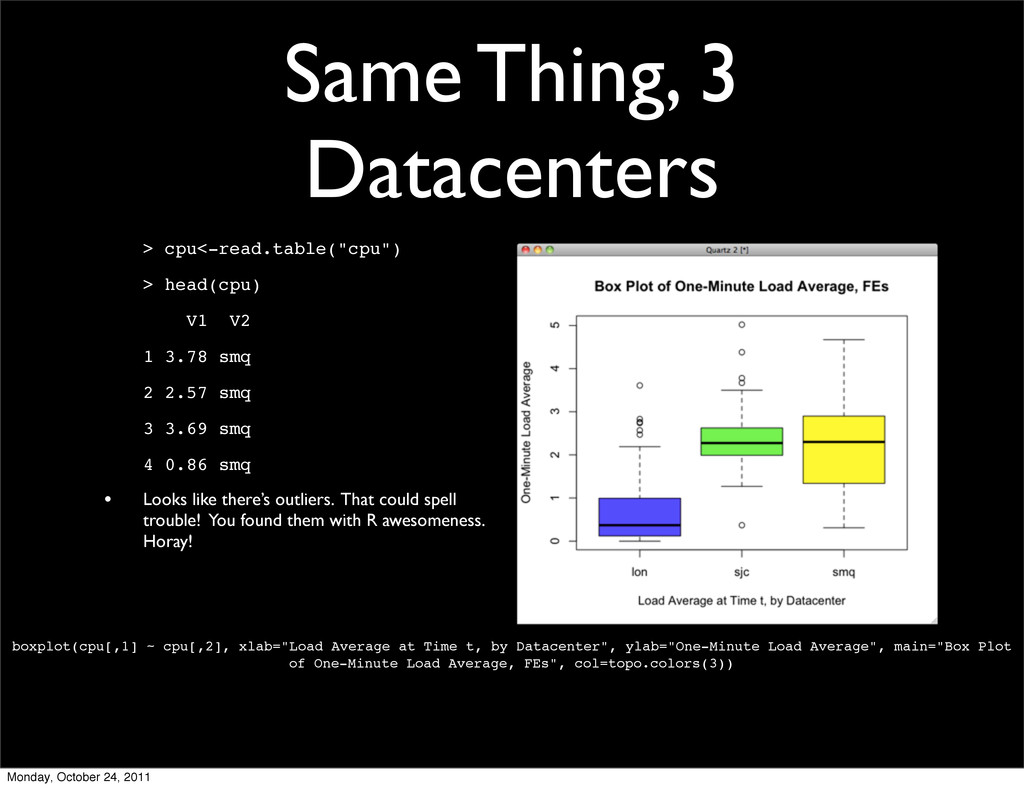
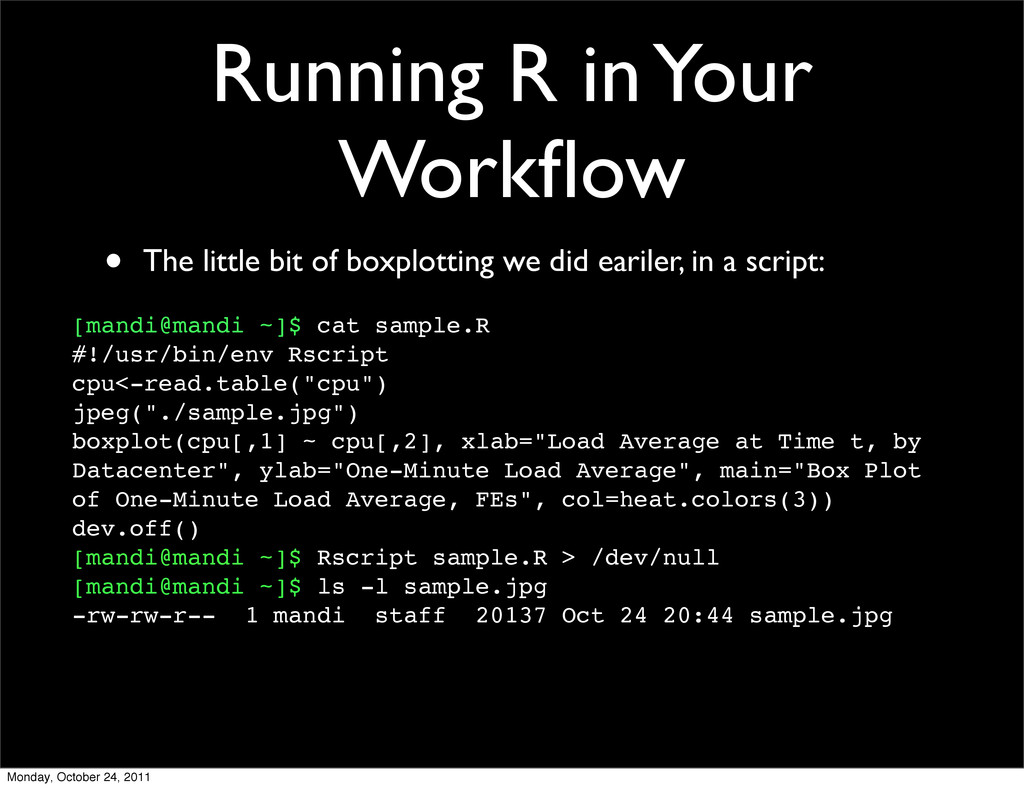
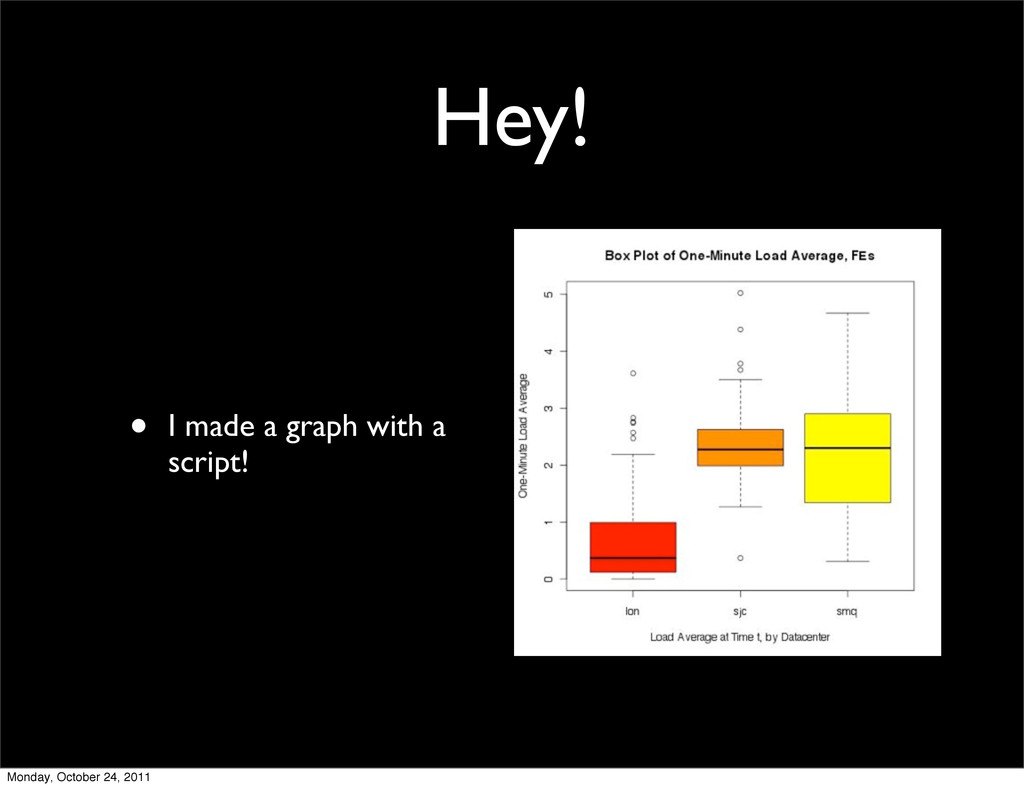
1 3.78 smq 2 2.57 smq 3 3.69 smq 4 0.86 smq • Looks like there’s outliers. That could spell trouble! You found them with R awesomeness. Horay! boxplot(cpu[,1] ~ cpu[,2], xlab="Load Average at Time t, by Datacenter", ylab="One-Minute Load Average", main="Box Plot of One-Minute Load Average, FEs", col=topo.colors(3)) Monday, October 24, 2011
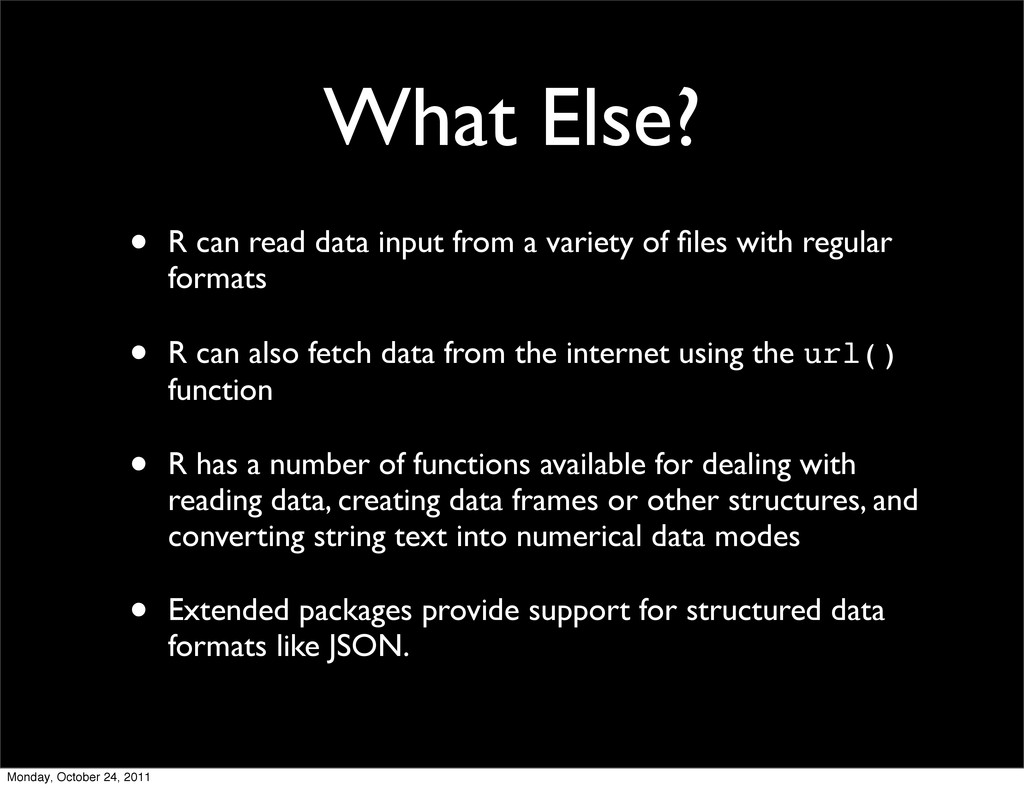
variety of files with regular formats • R can also fetch data from the internet using the url() function • R has a number of functions available for dealing with reading data, creating data frames or other structures, and converting string text into numerical data modes • Extended packages provide support for structured data formats like JSON. Monday, October 24, 2011
Programming, Norman Matloff, Copyright 2011 No Starch Press • Statistical Analysis with R, John M. Quick, Copyright 2011 Packt Publishing Monday, October 24, 2011
![Scalars • One-element vectors > x <- 8 > x[1]](https://files.speakerdeck.com/presentations/4eca96e920e521005400f789/slide_15.jpg)
![Barplot barplot(table(access[,7])) Monday, October 24, 2011](https://files.speakerdeck.com/presentations/4eca96e920e521005400f789/slide_22.jpg)
![Barplot v2 barplot(table(access[,7]),ylab="Number of Pages",xlab="Return Code",main="Plot of Return Codes") Monday,](https://files.speakerdeck.com/presentations/4eca96e920e521005400f789/slide_23.jpg)
![Barplot v3 barplot(table(access[, 7]),ylab="Number of Pages",xlab="Return Code",main="Plot of Return Codes",](https://files.speakerdeck.com/presentations/4eca96e920e521005400f789/slide_24.jpg)