Upgrade to Pro
— share decks privately, control downloads, hide ads and more …
Speaker Deck
Features
Speaker Deck
PRO
Sign in
Sign up for free
Search
Search
Ruby profiling - David Grayson
Search
Las Vegas Ruby Group
August 28, 2013
93
0
Share
Embed
Copy iframe code
Copy JS code
Copy link
Start on current slide
Ruby profiling - David Grayson
Las Vegas Ruby Group
August 28, 2013
More Decks by Las Vegas Ruby Group
See All by Las Vegas Ruby Group
Ruby ISO Standard - David Grayson
lvrug
0
180
Windows Automation - Howard Feldman
lvrug
0
120
Separating Your Application from Rails - Brian Hughes
lvrug
0
170
SWIG and Ruby - David Grayson
lvrug
0
110
Practical Object-Oriented Design in Ruby - Charles Jackson
lvrug
3
150
The Hamster Gem - Ryan Mulligan
lvrug
1
130
Varnish+Redis - Russ Smith
lvrug
1
150
Lambdas and Pops - Jan Hettich
lvrug
0
120
Making Good Use of Fonts - Russ Smith
lvrug
1
120
Featured
See All Featured
Sam Torres - BigQuery for SEOs
techseoconnect
PRO
0
300
Thoughts on Productivity
jonyablonski
76
5.2k
Visualization
eitanlees
152
17k
svc-hook: hooking system calls on ARM64 by binary rewriting
retrage
2
320
VelocityConf: Rendering Performance Case Studies
addyosmani
333
25k
The Curse of the Amulet
leimatthew05
2
13k
Designing Dashboards & Data Visualisations in Web Apps
destraynor
231
55k
KATA
mclloyd
PRO
35
15k
Between Models and Reality
mayunak
4
360
The MySQL Ecosystem @ GitHub 2015
samlambert
251
13k
B2B Lead Gen: Tactics, Traps & Triumph
marketingsoph
0
170
Mind Mapping
helmedeiros
PRO
1
270
Transcript
Ruby profiling David Grayson Las Vegas Ruby Meetup 2013-08-28
None
Two profiling tools ruby-prof rblineprof
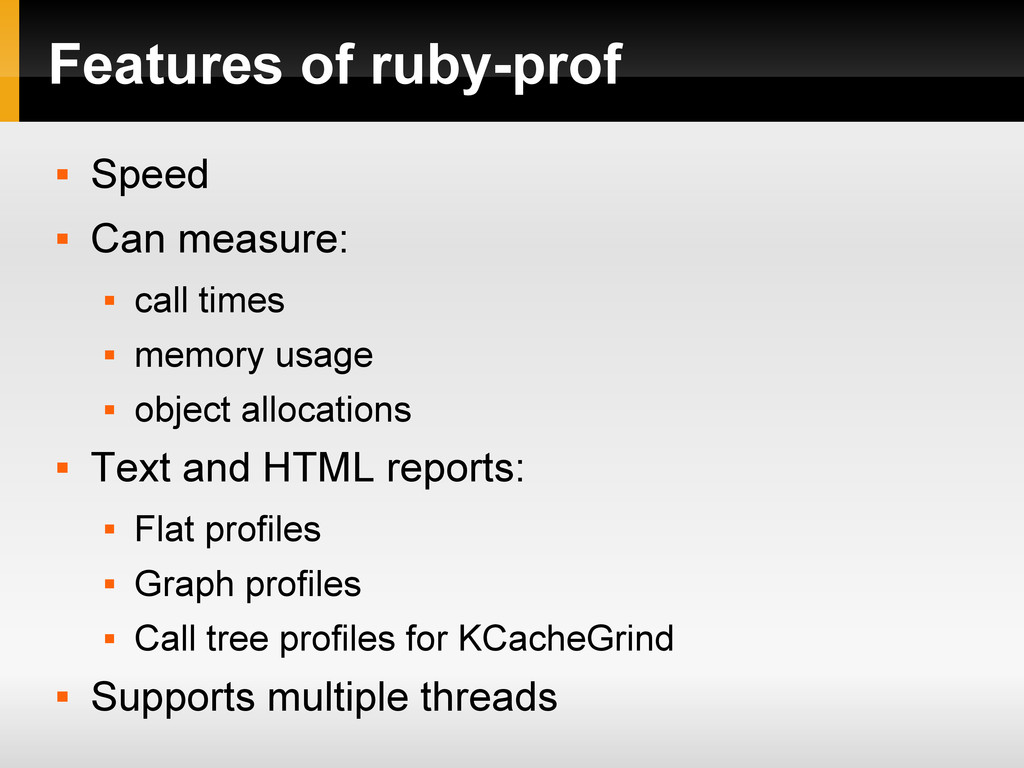
Features of ruby-prof Speed Can measure: call
times memory usage object allocations Text and HTML reports: Flat profiles Graph profiles Call tree profiles for KCacheGrind Supports multiple threads
Example ruby-prof profiles
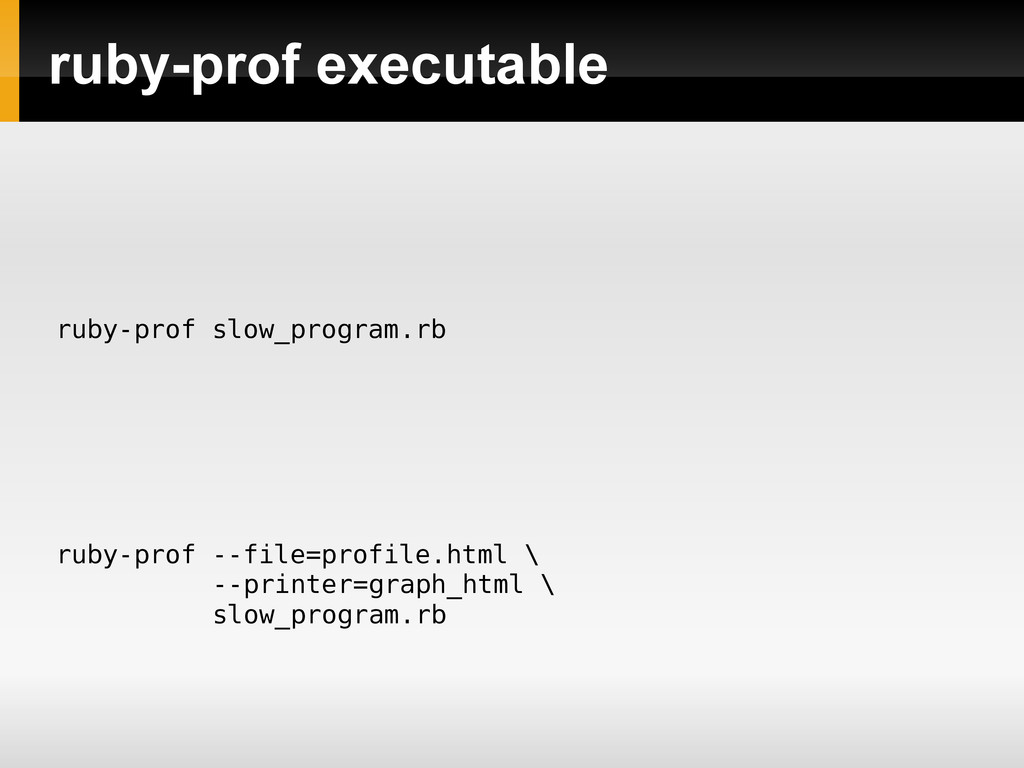
ruby-prof executable ruby-prof --file=profile.html \ --printer=graph_html \ slow_program.rb ruby-prof slow_program.rb
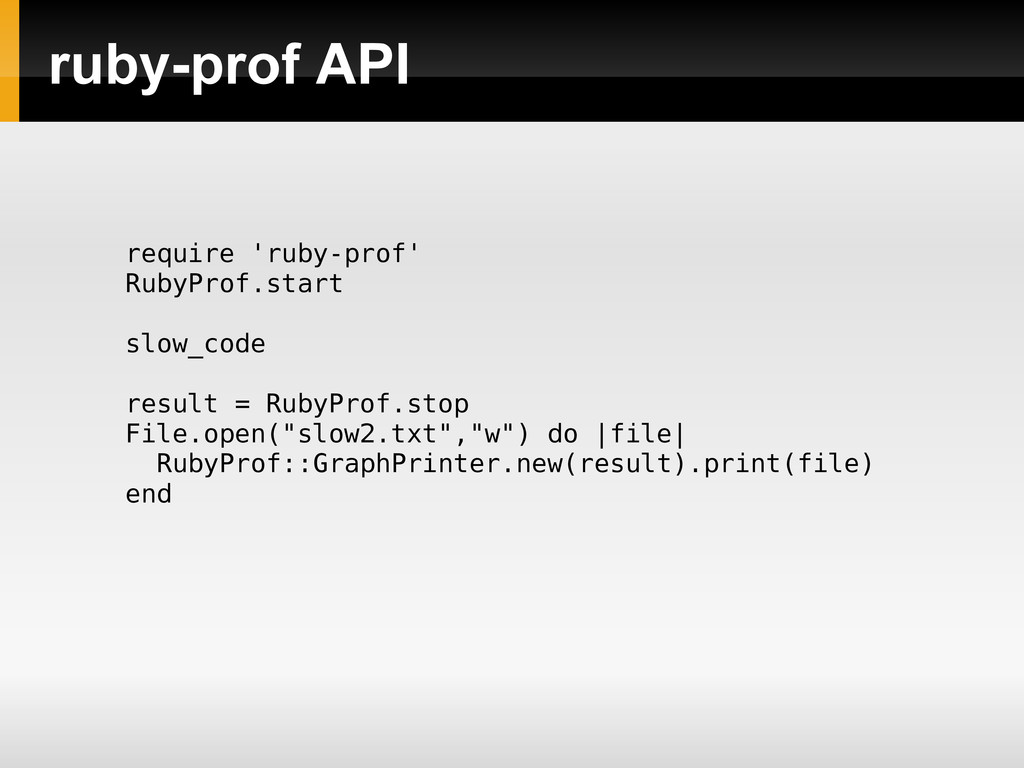
ruby-prof API require 'ruby-prof' RubyProf.start slow_code result = RubyProf.stop File.open("slow2.txt","w")
do |file| RubyProf::GraphPrinter.new(result).print(file) end
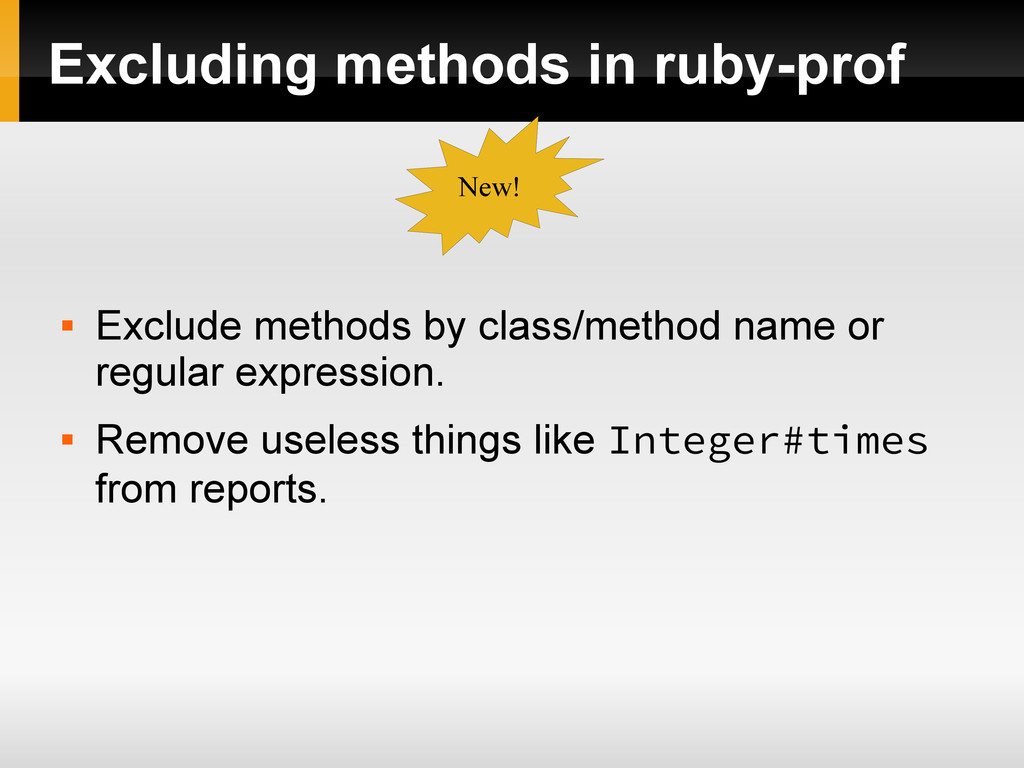
Excluding methods in ruby-prof Exclude methods by class/method name
or regular expression. Remove useless things like Integer#times from reports. New!
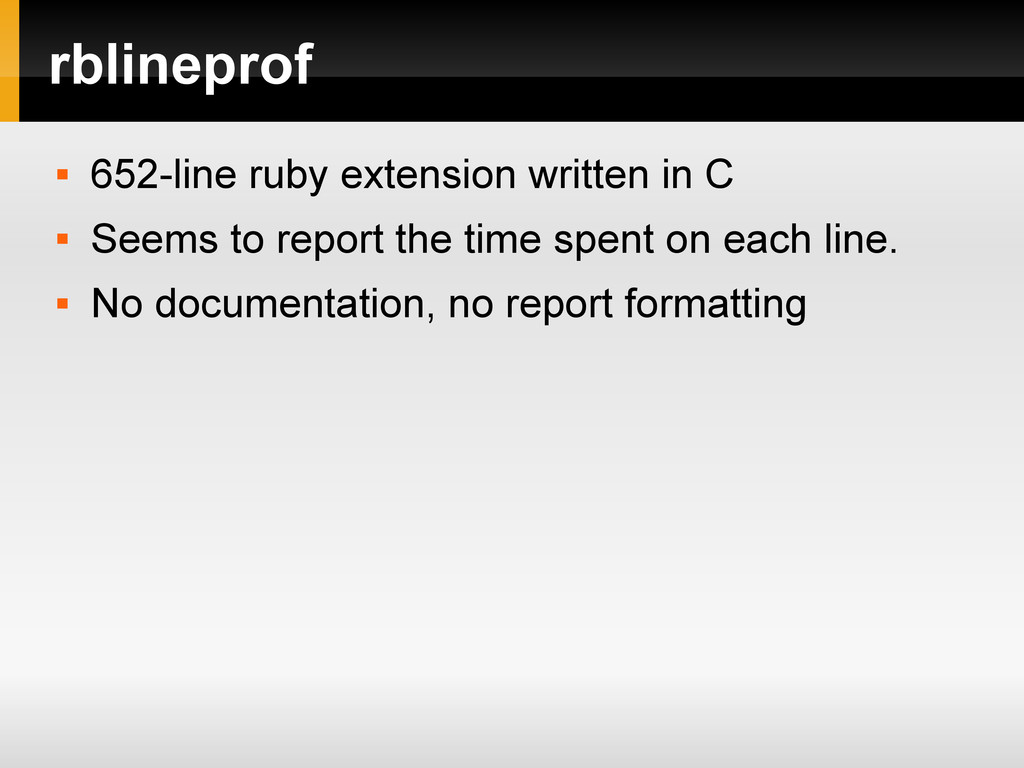
rblineprof 652-line ruby extension written in C Seems
to report the time spent on each line. No documentation, no report formatting
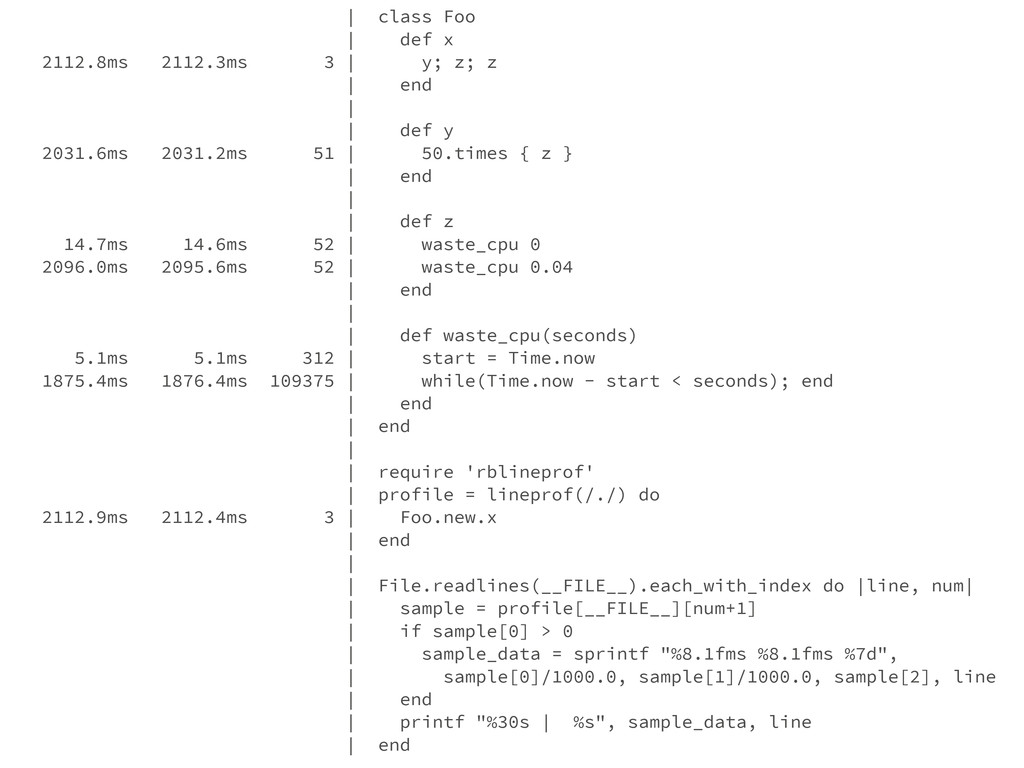
| class Foo | def x 2112.8ms 2112.3ms 3 |
y; z; z | end | | def y 2031.6ms 2031.2ms 51 | 50.times { z } | end | | def z 14.7ms 14.6ms 52 | waste_cpu 0 2096.0ms 2095.6ms 52 | waste_cpu 0.04 | end | | def waste_cpu(seconds) 5.1ms 5.1ms 312 | start = Time.now 1875.4ms 1876.4ms 109375 | while(Time.now - start < seconds); end | end | end | | require 'rblineprof' | profile = lineprof(/./) do 2112.9ms 2112.4ms 3 | Foo.new.x | end | | File.readlines(__FILE__).each_with_index do |line, num| | sample = profile[__FILE__][num+1] | if sample[0] > 0 | sample_data = sprintf "%8.1fms %8.1fms %7d", | sample[0]/1000.0, sample[1]/1000.0, sample[2], line | end | printf "%30s | %s", sample_data, line | end
References ruby-prof https://github.com/ruby-prof/ruby-prof/ rblineprof https://github.com/tmm1/rblineprof
https://github.com/blog/1475-escape-velocity