AUTOMATION AND ROBOTICS RESEARCH METHODOLOGY ENTITLED “INTELLECTAL PROPERTY RIGHTS ” Name Assi. Prof. Pooja Powar A&R Engg Department SITCOE,YADRAVICHALKARANJI.
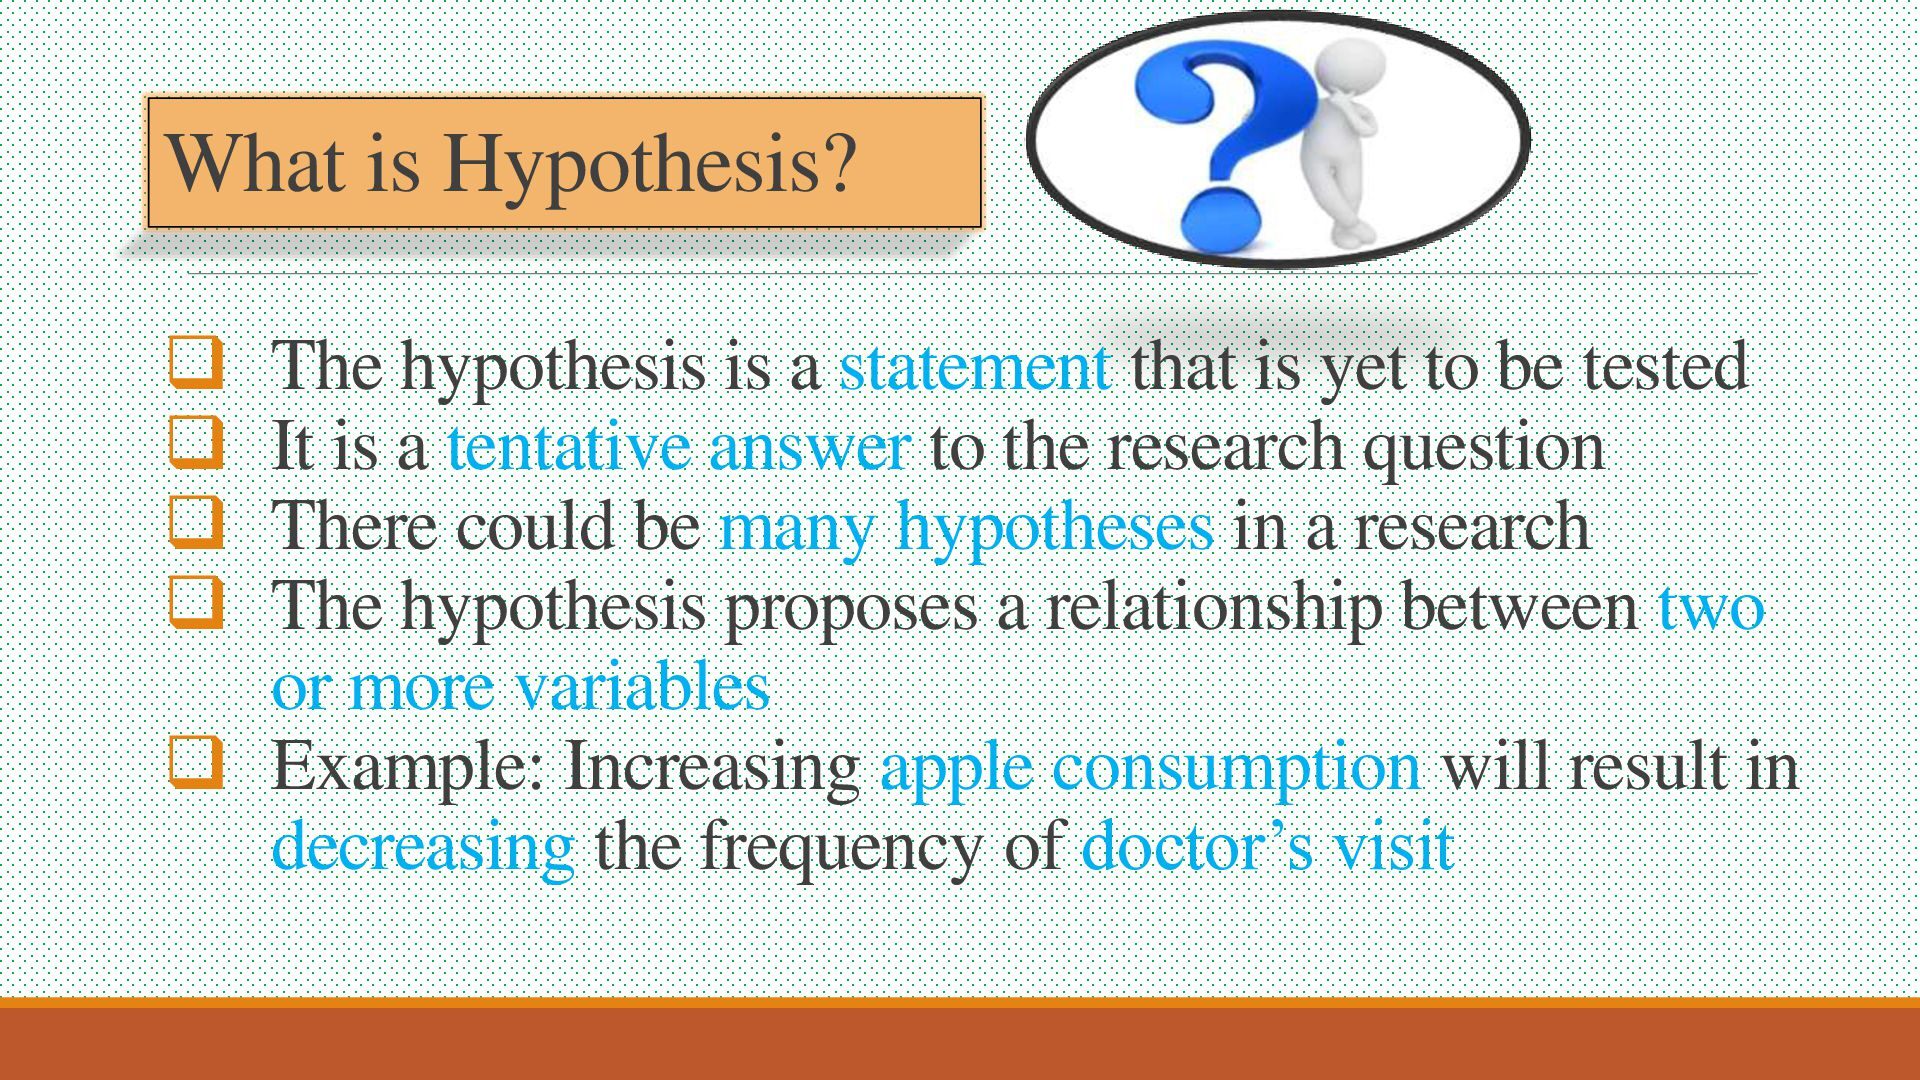
is yet to be tested It is a tentative answer to the research question There could be many hypotheses in a research The hypothesis proposes a relationship between two or more variables Example: Increasing apple consumption will result in decreasing the frequency of doctor’s visit
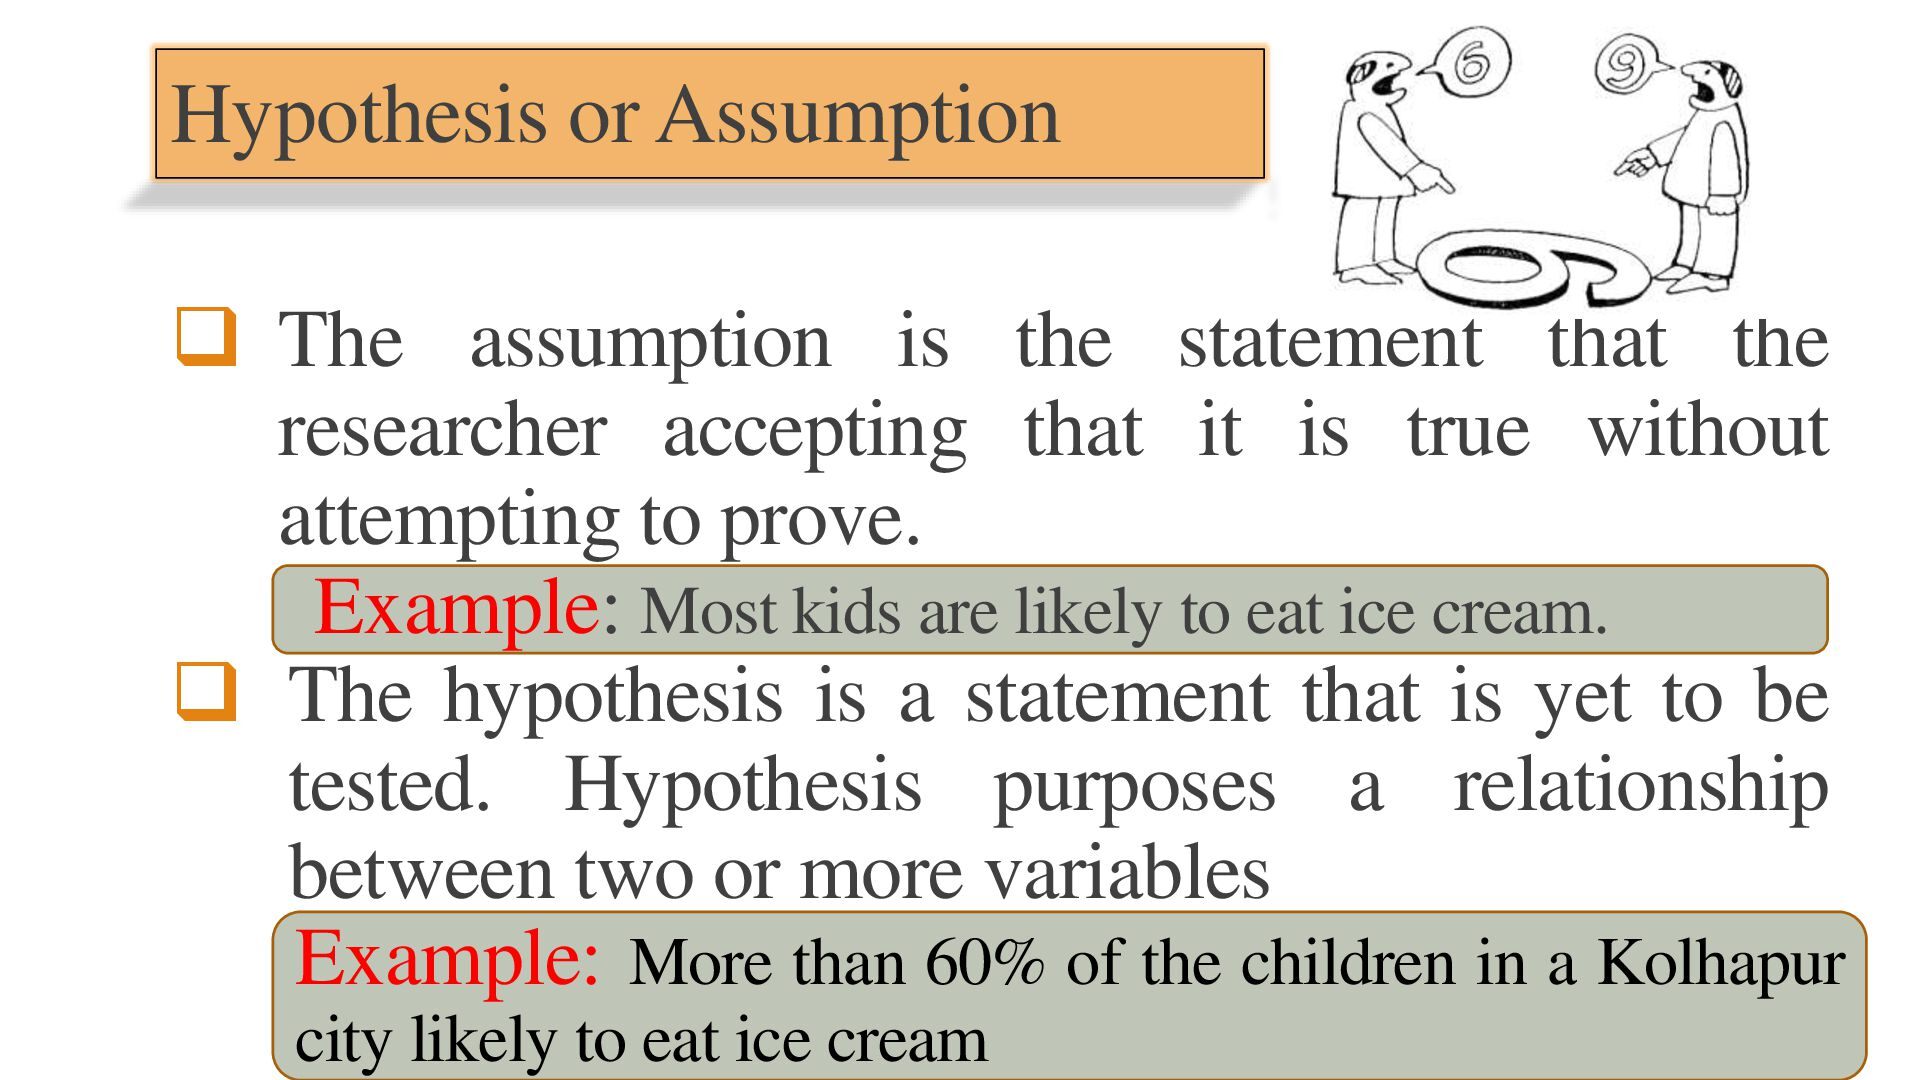
the researcher accepting that it is true without attempting to prove. Example: Most kids are likely to eat ice cream. The hypothesis is a statement that is yet to be tested. Hypothesis purposes a relationship between two or more variables Example: More than 60% of the children in a Kolhapur city likely to eat ice cream
the problem has been stated and the literature study has been concluded. It is formulated when the researcher is aware of the theoretical and empirical background to the problem.
should strive to furnish an acceptable explanation of the phenomenon. It must be verifiable. It must be formulated in simple, understandable terms. It should corresponds with existing knowledge.
p t u a l C l a r i t y S p e c i f i c i t y Te s t a b i l i t y Av a i l a b i l i t y o f Te c h n i q u e s T h e o r e t i c a l r e l e v a n c e C o n s i s t e n c y O b j e c t i v i t y S i m p l i c i t y
between one independent and one dependent variable. For Example – If you eat more vegetables, you will lose weight faster Where vegetables are the independent variable and weight loss is the dependent variable on the independent variable.
between two or more independent and two or more dependent variables. For Example – Eating more vegetables and fruits and exercising daily leads to weight loss, glowing skin, and minimizing the risk of a heart attack. Where, vegetables, fruits, and exercise are the independent variable, and weight loss, glowing skin, and heart attack is the dependent variable on the independent variable.
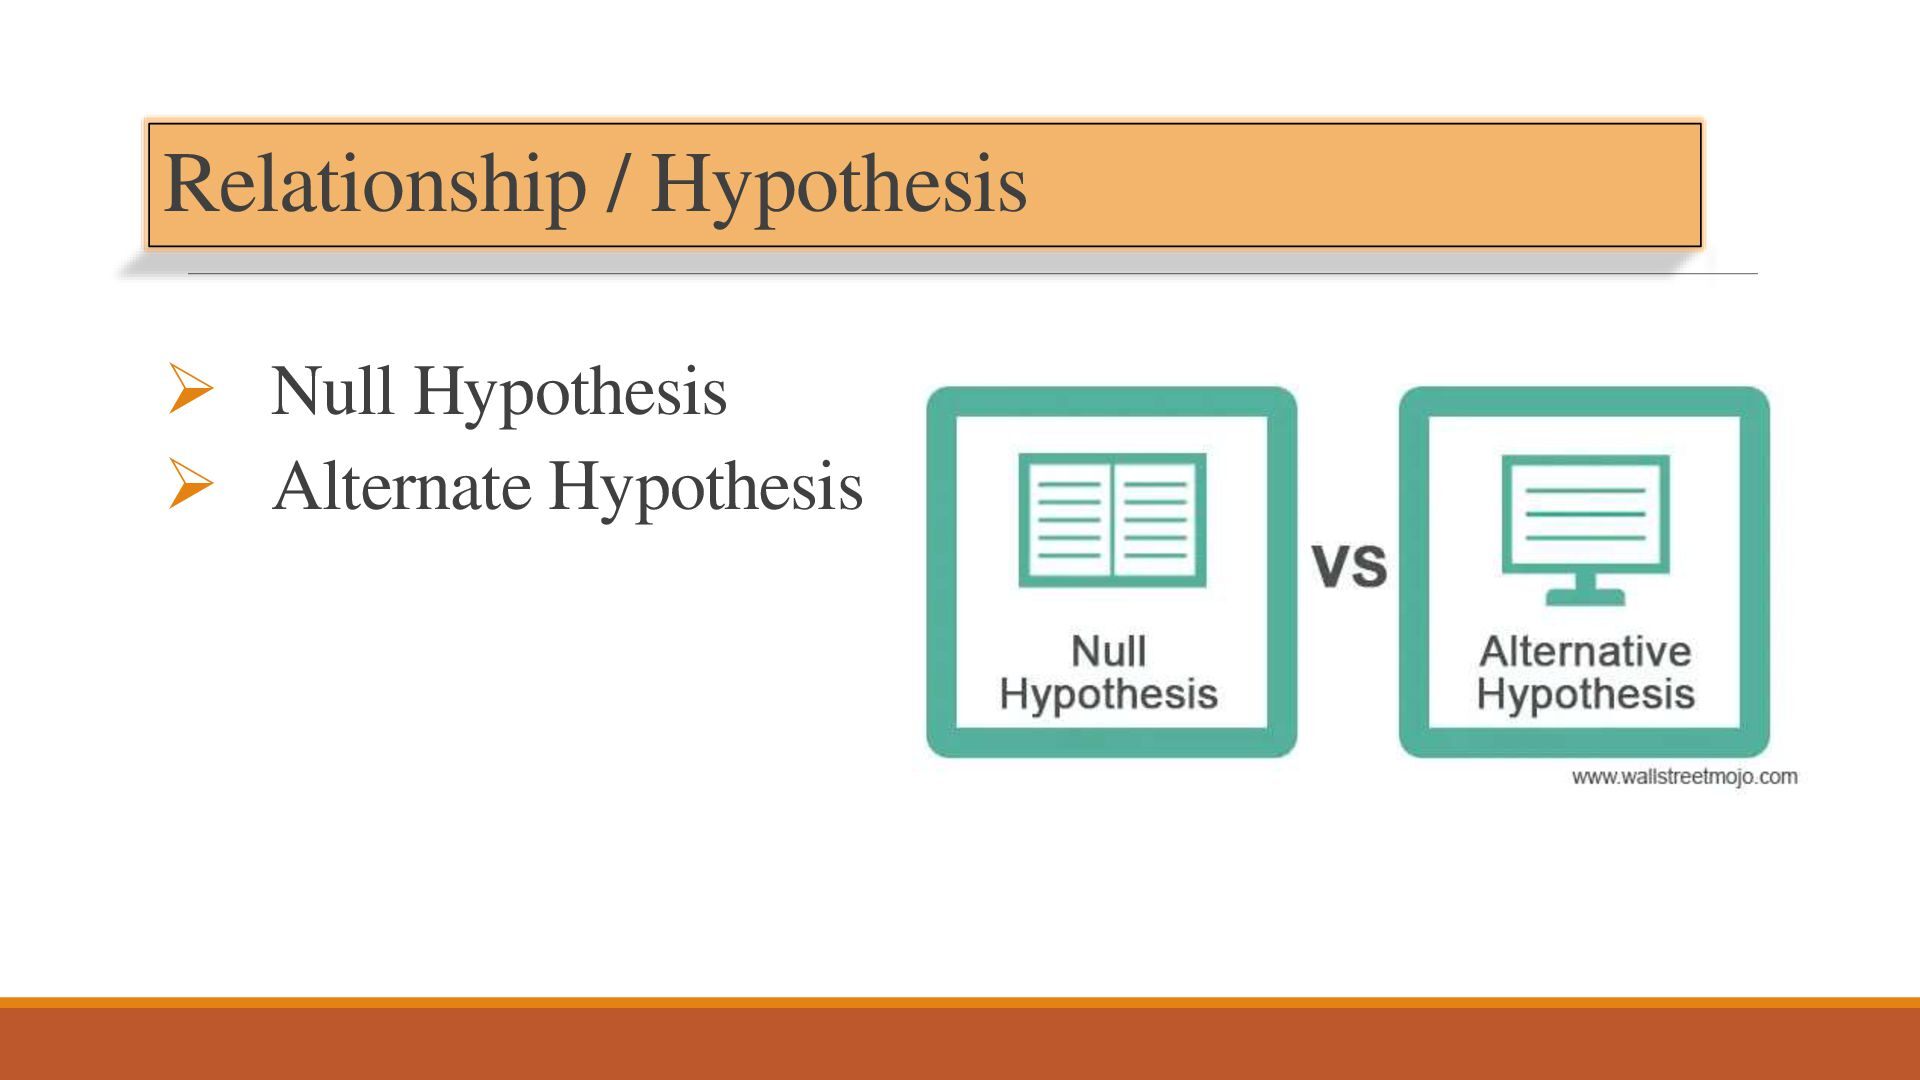
is no relationship between the two variables under research.No changes in the dependent variable due to changes in the independent variable. It is denoted by H0. For Example – There is no relationship between sugar intake and obesity. Age has no effect on how cell phones are used for internet access.
no relationship between the two variables under research. No changes in the independent variable effect the dependent variable. It is denoted by Ha or H1 For Example – There is a strong relationship between sugar intake and obesity.
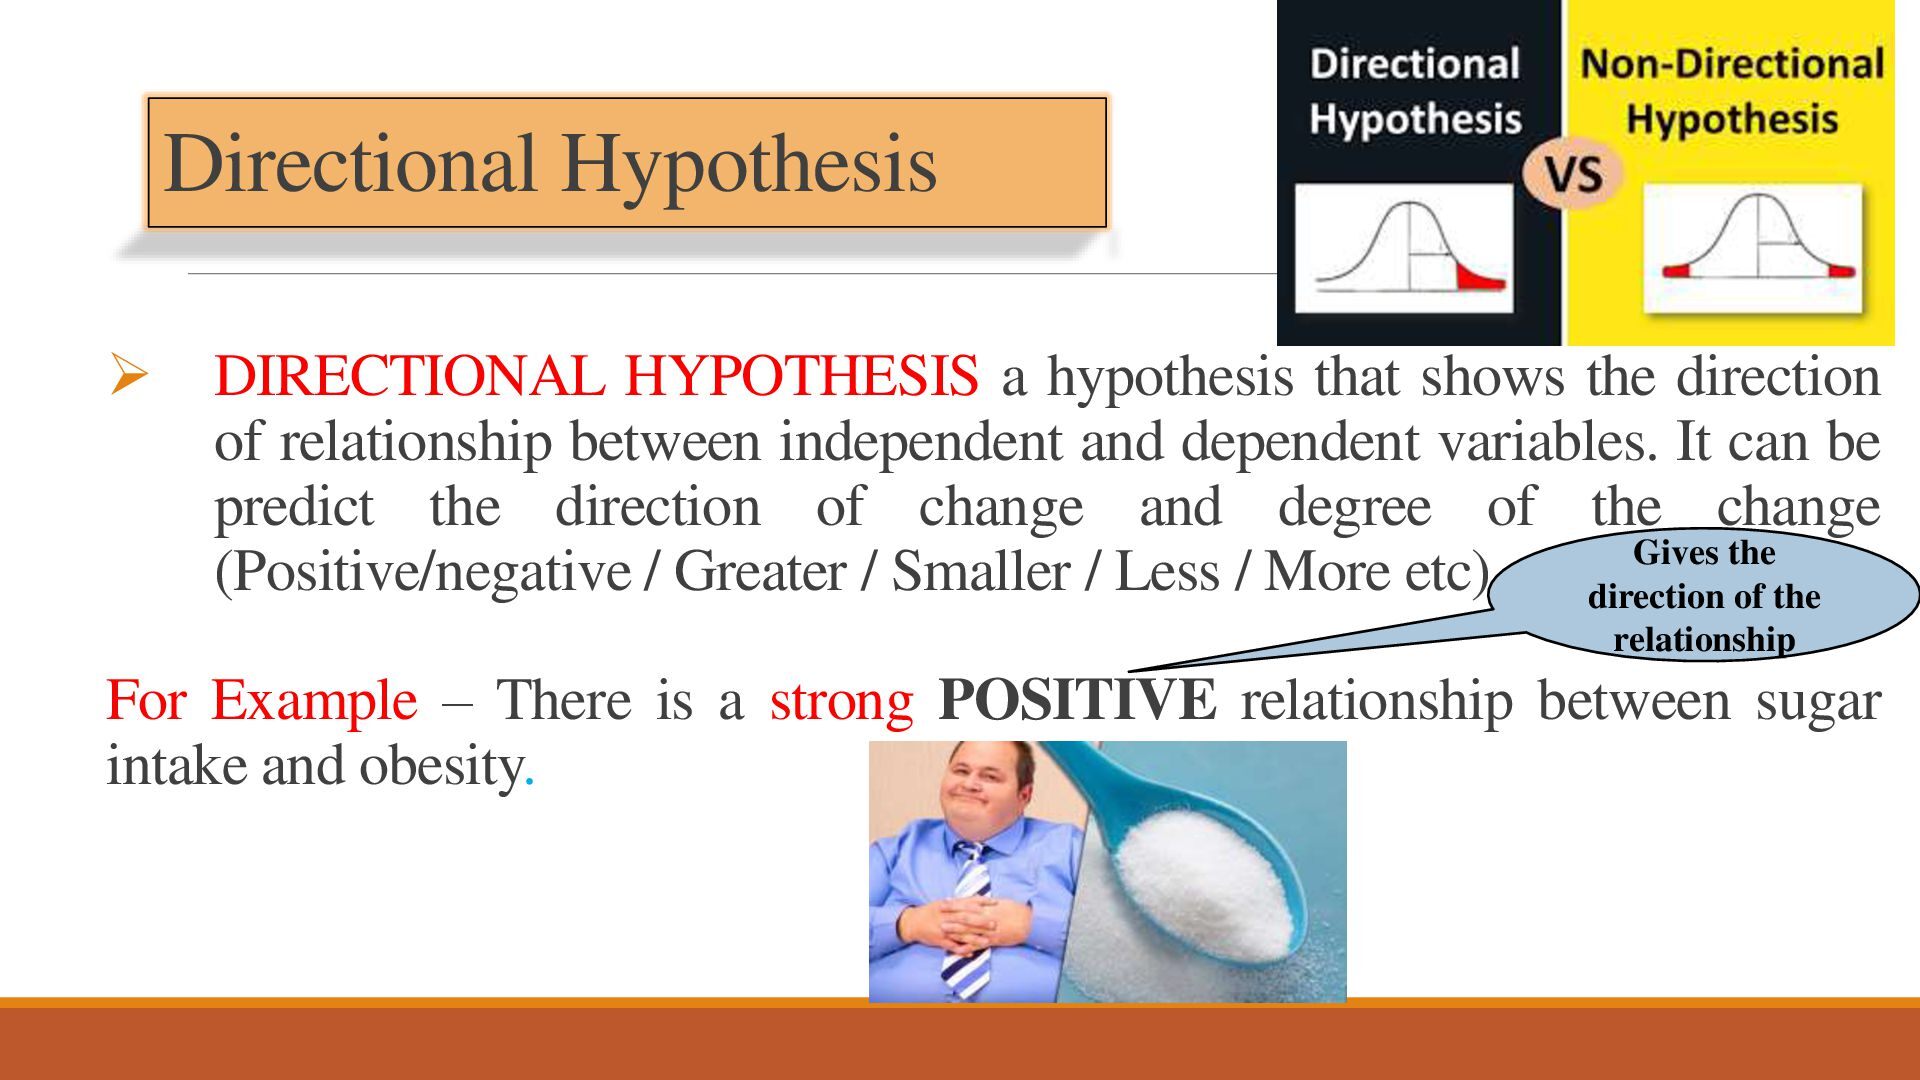
direction of relationship between independent and dependent variables. It can be predict the direction of change and degree of the change Gives the (Positive/negative / Greater / Smaller / Less / More etc) direction of the relationship For Example – There is a strong POSITIVE relationship between sugar intake and obesity.
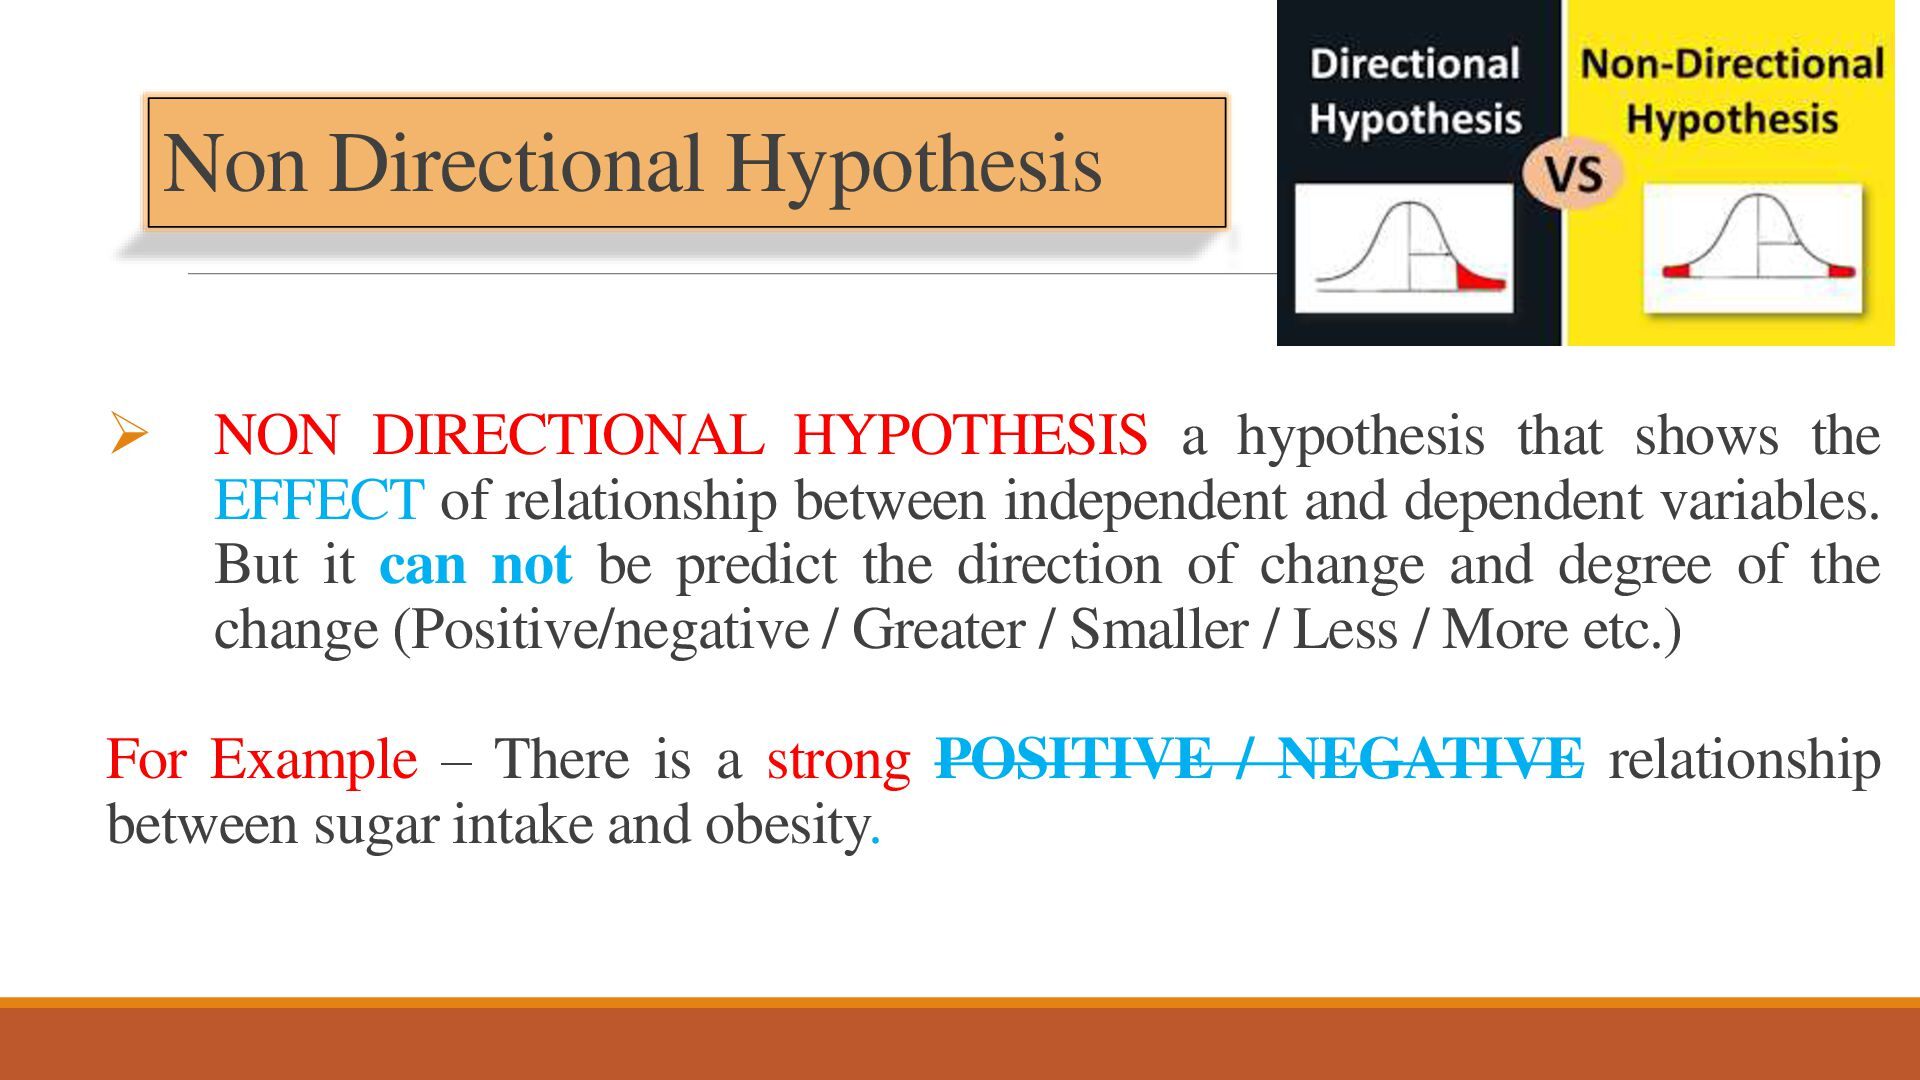
shows the EFFECT of relationship between independent and dependent variables. But it can not be predict the direction of change and degree of the change (Positive/negative / Greater / Smaller / Less / More etc.) For Example – There is a strong POSITIVE / NEGATIVE relationship between sugar intake and obesity.
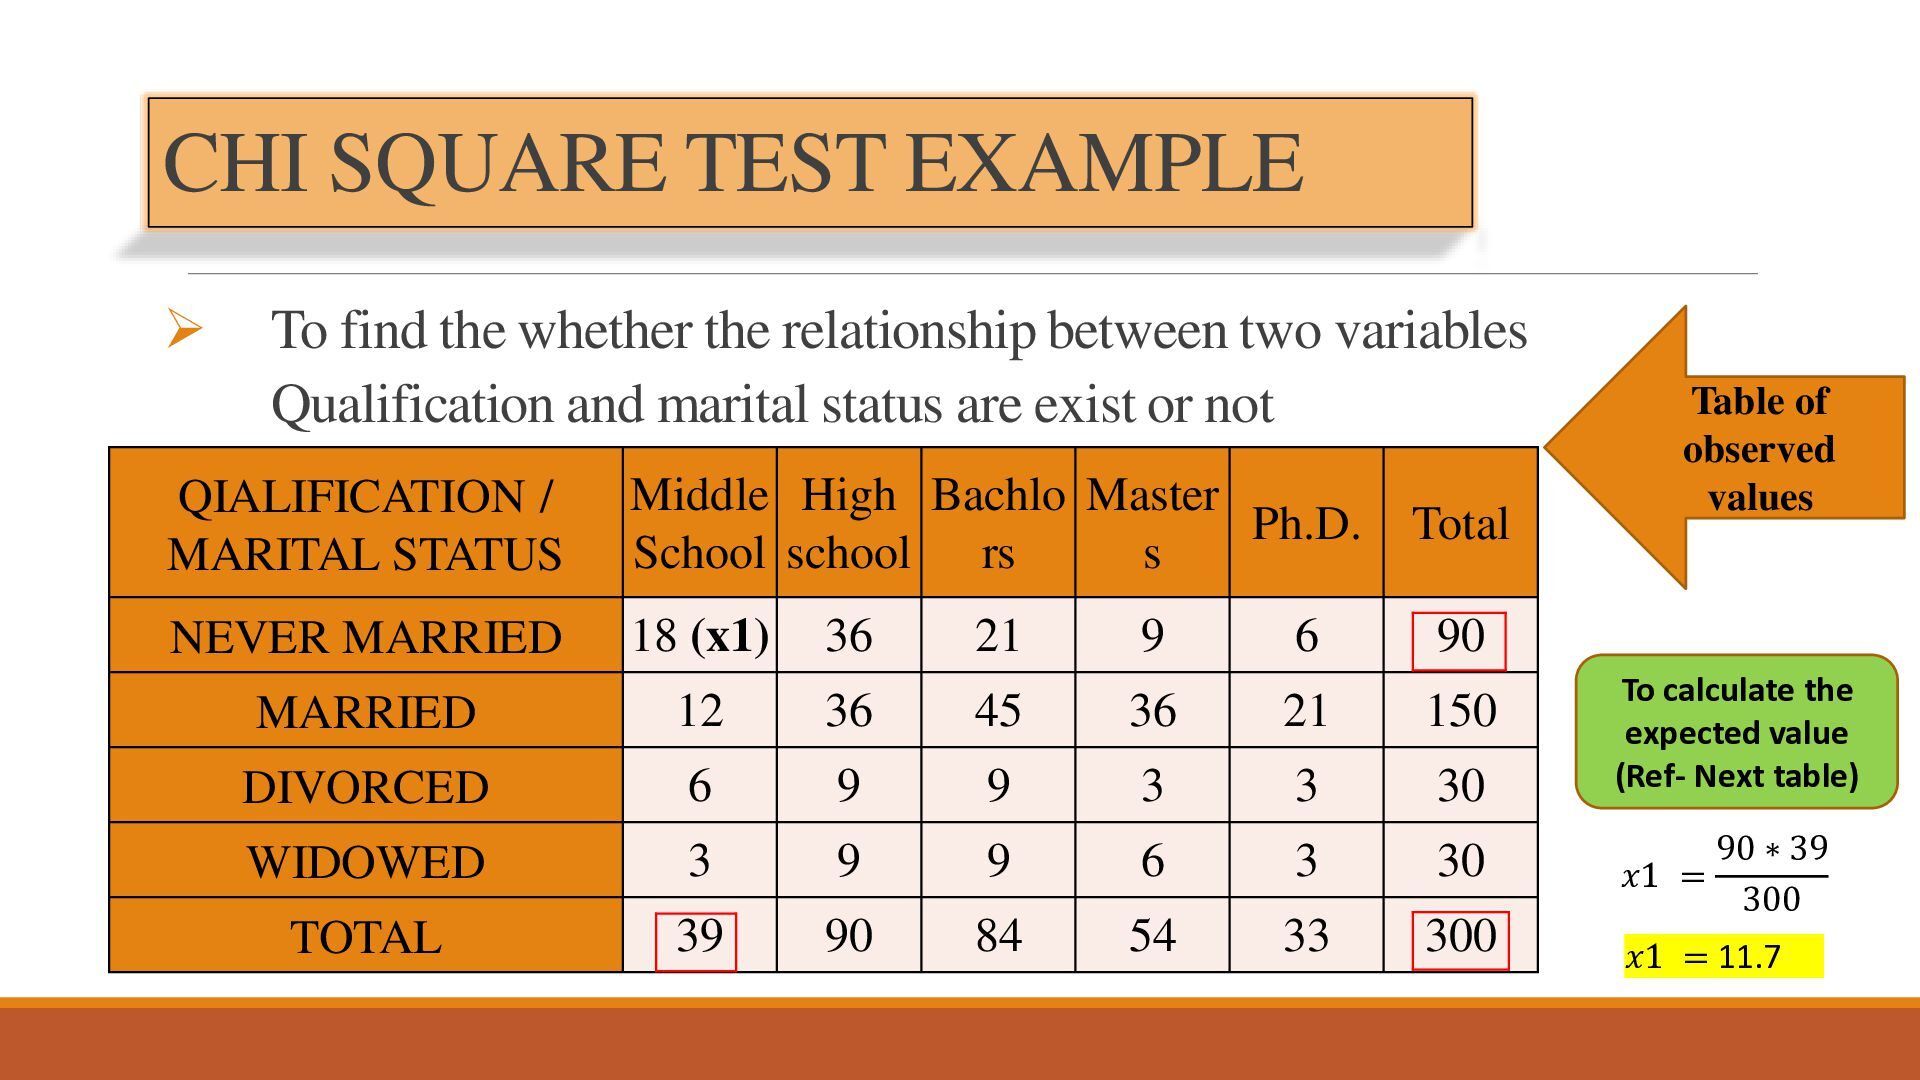
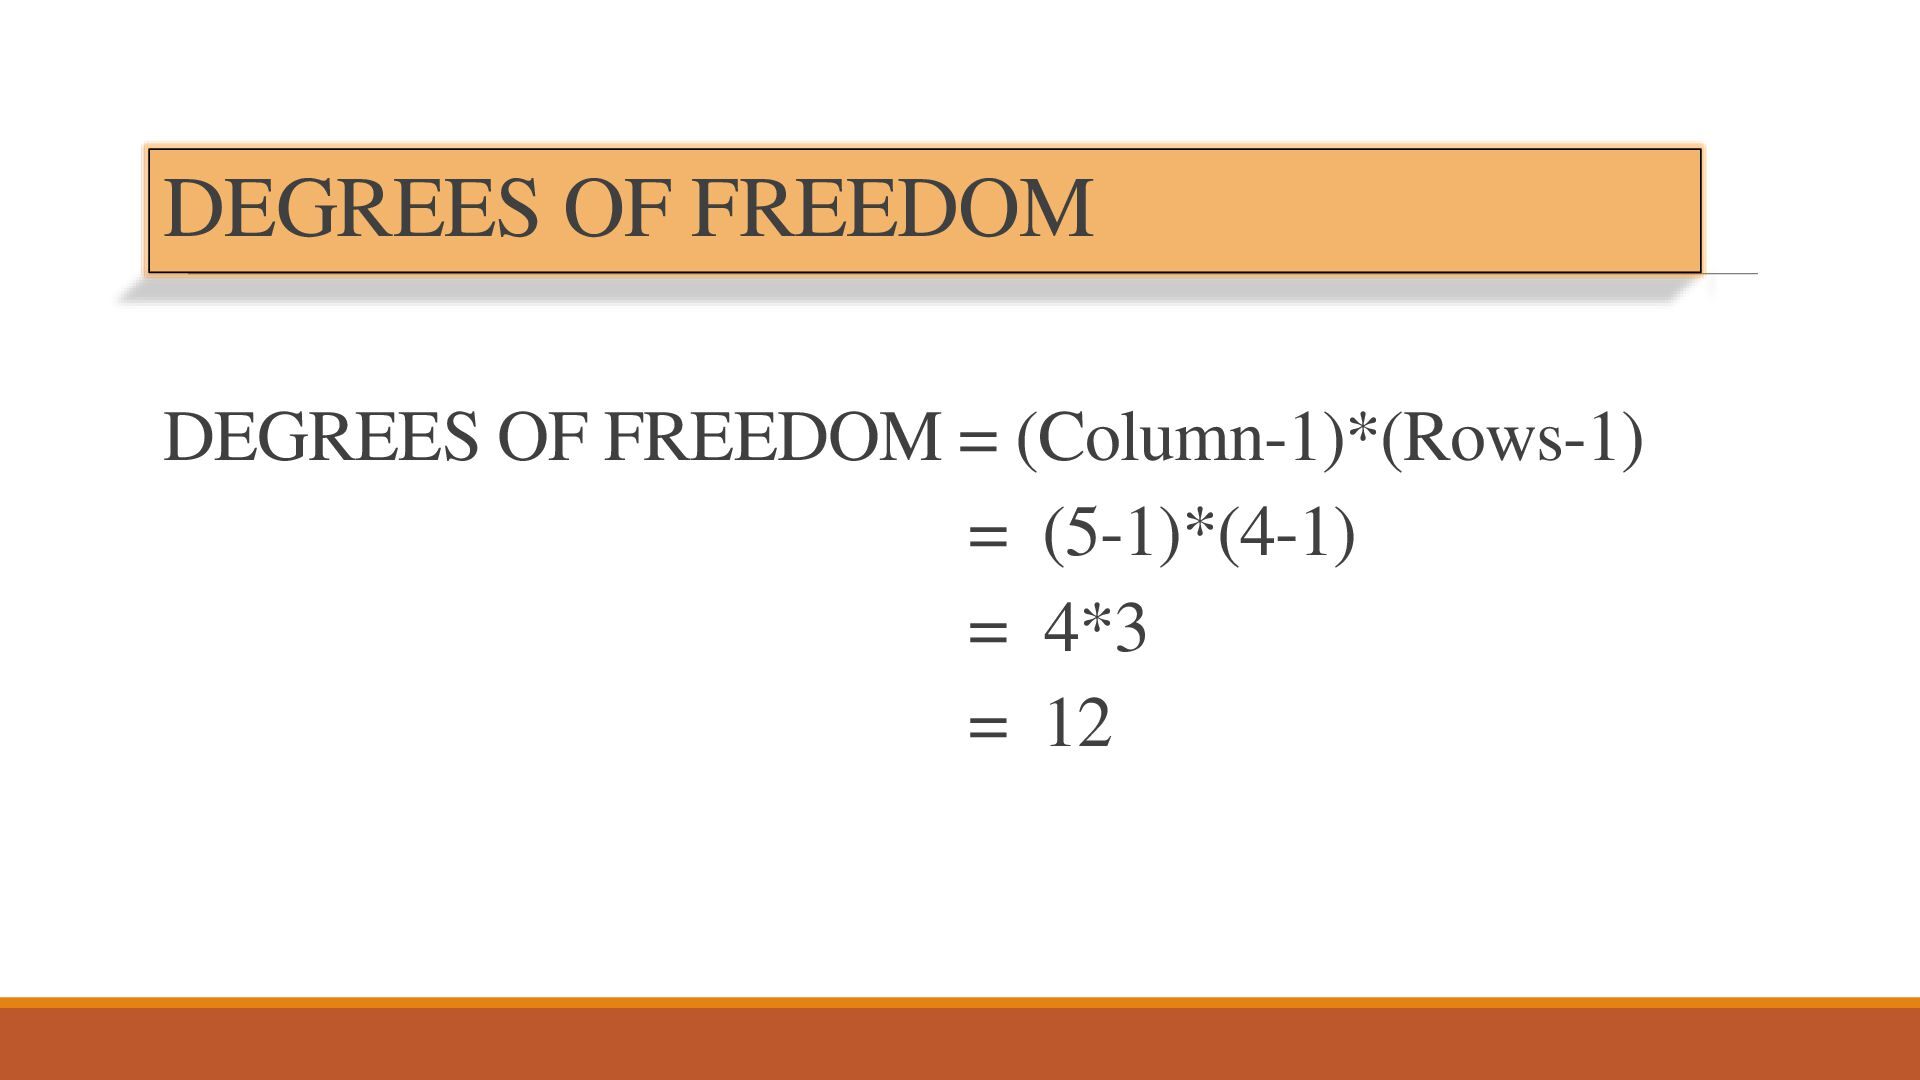
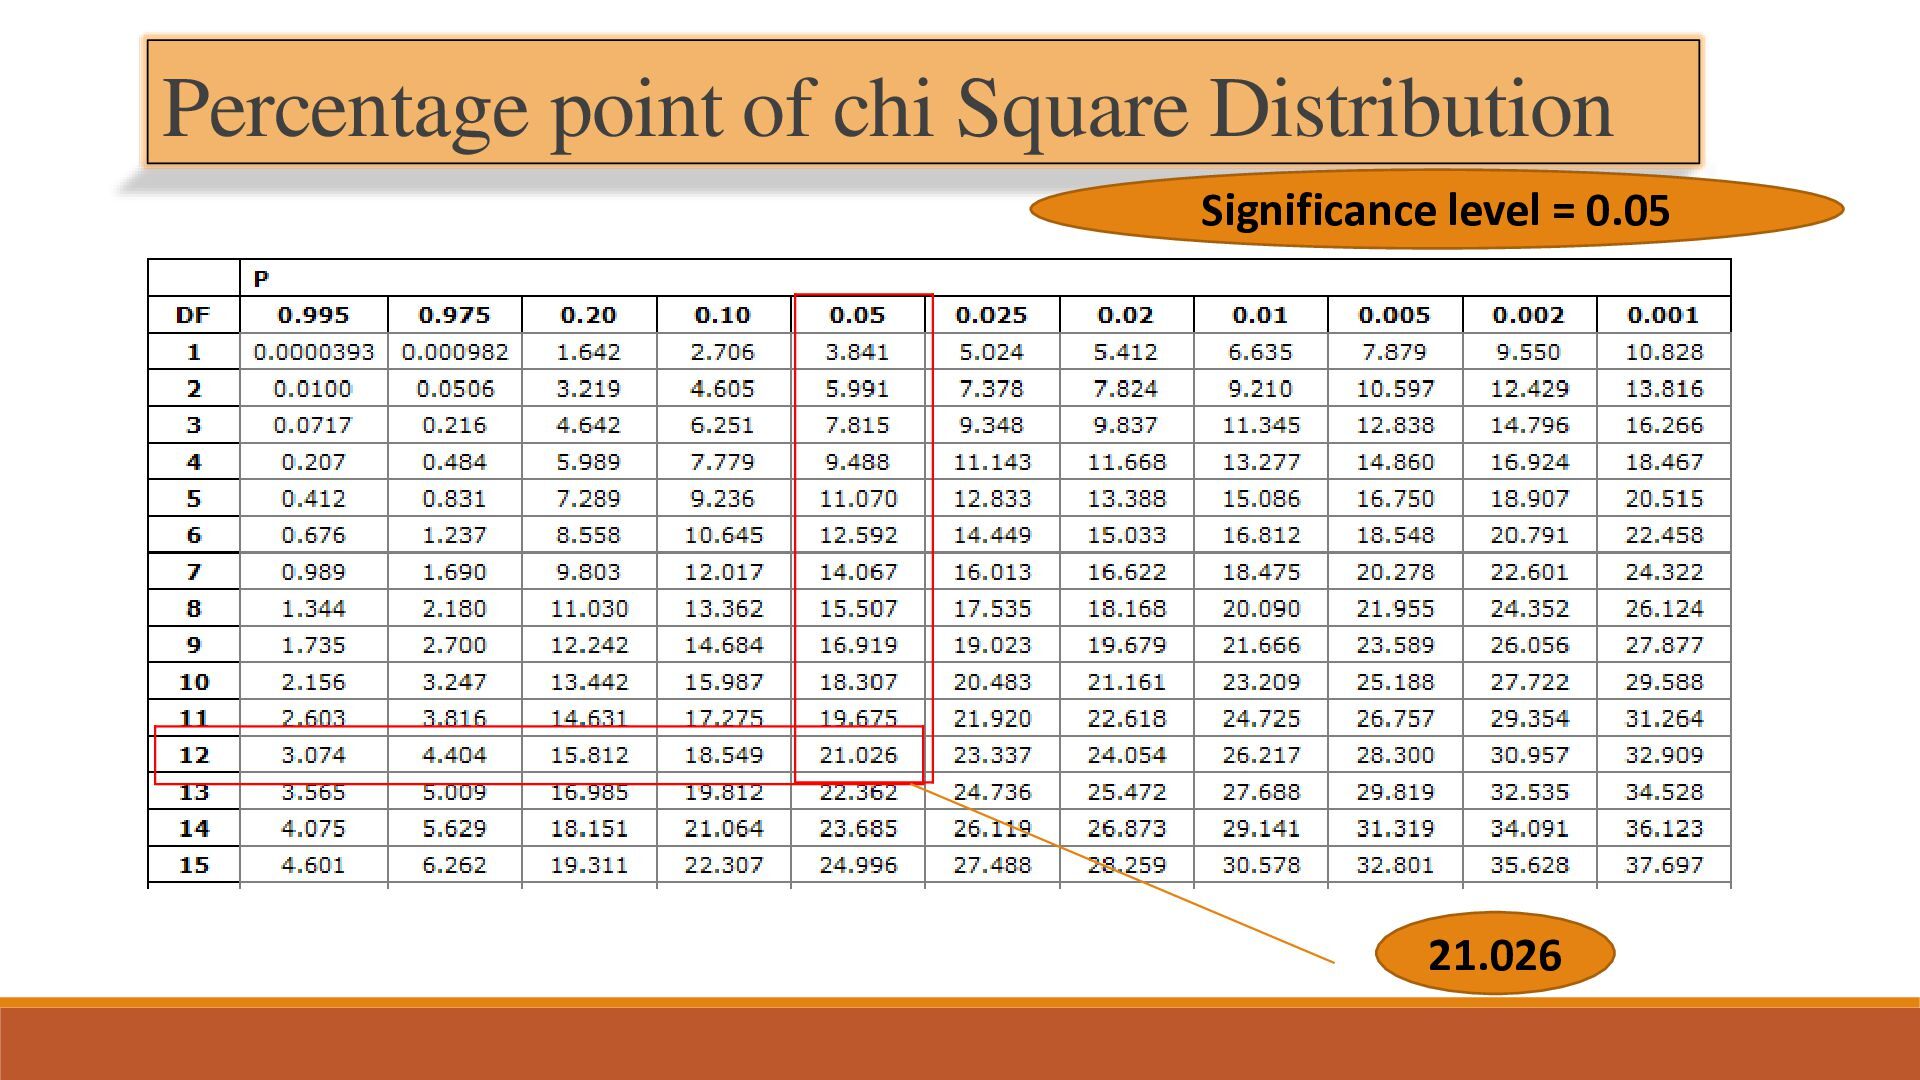
relationship between two variables Qualification and marital status are exist or not Table of observed values QIALIFICATION / MARITAL STATUS Middle High Bachlo Master Ph.D. School school rs s Total NEVER MARRIED 18 (x1) 36 21 9 6 90 MARRIED 12 36 45 36 21 150 DIVORCED 6 9 9 3 3 30 To calculate the expected value (Ref- Next table) WIDOWED 3 9 9 6 3 30 𝑥1 = TOTAL 39 90 84 54 33 300 𝑥1 = 11.7 90 ∗ 39 300
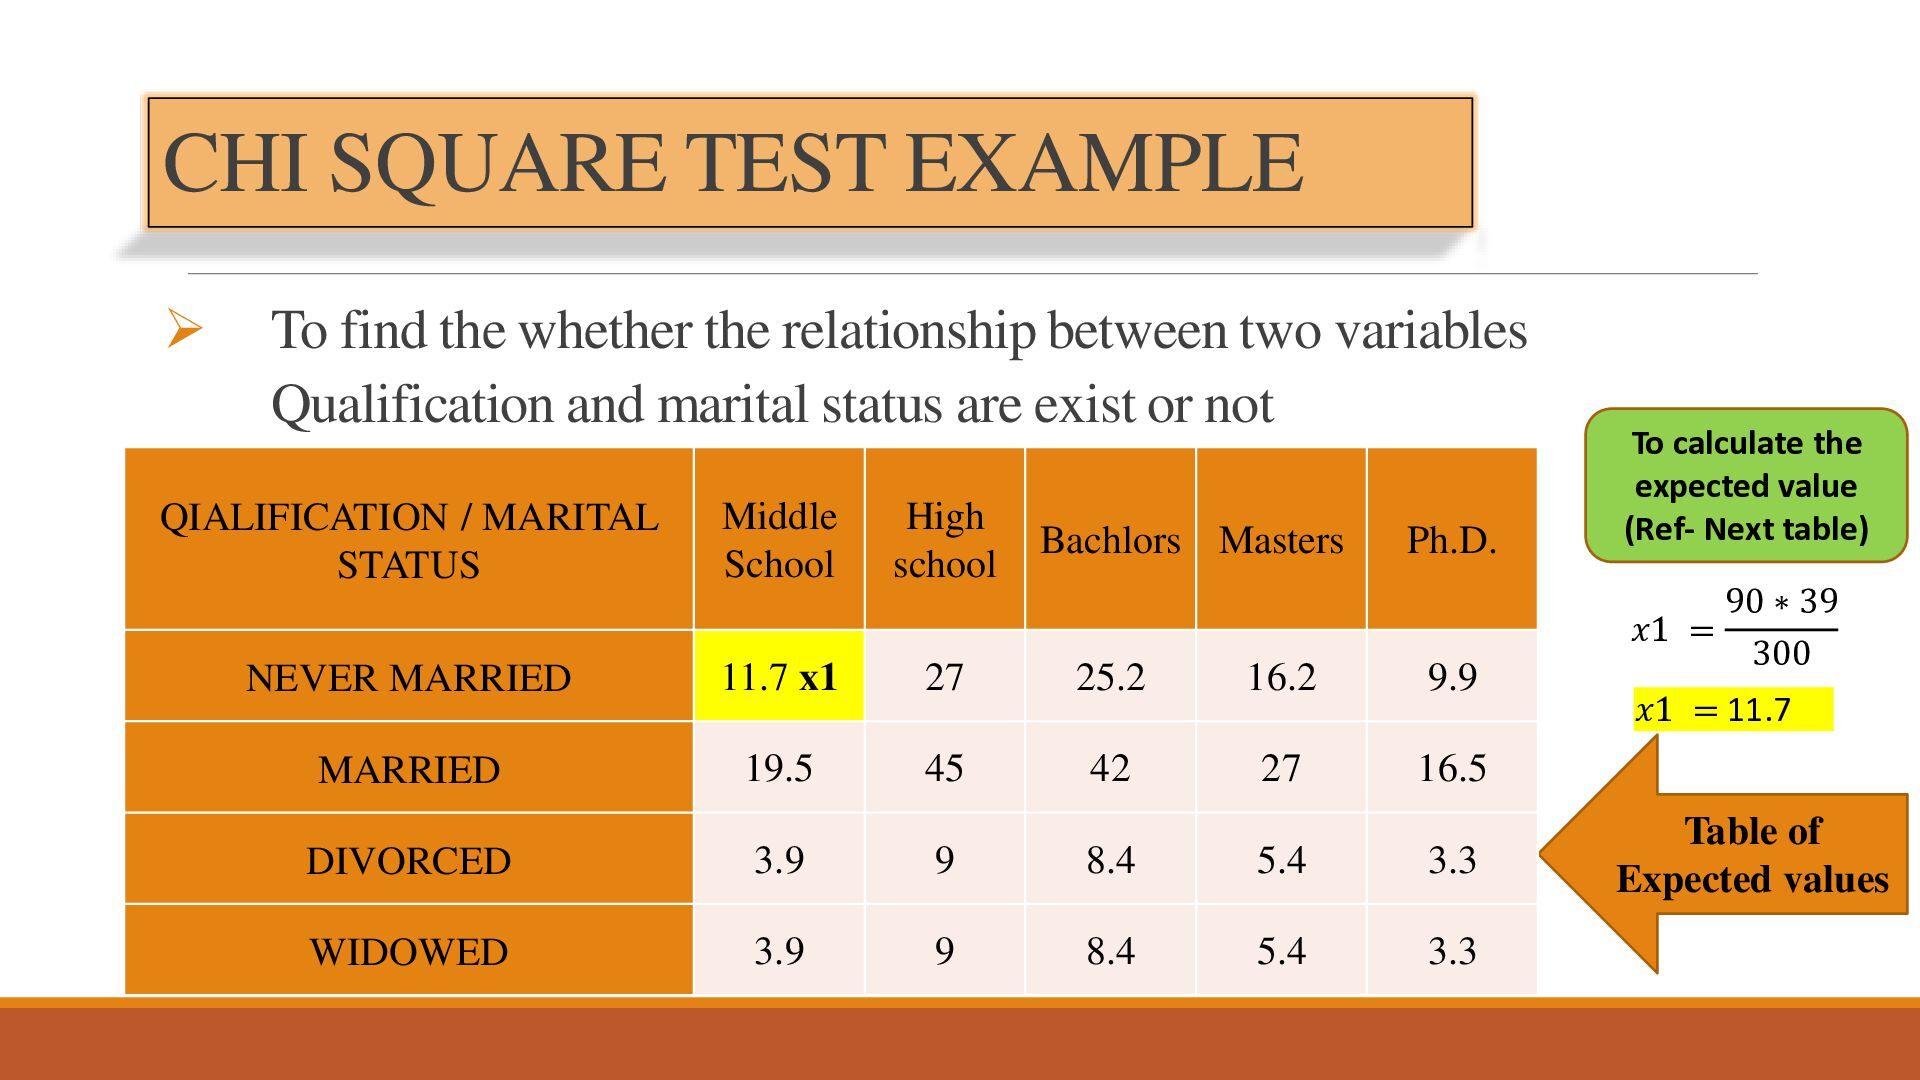
relationship between two variables Qualification and marital status are exist or not QIALIFICATION / MARITAL STATUS Middle School High school NEVER MARRIED 11.7 x1 27 25.2 16.2 9.9 MARRIED 19.5 45 42 27 16.5 Bachlors Masters Ph.D. DIVORCED 3.9 9 8.4 5.4 3.3 WIDOWED 3.9 9 8.4 5.4 3.3 To calculate the expected value (Ref- Next table) 90 ∗ 39 𝑥1 = 300 𝑥1 = 11.7 Table of Expected values
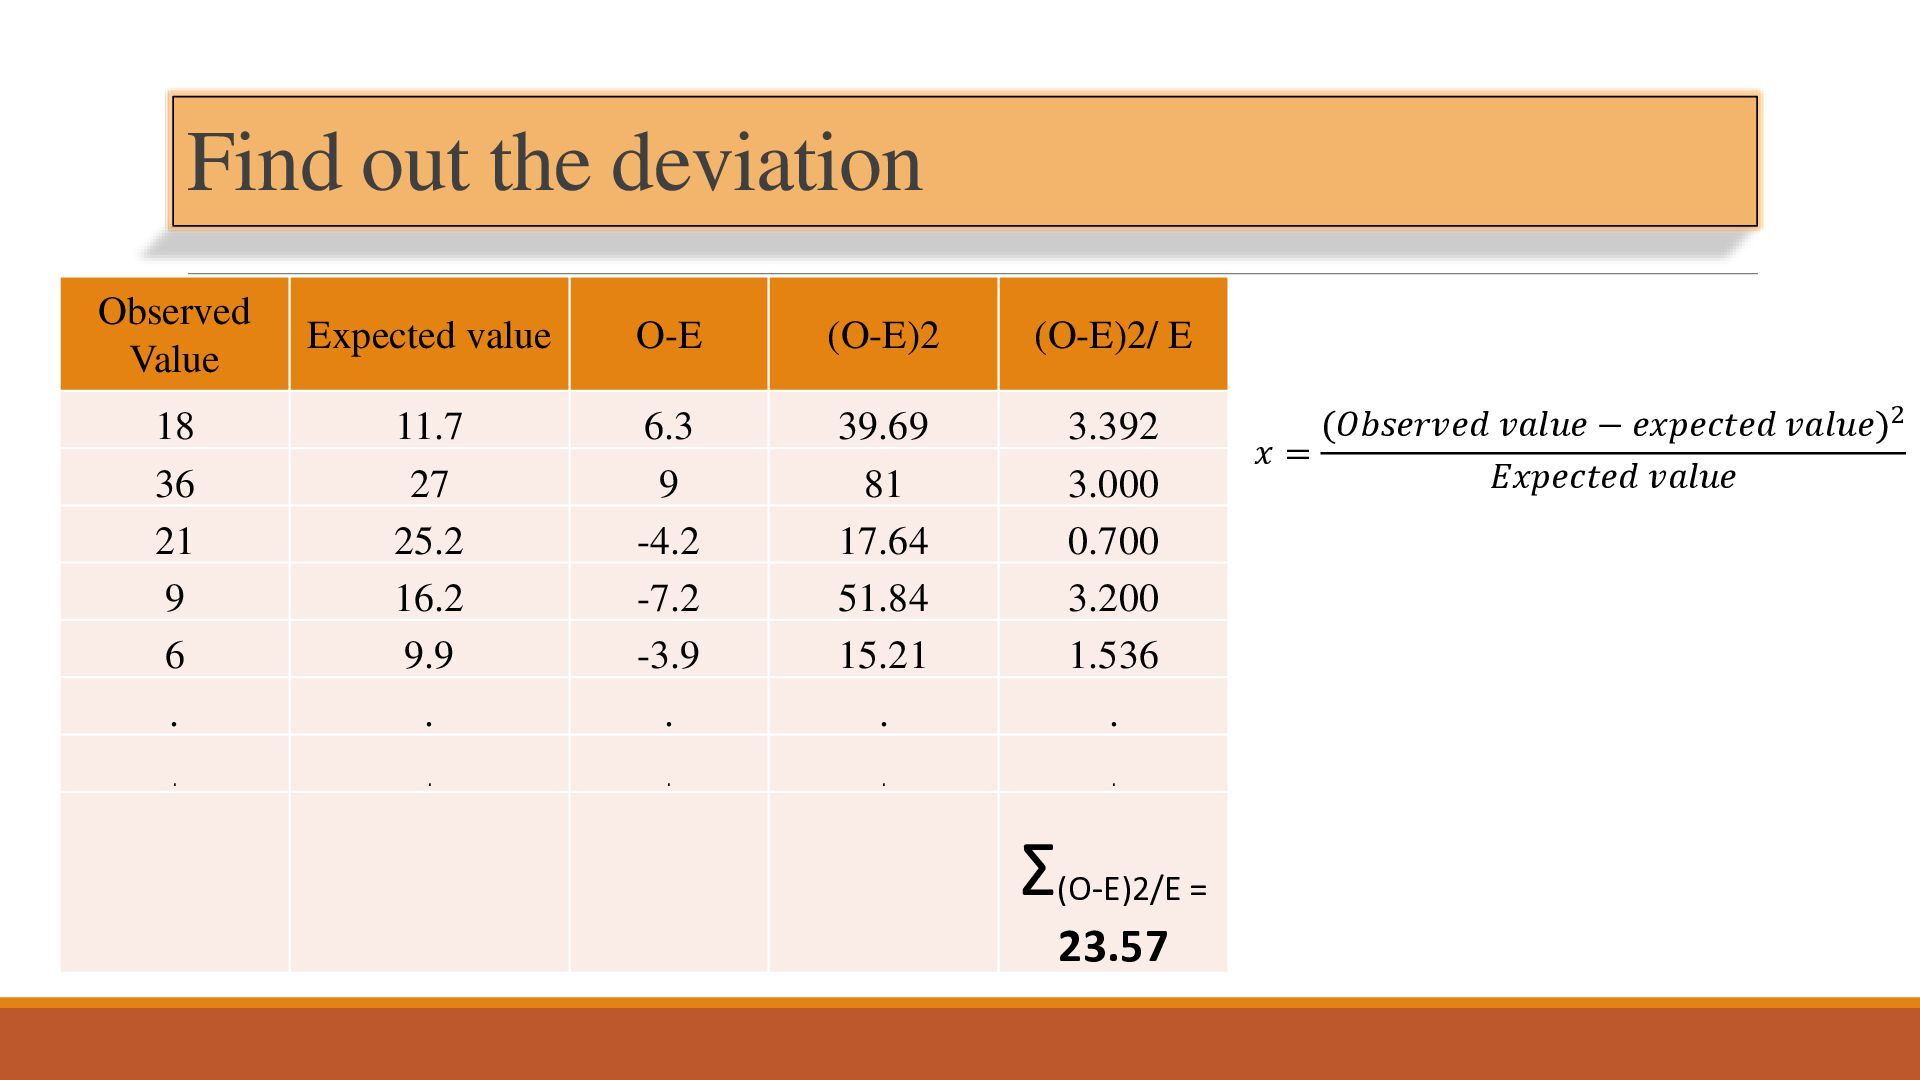
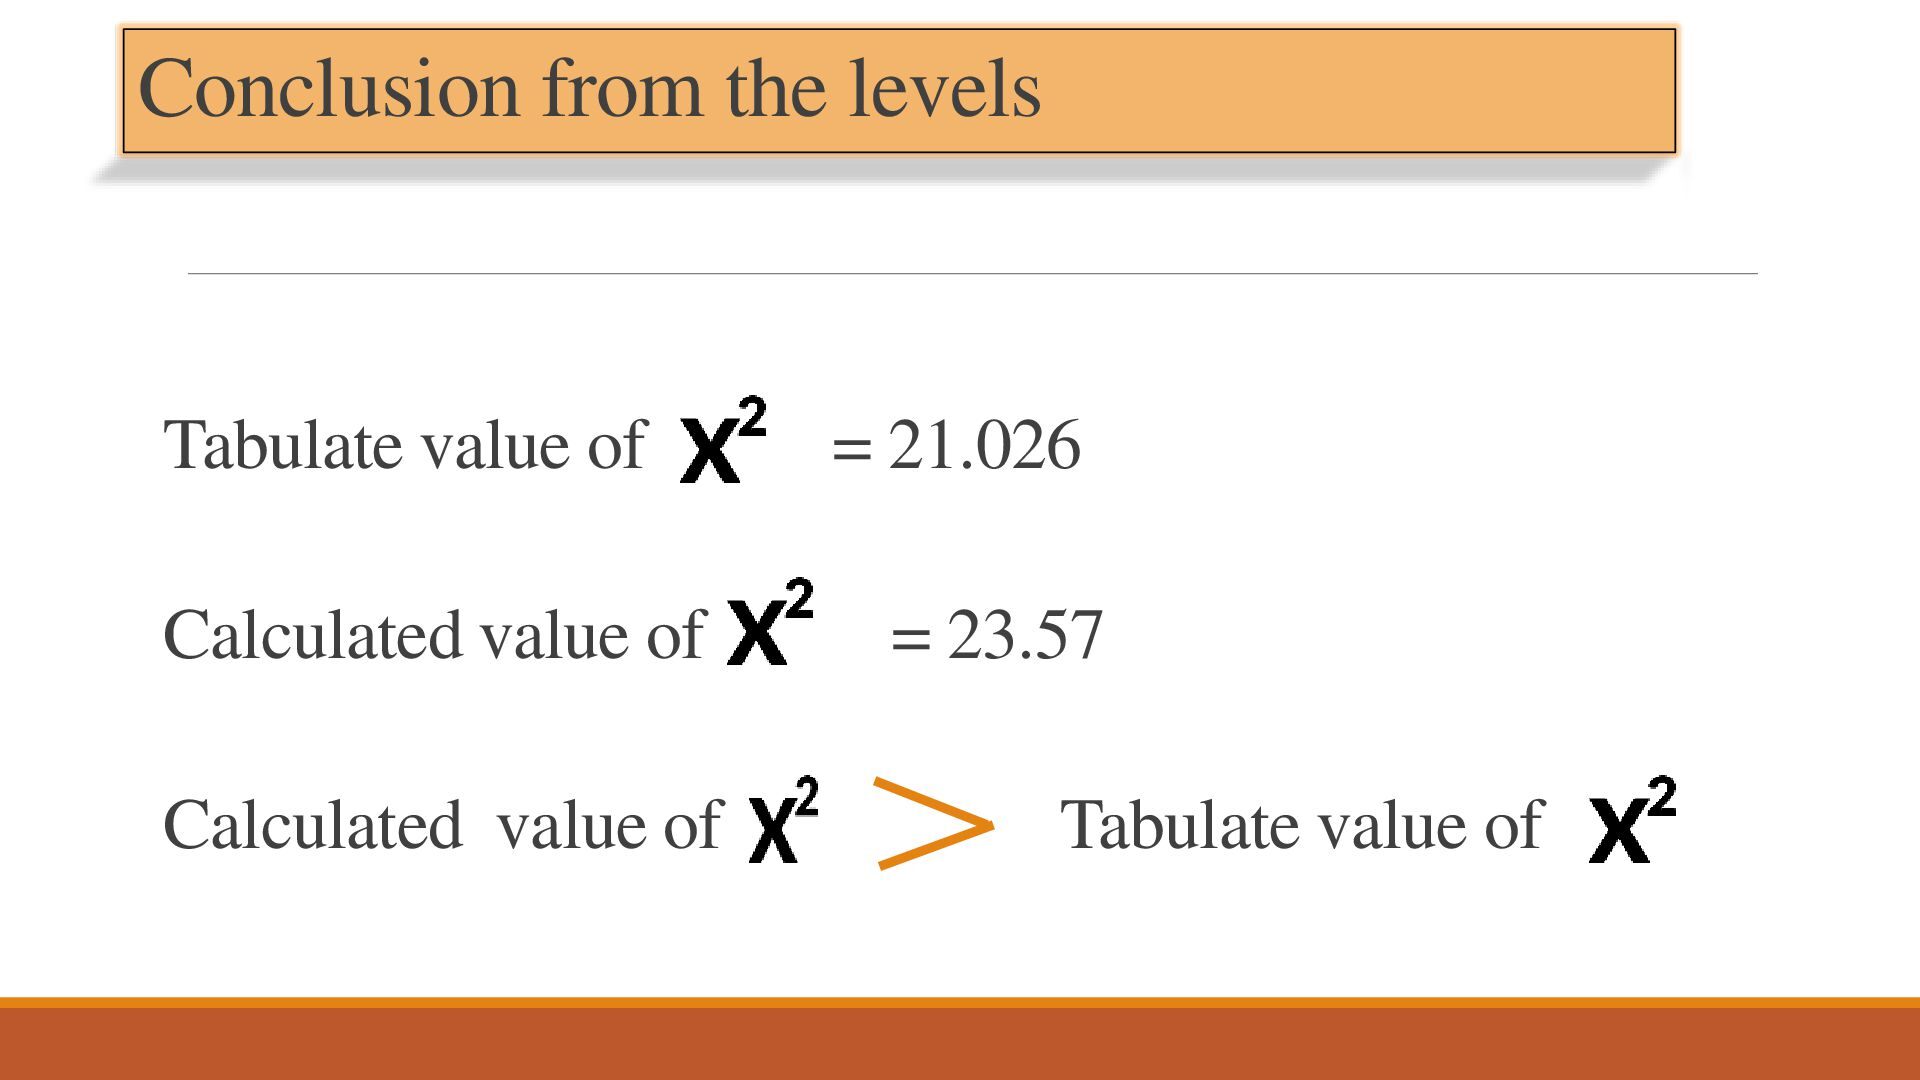
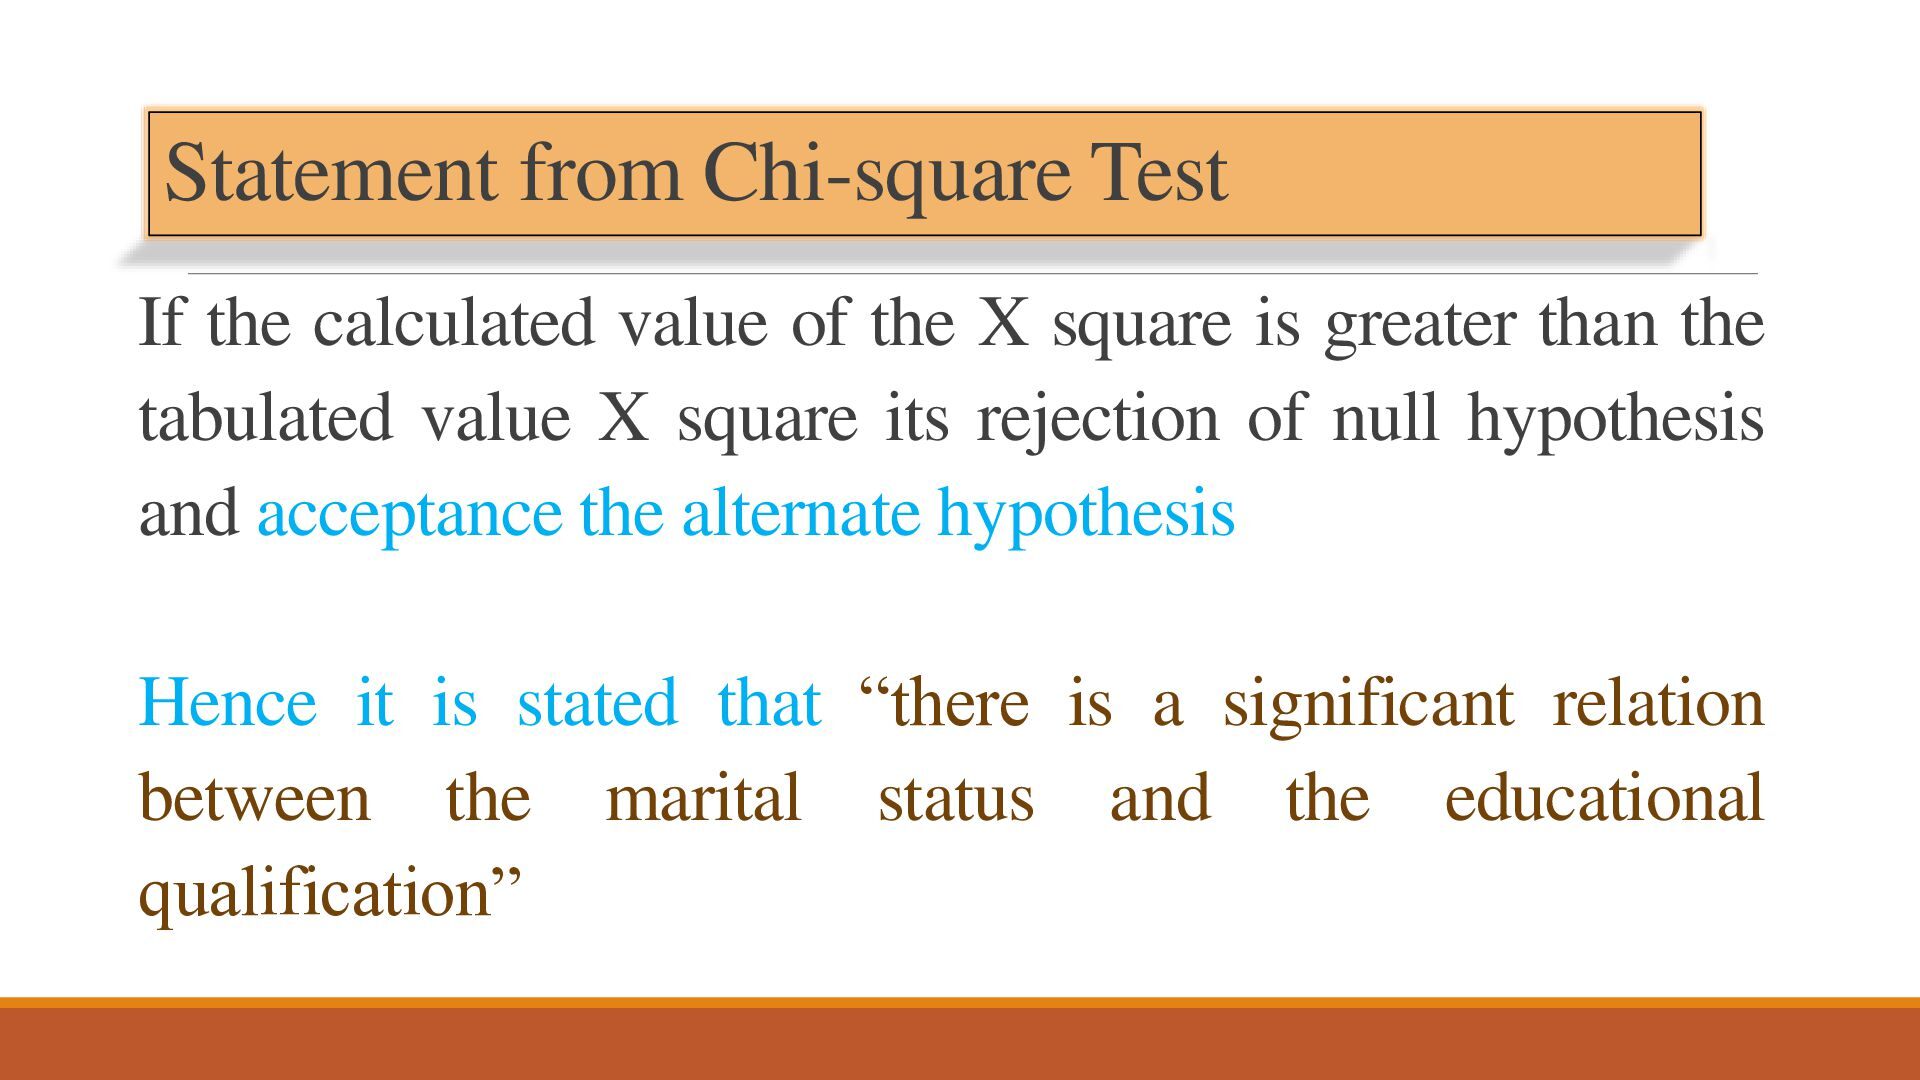
X square is greater than the tabulated value X square its rejection of null hypothesis and acceptance the alternate hypothesis Hence it is stated that “there is a significant relation between the marital status and the educational qualification”
Pandit Palande Y.C.M.O.U. 3) Kothari, C.R. (2019) Research Methodology: Methods and Techniques. 4th Edition, New Age International Publishers, New Delhi.


 manepooja001
 greggifford
 palkan
 mkilby
 tamaranovitovic
 tmiket
 jacobtomlinson
 livdayseo
 smashingmag
 honzajavorek
 rkaga
 holman
 aleyda