Upgrade to Pro — share decks privately, control downloads, hide ads and more …

Pseudobulk Analysis using pseudoBulkDGE()

Avatar for Manisha Barse Manisha Barse
May 02, 2025
23

Pseudobulk Analysis using pseudoBulkDGE()

LIBD Rstats Club: pseudobulk analysis using pseudoBulkDGE()
Presented By : Manisha Barse
Date: May 02, 2025
Recording link to our rstats club presentation: https://youtu.be/0OkWBLyLrfg

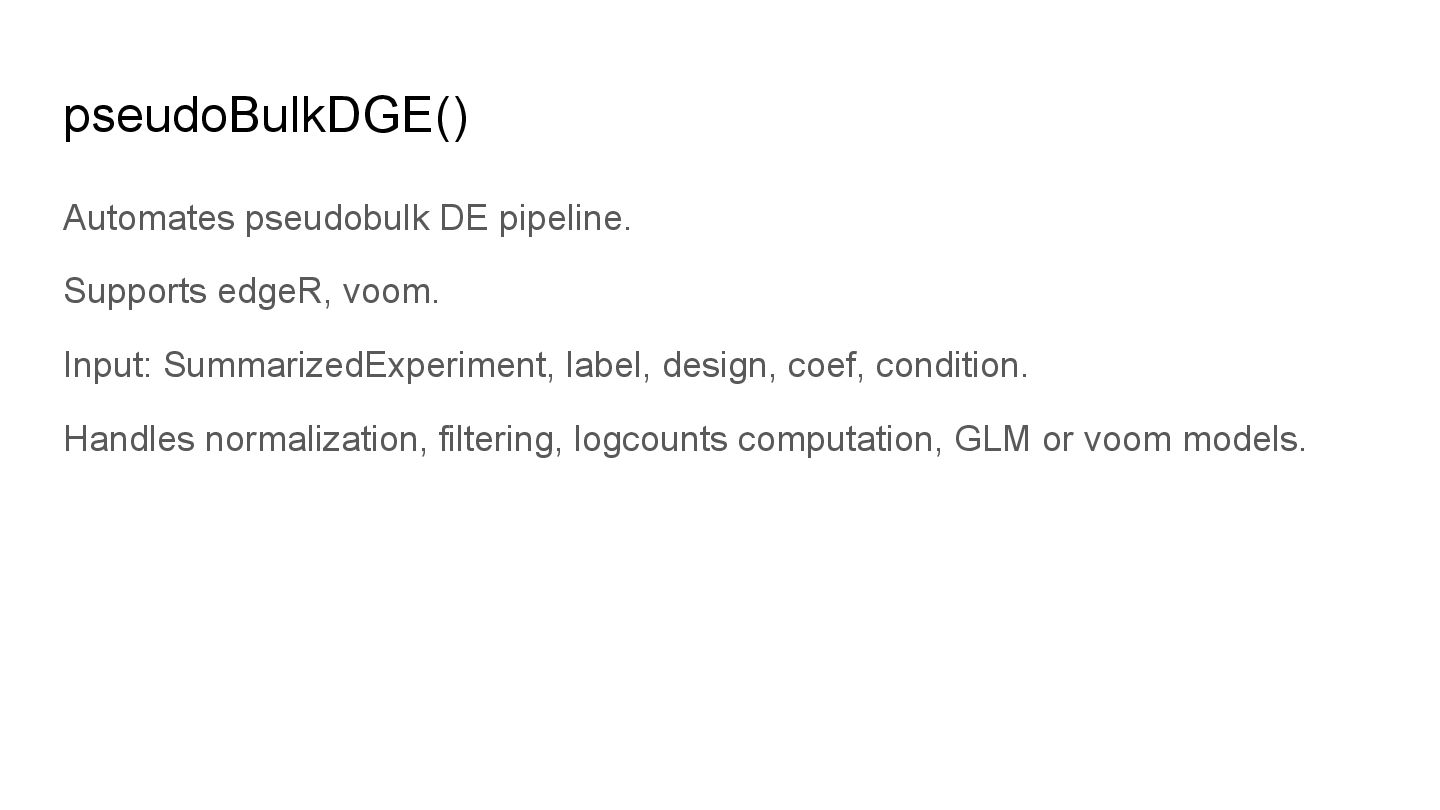
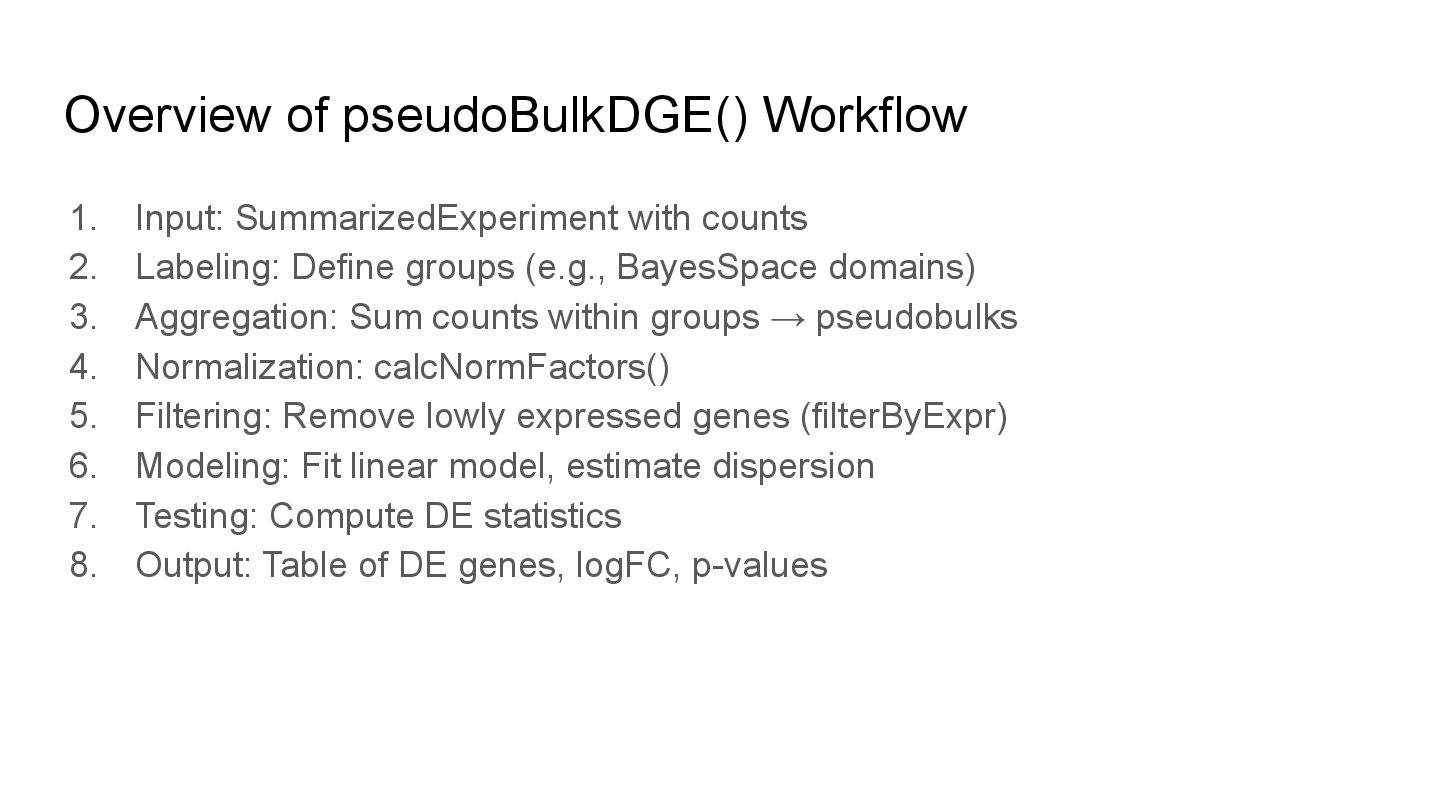
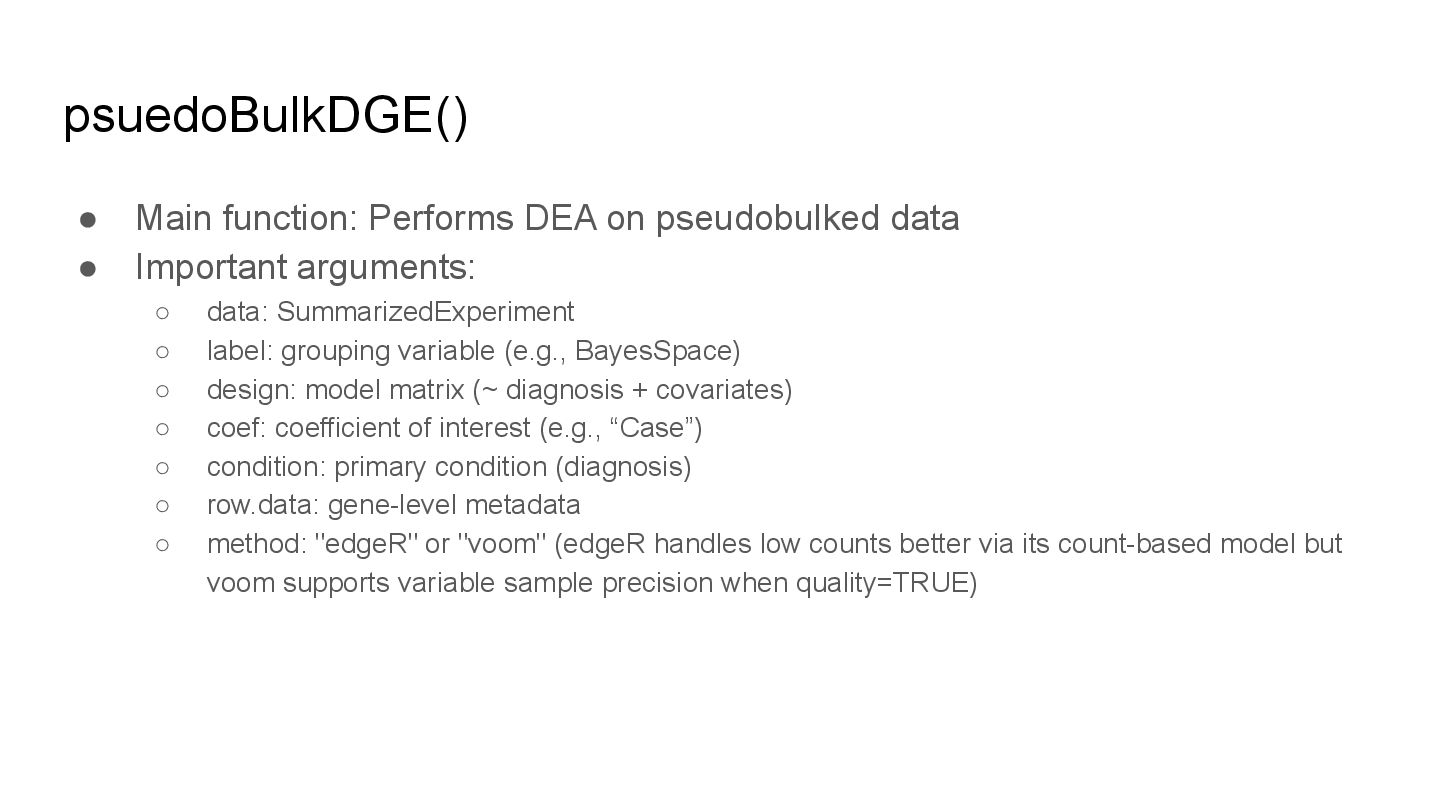
pseudoBulkDGE(): A handy wrapper for DE analysis following OSCA guidelines
#RStats #transcriptomics

Avatar for Manisha Barse

Manisha Barse

May 02, 2025
Tweet

Transcript

  1. Objectives Understand what pseudobulk analysis is and why it’s used

    Learn the steps of pseudoBulkDGE() following OSCA guidelines Compare registration_pseudobulk() vs aggregateAcrossCells() + pseudoBulkDGE() workflows Understand input parameters, normalization, filtering, and output interpretation
  2. What is Pseudobulk Analysis? Aggregates single-cell or spatial counts into

    group-level profiles Treats groups as “bulk samples” → improves statistical power Suitable for differential expression analysis (DEA) Reduces false positives compared to cell-level models Maynard, K.R., Collado-Torres, L., Weber, L.M. et al. Transcriptome-scale spatial gene expression in the human dorsolateral prefrontal cortex. Nat Neurosci 24, 425–436 (2021).
  3. OSCA Workflow for Pseudobulk Analysis 1. Aggregate counts → pseudobulk

    matrix 2. Normalize counts 3. Filter lowly expressed genes (filterByExpr) 4. Fit models (edgeR, voom) 5. Extract DE results 6. Interpret log-fold changes, p-values, FDR https://bioconductor.org/books/3.18/OSCA.multisample/multi-sample-comparisons.html#multi-sample-comparisons
  4. pseudoBulkDGE() Automates pseudobulk DE pipeline. Supports edgeR, voom. Input: SummarizedExperiment,

    label, design, coef, condition. Handles normalization, filtering, logcounts computation, GLM or voom models.
  5. Overview of pseudoBulkDGE() Workflow 1. Input: SummarizedExperiment with counts 2.

    Labeling: Define groups (e.g., BayesSpace domains) 3. Aggregation: Sum counts within groups → pseudobulks 4. Normalization: calcNormFactors() 5. Filtering: Remove lowly expressed genes (filterByExpr) 6. Modeling: Fit linear model, estimate dispersion 7. Testing: Compute DE statistics 8. Output: Table of DE genes, logFC, p-values
  6. Comparison to existing method • registration_pseudobulk() applies edgeR::filterByExpr() across all

    spots- might remove genes with overall low expression which by might be expressed in specific spatial domains. • So, for situations with limited samples size or domain-wise expression is important: pseudobulk samples using aggregateAcrossCells() and then use pseudobulkDGE().
  7. psuedoBulkDGE() • Main function: Performs DEA on pseudobulked data •

    Important arguments: ◦ data: SummarizedExperiment ◦ label: grouping variable (e.g., BayesSpace) ◦ design: model matrix (~ diagnosis + covariates) ◦ coef: coefficient of interest (e.g., “Case”) ◦ condition: primary condition (diagnosis) ◦ row.data: gene-level metadata ◦ method: "edgeR" or "voom" (edgeR handles low counts better via its count-based model but voom supports variable sample precision when quality=TRUE)