Upgrade to Pro — share decks privately, control downloads, hide ads and more …

Kibana Workshop

Kibana Workshop

Slides from the Kibana workshop carried out @CMP Group

Avatar for Marc Lopez Rubio

Marc Lopez Rubio

November 09, 2015

Other Decks in Technology

Transcript

  1. Hello! I am Marc Lopez I am currently working as

    a DevOps in CMP Group You can find me on Twitter at @marclop__
  2. NoSQL Database ◇ Built on Apache Lucene ◇ (full text)

    Search engine ◇ Distributed & HA ◇ Built-in analytics engine ◇ Near Real-time Data ◇ RESTful API
  3. Elasticsearch role ◇ Persistent Datastore ◇ Analytics engine performed on

    the “DB” side ◇ Scale-out capabilities Modern up-to date piece of software that gives us the ability to start becoming more data-centric and analytic about our applications
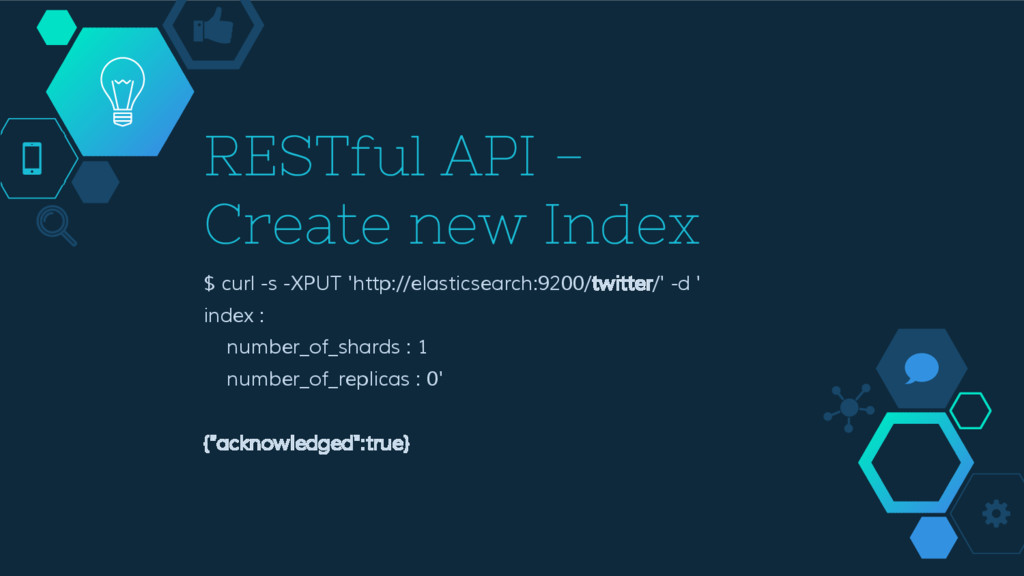
  4. $ curl -s -XPUT 'http://elasticsearch:9200/twitter/' -d ' index : number_of_shards

    : 1 number_of_replicas : 0' {"acknowledged":true} RESTful API - Create new Index
  5. $ curl -s -XPUT 'http://elasticsearch:9200/twitter/' -d ' { “index” :

    { “number_of_shards” : 1, “number_of_replicas” : 0 } }' {"acknowledged":true} RESTful API - Also in JSON
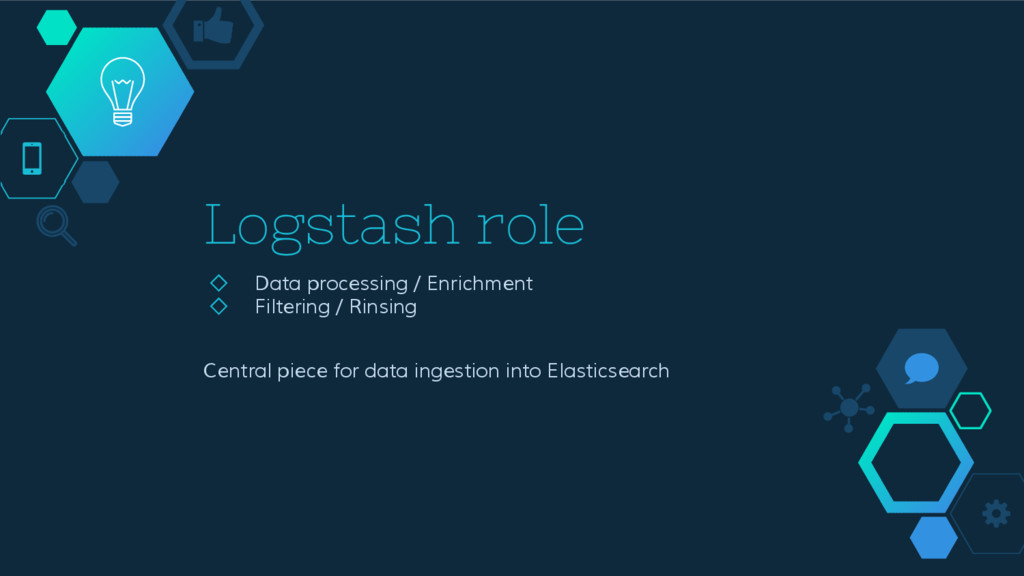
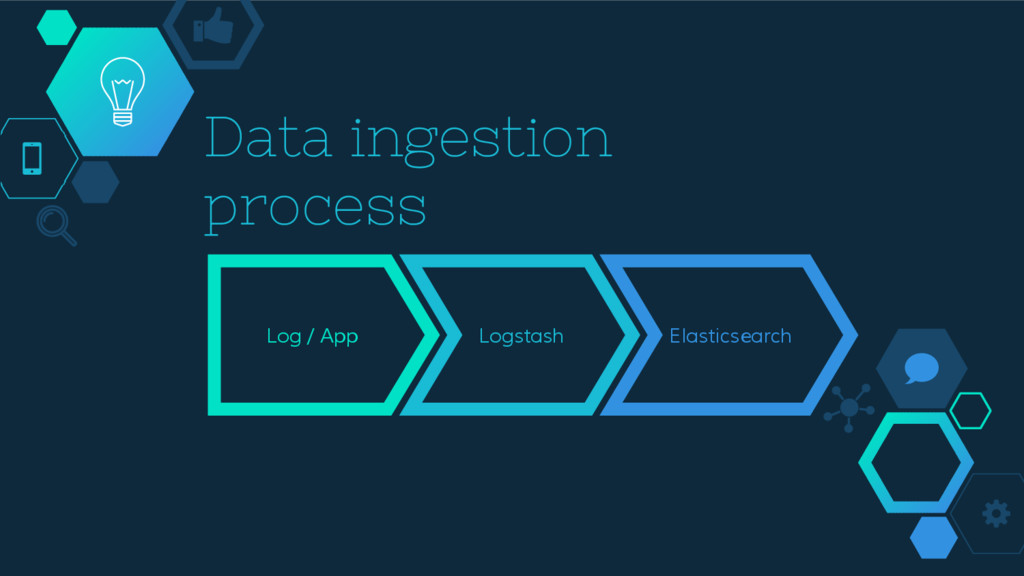
  6. Logstash role ◇ Data processing / Enrichment ◇ Filtering /

    Rinsing Central piece for data ingestion into Elasticsearch
  7. Kibana role ◇ Data discovery ◇ Graphs ◇ Dashboards Central

    Web UI to discover and graph your available date in an Interactive way, no need to dig into Query or Filter APIs
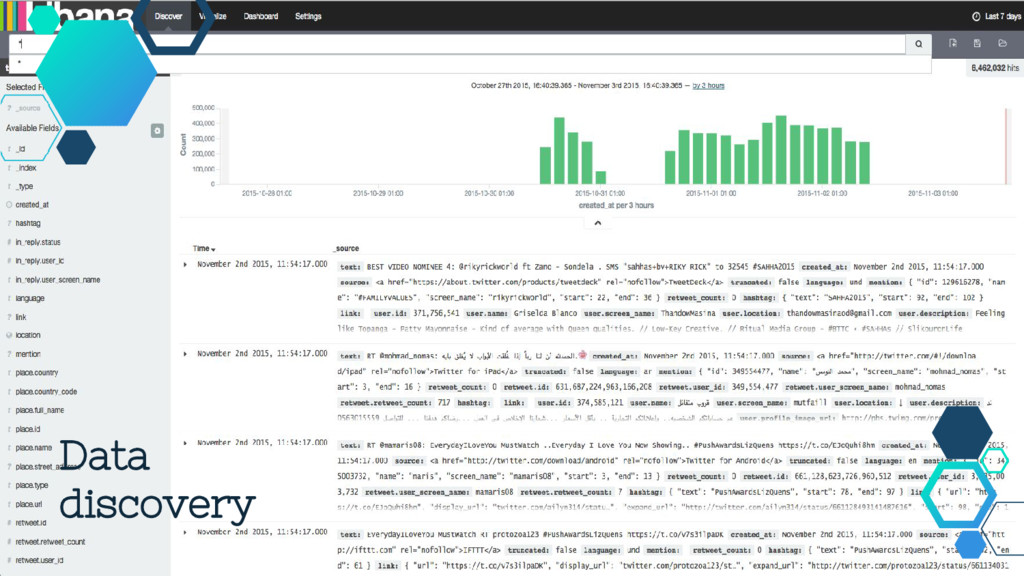
  8. Key points ◇ Raw data visualization ◇ Data filtering (Uses

    Query filters +Performance) ◇ Full text search (-Performance) ◇ Save searches for future use (Ej. Visualizations) TIP: Use query filters when possible instead of full text searches
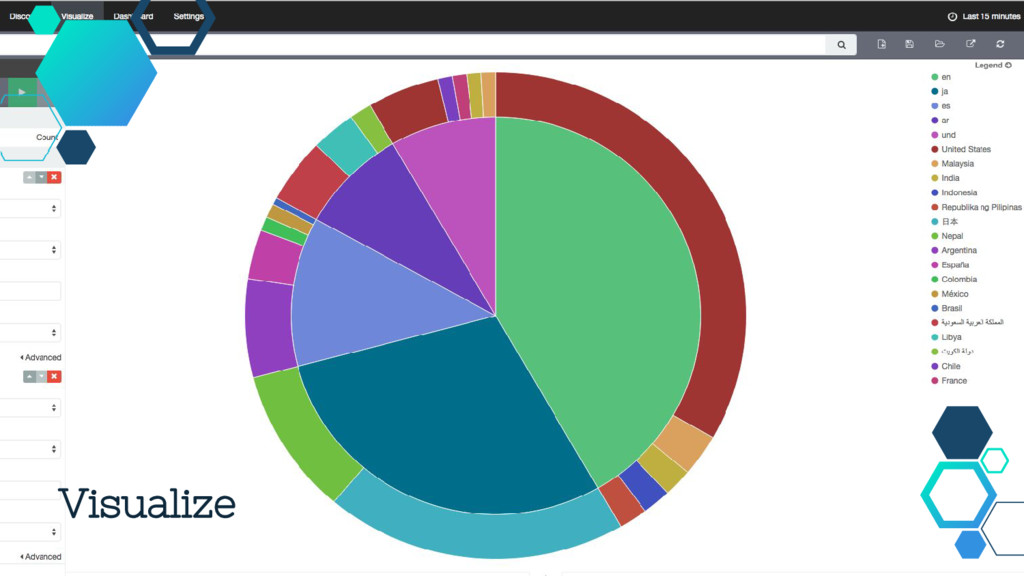
  9. Key points ◇ Build nice Graphs / Pies / Charts

    with known data ◇ Re-use saved searches ◇ Save Visualizations for later use (Ej. Dashboards) ◇ Always use fields not analyzed! (----Performance) TIP: Be careful when saving searches to not filter out data that would otherwise be helpful
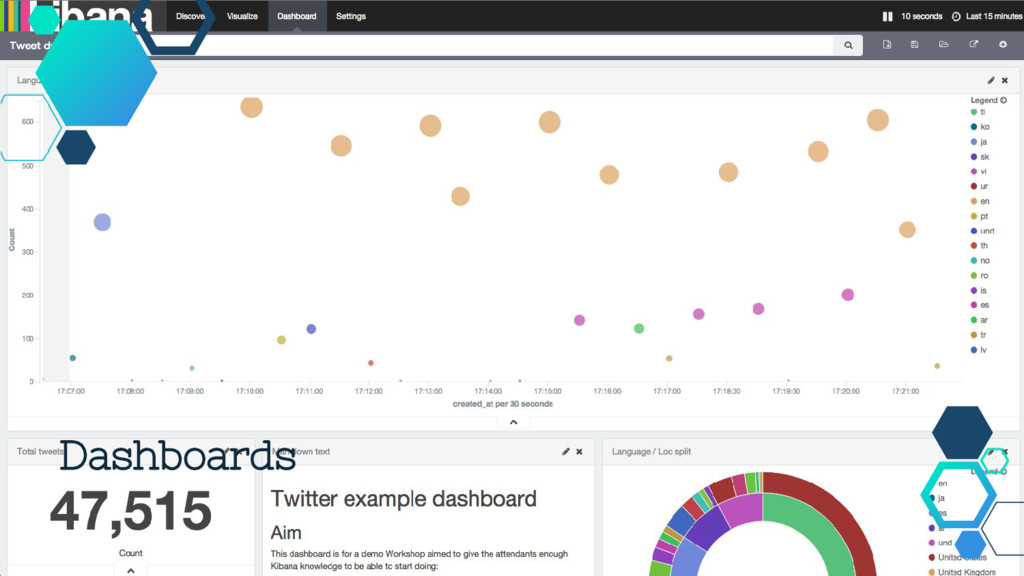
  10. Key points ◇ Build awesome dashboards using saved Visualizations TIP:

    Be careful of the time-range you’ve specified in Kibana as it might be very heavy on the Elasticsearch indices
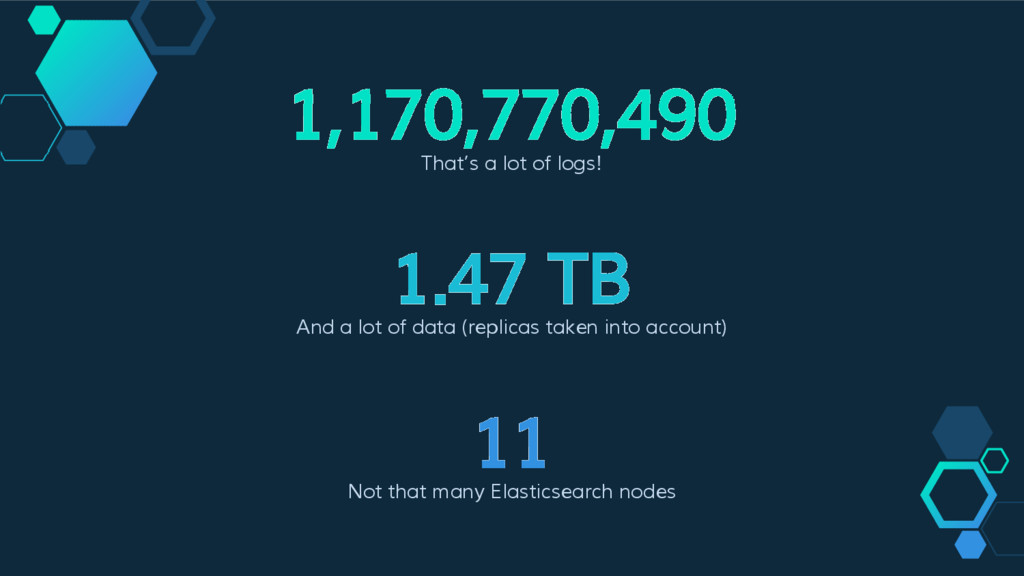
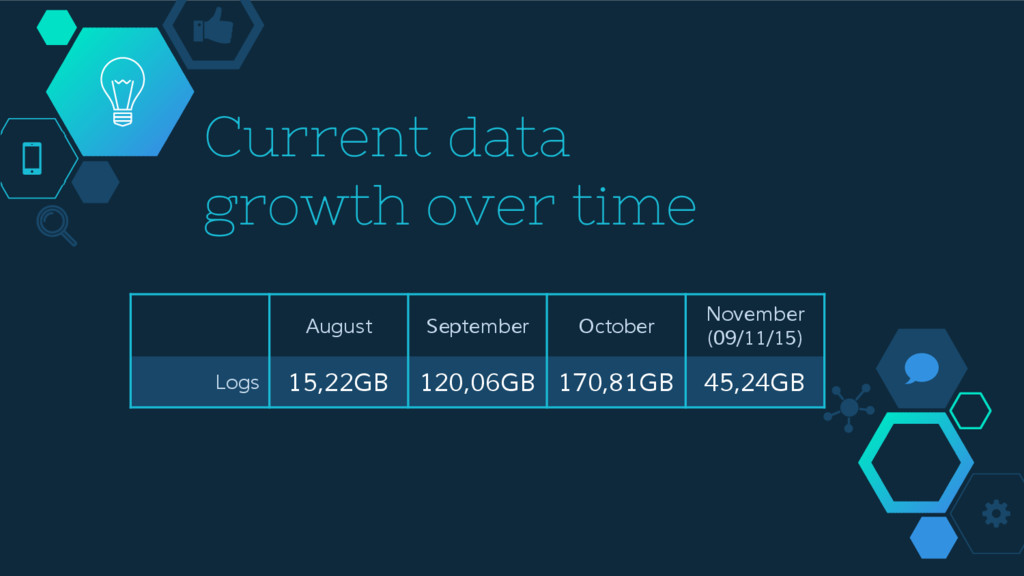
  11. 1,170,770,490 That’s a lot of logs! 11 Not that many

    Elasticsearch nodes 1.47 TB And a lot of data (replicas taken into account)