Upgrade to Pro — share decks privately, control downloads, hide ads and more …

Bridging the gap between your data platform and Power BI

Marketing OGZ
September 19, 2022
140

Bridging the gap between your data platform and Power BI

Marketing OGZ

September 19, 2022
Tweet

Transcript

  1. Bridging the gap between your data platform and Power BI

    bridge crossing big gap landscape view sunset drawing black white, https://replicate.com/stability-ai/stable-diffusion Niels Zeilemaker & Jovan Gligorevic
  2. How it all started Using open-source tooling to offload big/complex

    data operations from your traditional data warehouse to enable new and innovate use-cases.
  3. The 2nd generation of tools Easier to maintain, allowing more

    users to use the platform. Jupyterhub as an interface for DataScientists to interact with the platform.
  4. Enter the cloud Early Hadoop offerings such as HDInsight and

    EMR substantially reduced the effort required to build/deploy an Hadoop platform. Deploying a cluster now only took ~1.5 hours, and not 5 days as it typically took before. Gateway Node HDInsight Cluster
  5. Adding more capabilities The next generation of tooling arrived, making

    it easier/less error prone run jobs on these platforms. Also, their capabilities started to align with those of traditional data warehouses, and hence started to be an alternative Synapse, BigQuery, Snowflake can be used as a drop in replacement for most data warehouses. Data Lake V2 Databricks Data Lake Data Lake Gen2 Data Science ML Workspace Datasets Experiments Pipelines Models Notebook VMs Databricks Raw Reporting Prepared Data Lake Gen2 Synapse Analytics Data Mart Landing Zone Blob Storage Data Factory Scheduling
  6. The monolith arrived A single platform to rule them all,

    being able to ingest streaming and batch sources, dedicated data science environments, and data marts to support the business Data Lake V2 Databricks Staging Cleaned Aligned Blob Storage Landing Zone Data Lake Data Lake Gen2 Databricks Raw Databricks Prepared Data Lake Gen2 Data Mart Event Hub Capture Event Hub Data Science ML Workspace Datasets Experiments Pipelines Models Notebook VMs Business Events Raw Events Integration Shared Compute Databricks Reporting Reporting API Kubernetes Service Application Gateway Cosmos DB Synapse Analytics Data Factory Scheduling
  7. The monolith arrived A single platform to rule them all,

    being able to ingest streaming and batch sources, dedicated data science environments, and data marts to support the business Data Lake V2 Databricks Staging Cleaned Aligned Blob Storage Landing Zone Data Lake Data Lake Gen2 Databricks Raw Databricks Prepared Data Lake Gen2 Data Mart Event Hub Capture Event Hub Data Science ML Workspace Datasets Experiments Pipelines Models Notebook VMs Business Events Raw Events Integration Shared Compute Databricks Reporting Reporting API Kubernetes Service Application Gateway Cosmos DB Synapse Analytics Data Factory Scheduling
  8. A look at the modern data stack A set of

    tools which together provide a much more flexible solution to data for your organization 8
  9. • Data Build Tool (dbt) is an SQL-based ELT-tool, which

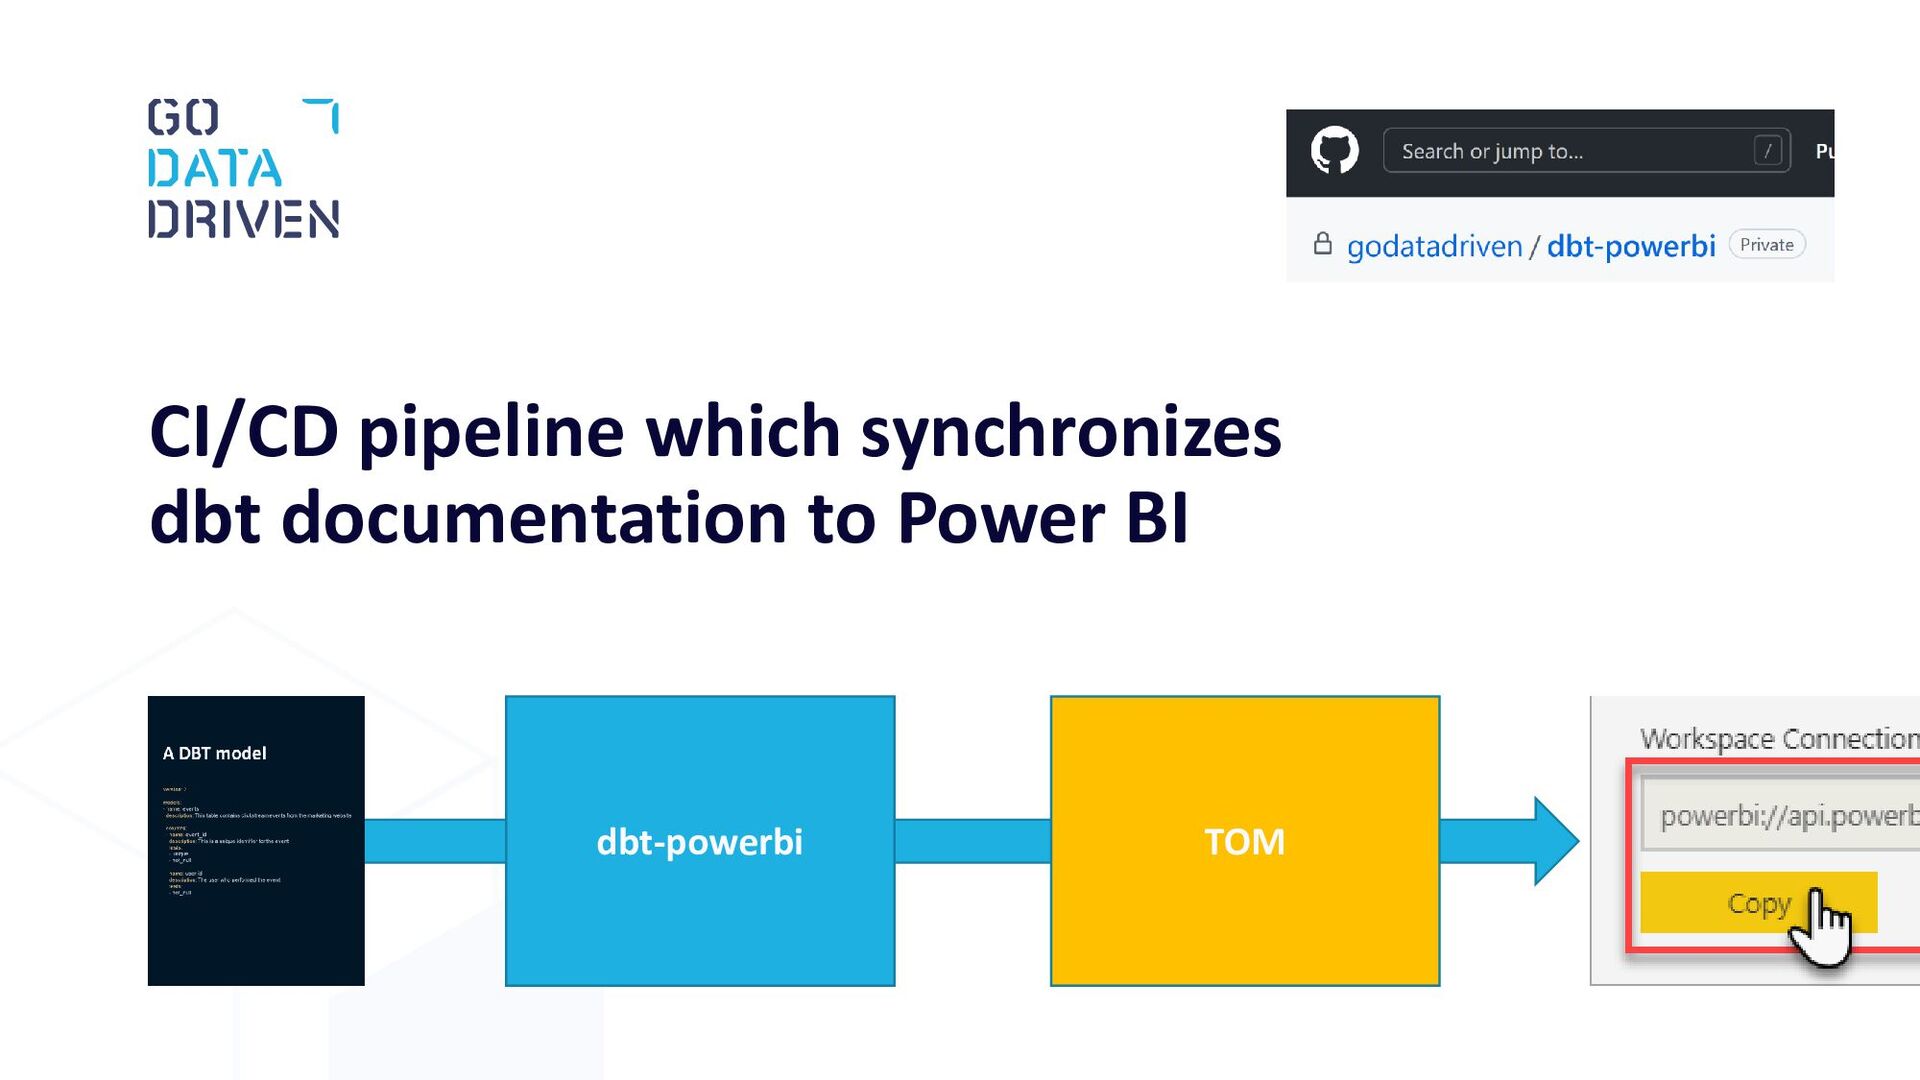
    allows you to build data transformation pipelines • Being SQL-based, it allow much more people to contribute to the ETL pipelines compared to PySpark • It follows software engineering best practices like version-control, modularity, portability, CI/CD • dbt comes with built-in documentation support, keeping code and documentation in the same place 9 people getting new job black white drawing blue hue , https://replicate.com/stability-ai/stable-diffusion
  10. But what about reporting? Data Lake V2 Databricks Staging Cleaned

    Aligned Blob Storage Landing Zone Data Lake Data Lake Gen2 Databricks Raw Databricks Prepared Data Lake Gen2 Data Mart Event Hub Capture Event Hub Data Science ML Workspace Datasets Experiments Pipelines Models Notebook VMs Business Events Raw Events Integration Shared Compute Databricks Reporting Reporting API Kubernetes Service Application Gateway Cosmos DB Synapse Analytics Data Factory Scheduling
  11. Power BI Reporting tool developed by Microsoft. Sometimes free (as

    it is included in Office365), but typically requires either a pro or premium licence. Consists of 2 main components; • Power BI Desktop • Power BI Service
  12. Developer flow A report designer, connects to a datasource, creates

    one or more datasets, uses those to create a report/visualisation, and finally publishes those to the power bi service inside an workspace. Consumers can directly access reports from the service, or through an app which can be a collection of reports. Report Designers Power BI desktop interact publish Consumers create Power BI service Power BI app
  13. Connecting to the Data Platform A workspace within Power Bi

    is typically used by a single team. This teams needs data, hence a connection (datasource) is created to the data platform. Another team, has a slightly different data need, and hence another connection is made. The next team, has the same data requirements, but doesn’t know that the first workspace already has the data. Resulting in yet another connection. Power BI service Workspace Datasets Reports Dashboards Tables Workspace Datasets Reports Dashboards Tables Workspace Datasets Reports Dashboards Tables Prepared Synapse Analytics
  14. We should do better than this By extending the data

    platform to also include a single Power BI workspace, the platform team can be made responsible maintaining and creating the link to the platform. No more duplicate connections, but also a much better user experience in Power BI. Power BI service Workspace Datasets Workspace Datasets Reports Dashboards Tables Workspace Datasets Reports Dashboards Tables Prepared Synapse Analytics
  15. Add descriptions to datasets Dataset and Column descriptions help consumers

    of the data in Power BI to get a better understand of the data they are working with. However, it’s not trivial to document your datasets, as it requires many separate steps in order to do so.
  16. Custom tooling to the rescue The Power BI Model Documenter,

    made by Marc Lelijveld, improves upon this with a dedicated desktop app which allows you to document your models. Which internally is using the XMLA endpoint of a single workspace.
  17. Extending DBT The descriptions of our tables/models are already in

    DBT. Same is true for column descriptions. By extending DBT, we can make sure that this documentation also lands into Power BI. version: 2 models: - name: events description: This table contains clickstream events from the marketing website columns: - name: event_id description: This is a unique identifier for the event tests: - unique - not_null - name: user-id description: The user who performed the event tests: - not_null A DBT model