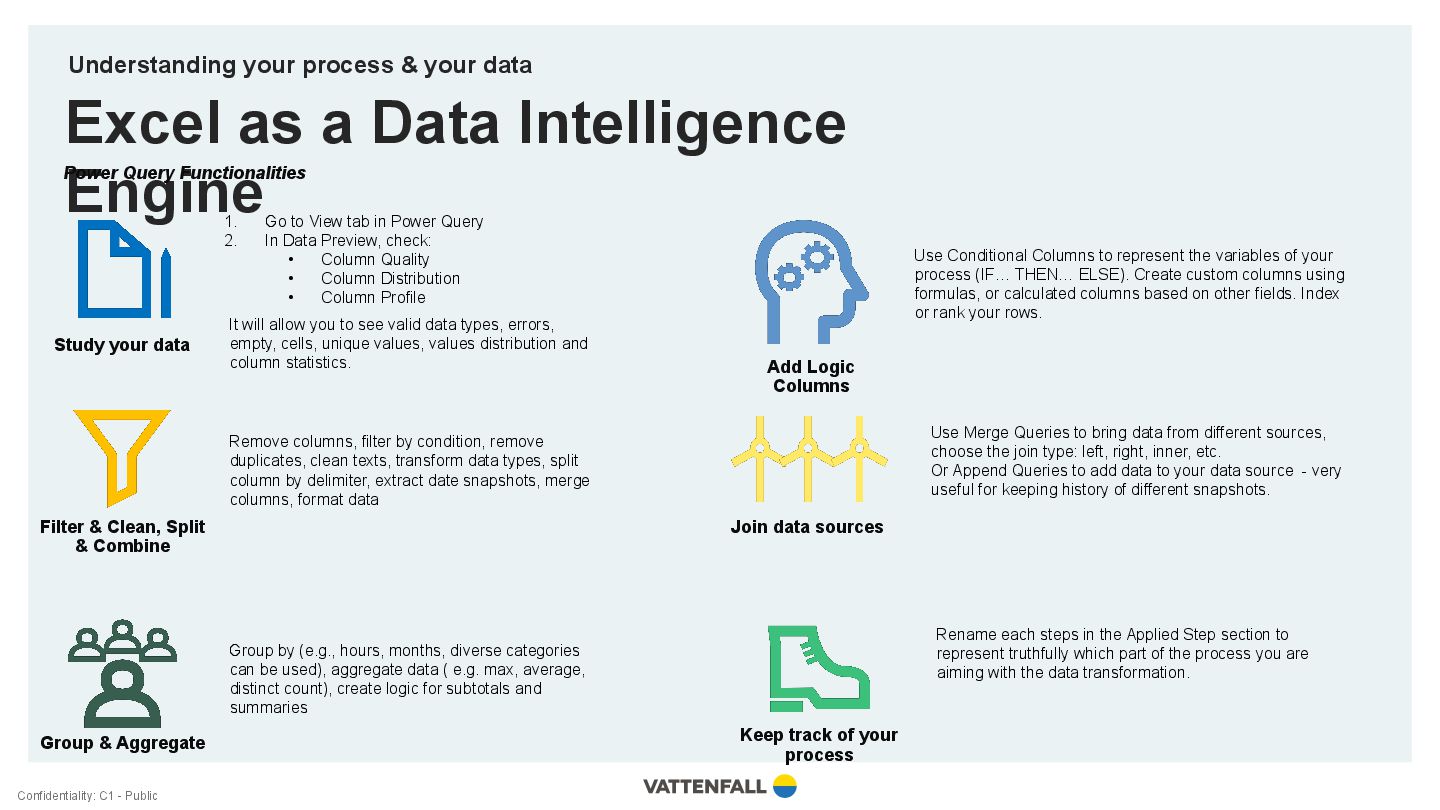
Understanding your process & your data Power Query Functionalities Study your data 1. Go to View tab in Power Query 2. In Data Preview, check: • Column Quality • Column Distribution • Column Profile It will allow you to see valid data types, errors, empty, cells, unique values, values distribution and column statistics. Filter & Clean, Split & Combine Remove columns, filter by condition, remove duplicates, clean texts, transform data types, split column by delimiter, extract date snapshots, merge columns, format data Group & Aggregate Group by (e.g., hours, months, diverse categories can be used), aggregate data ( e.g. max, average, distinct count), create logic for subtotals and summaries Add Logic Columns Use Conditional Columns to represent the variables of your process (IF… THEN… ELSE). Create custom columns using formulas, or calculated columns based on other fields. Index or rank your rows. Join data sources Use Merge Queries to bring data from different sources, choose the join type: left, right, inner, etc. Or Append Queries to add data to your data source - very useful for keeping history of different snapshots. Keep track of your process Rename each steps in the Applied Step section to represent truthfully which part of the process you are aiming with the data transformation.