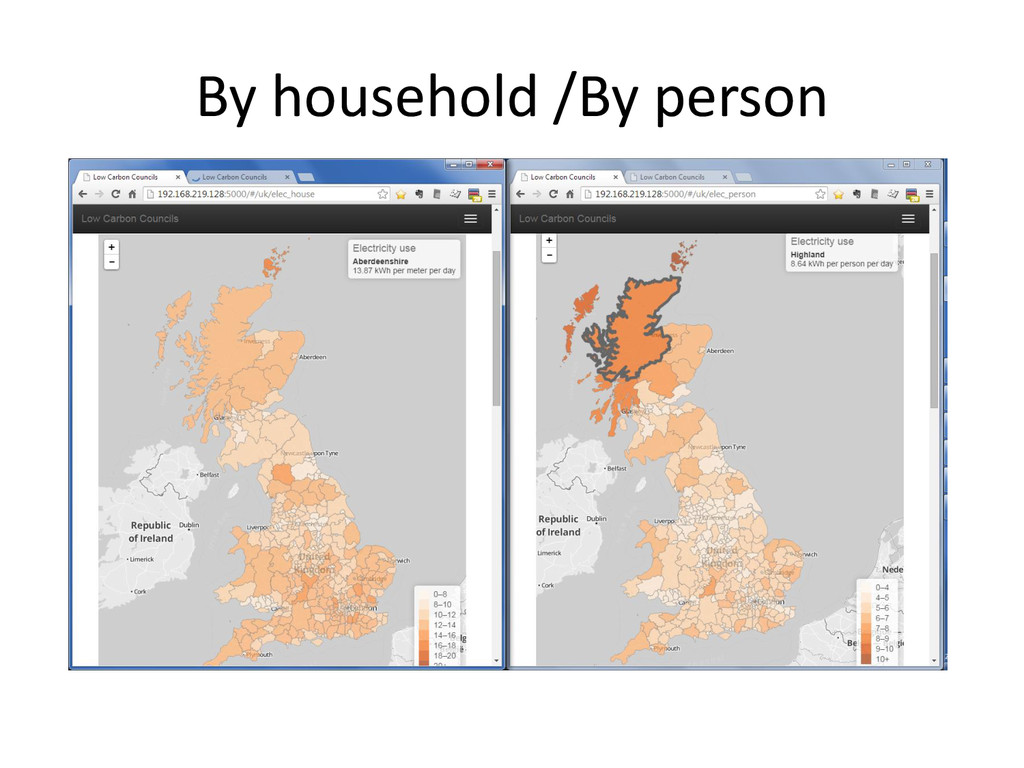
Department of Energy & Climate Change (DECC) – Office for National Statistics (ONS) • But the data isn’t in a very useable form for normal people • Better visibility & visualisation may mean – we can understand more and – help drive changes
renewable energy capacity. – In many cases, local councils have been slow to support this goal. – Councils control the planning process, and own lots of buildings. • We're taking on the Energy Production challenge: – 'Stimulate and support a rapid transition to low- carbon energy'
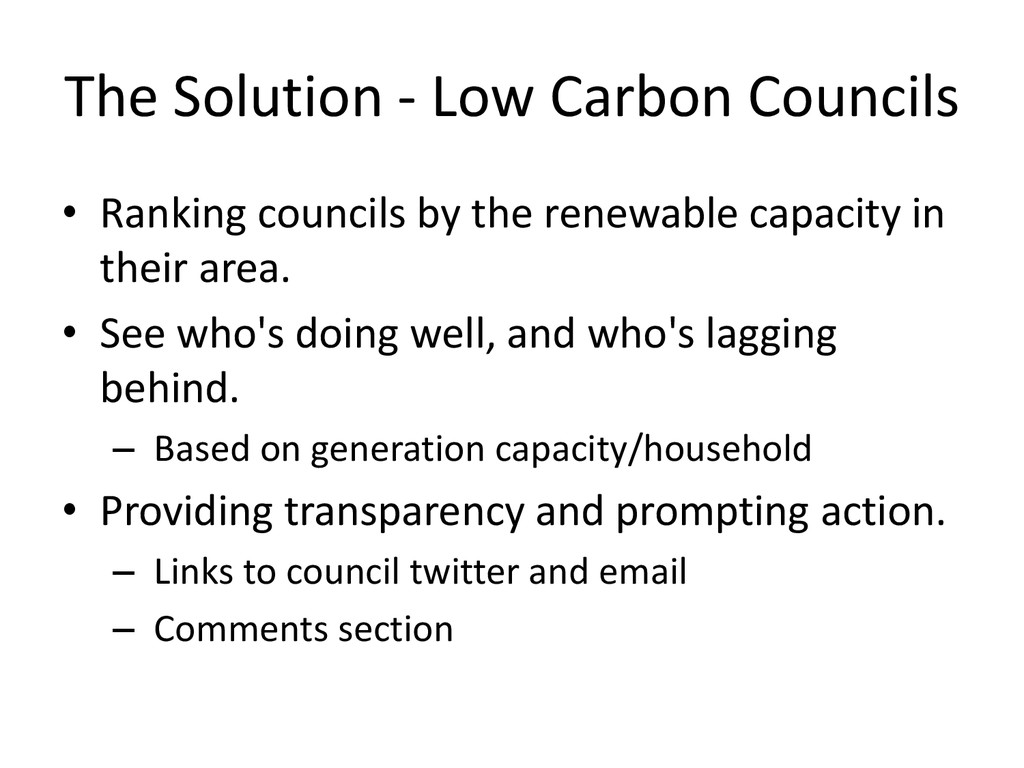
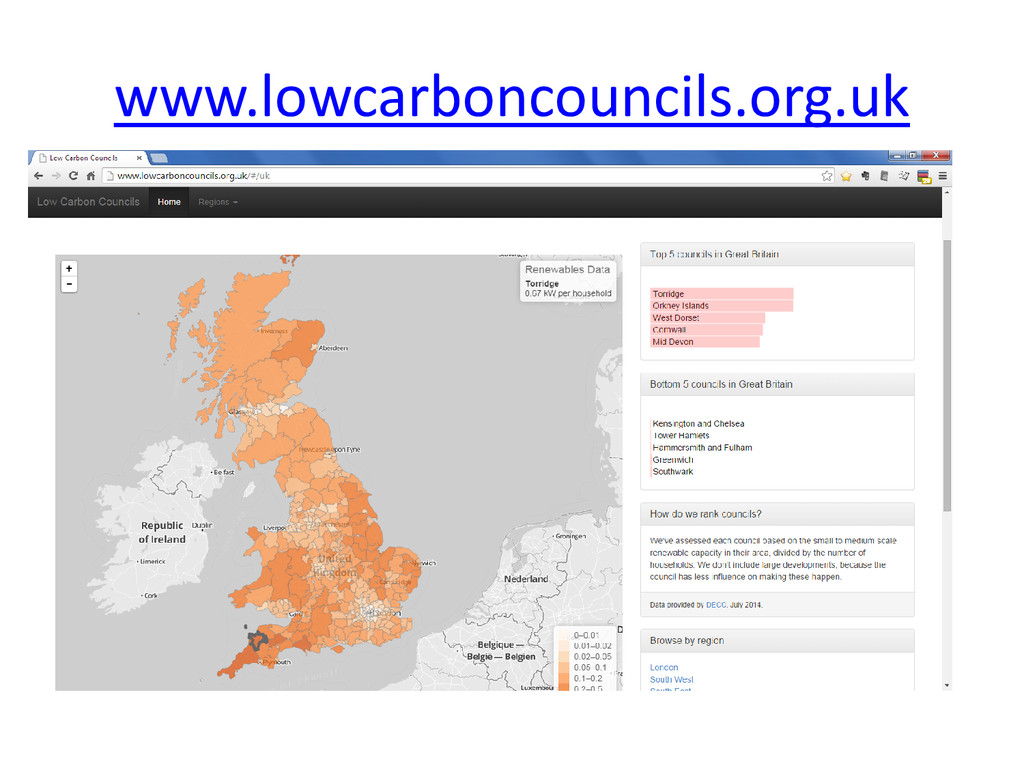
the renewable capacity in their area. • See who's doing well, and who's lagging behind. – Based on generation capacity/household • Providing transparency and prompting action. – Links to council twitter and email – Comments section
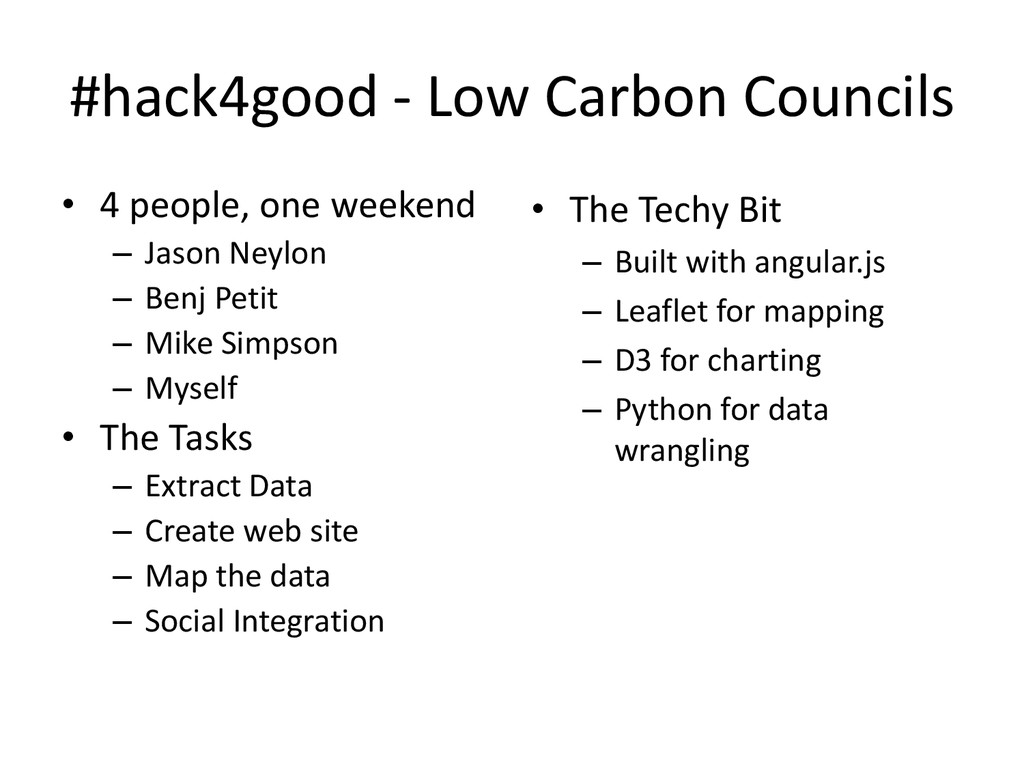
– Jason Neylon – Benj Petit – Mike Simpson – Myself • The Tasks – Extract Data – Create web site – Map the data – Social Integration • The Techy Bit – Built with angular.js – Leaflet for mapping – D3 for charting – Python for data wrangling
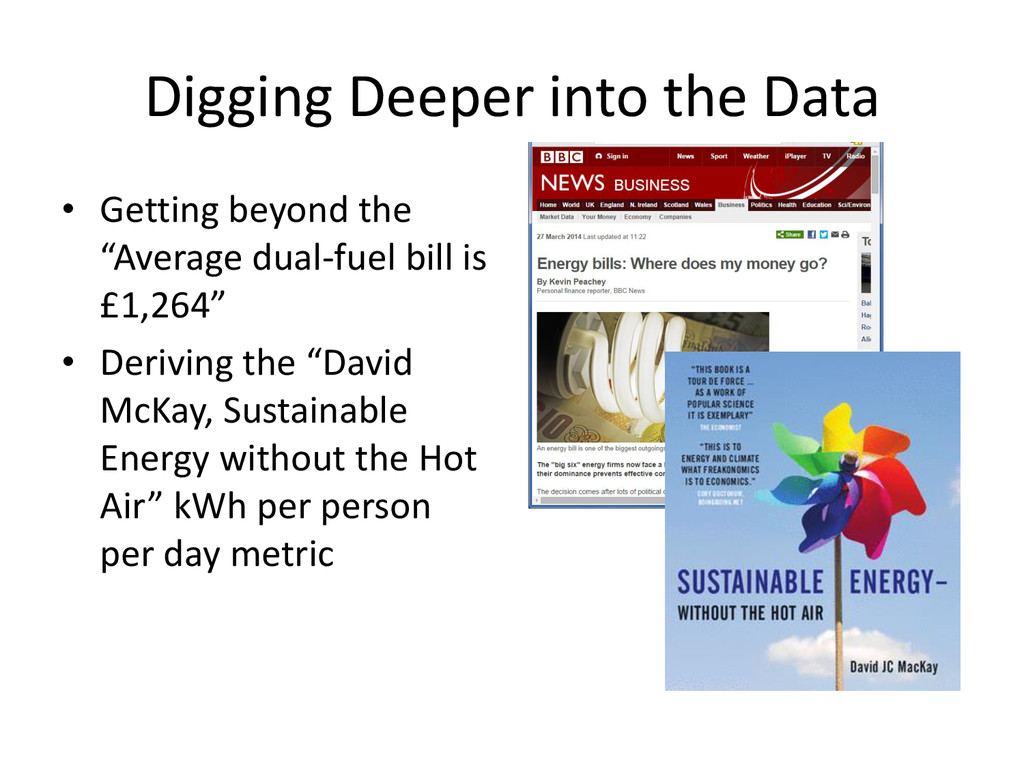
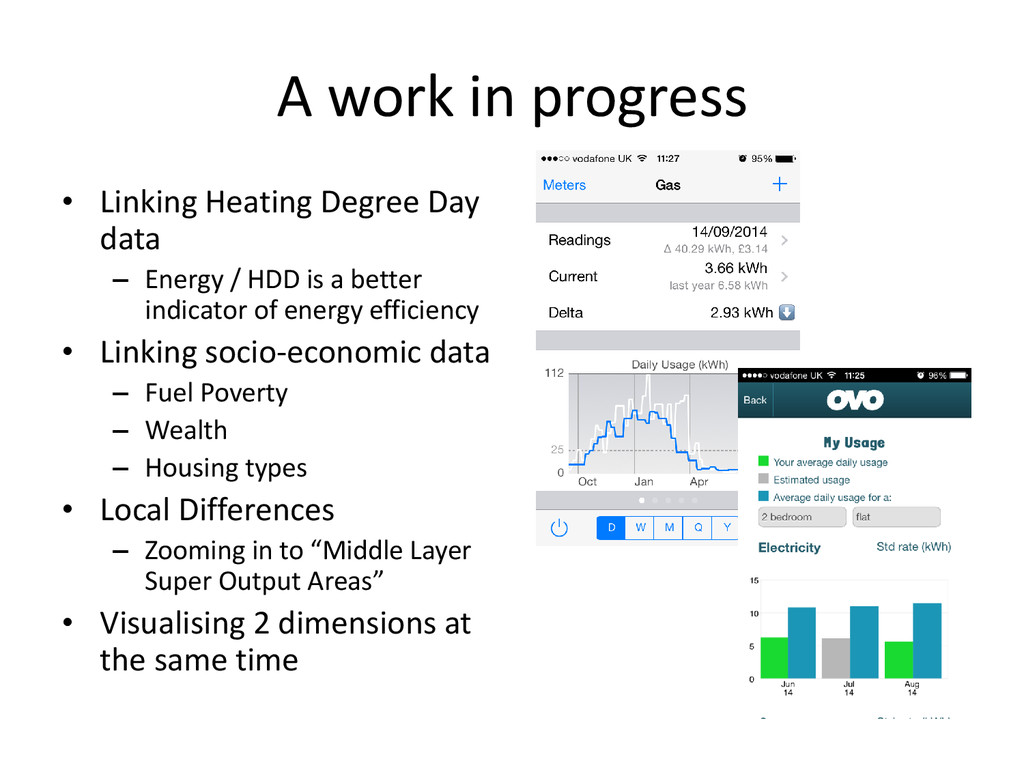
– Energy / HDD is a better indicator of energy efficiency • Linking socio-economic data – Fuel Poverty – Wealth – Housing types • Local Differences – Zooming in to “Middle Layer Super Output Areas” • Visualising 2 dimensions at the same time


 honzajavorek
 erikaheidi
 afnizarnur
 jonoalderson
 tammyeverts
 rkendrick25
 katarinadahlin
 chikuwait
 3n
 cargoodrich
 inesmontani
 wayneb77