Upgrade to Pro — share decks privately, control downloads, hide ads and more …

Rapid Desirability Testing: Analyzing Emotional Response to A Design

Rapid Desirability Testing: Analyzing Emotional Response to A Design

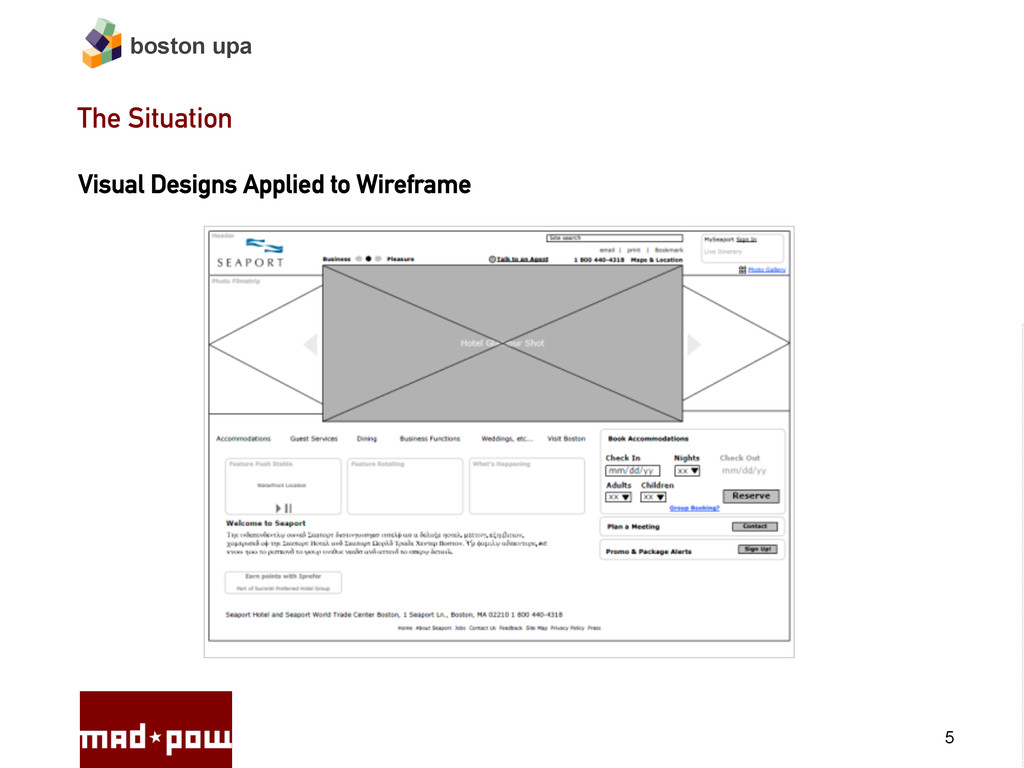
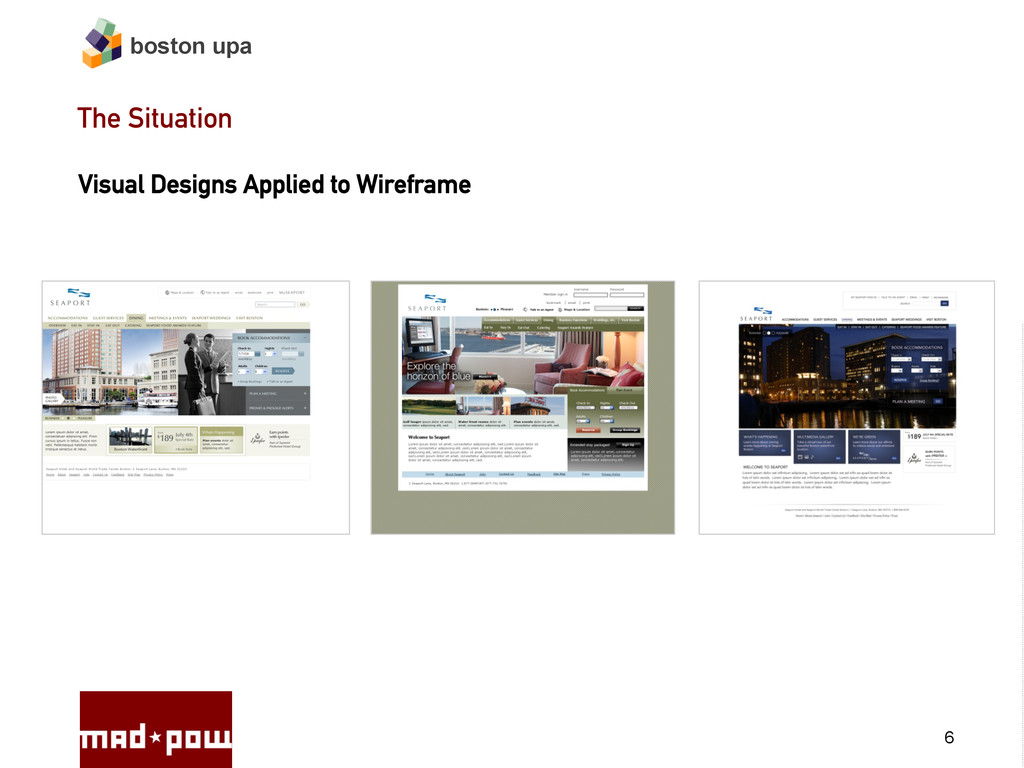
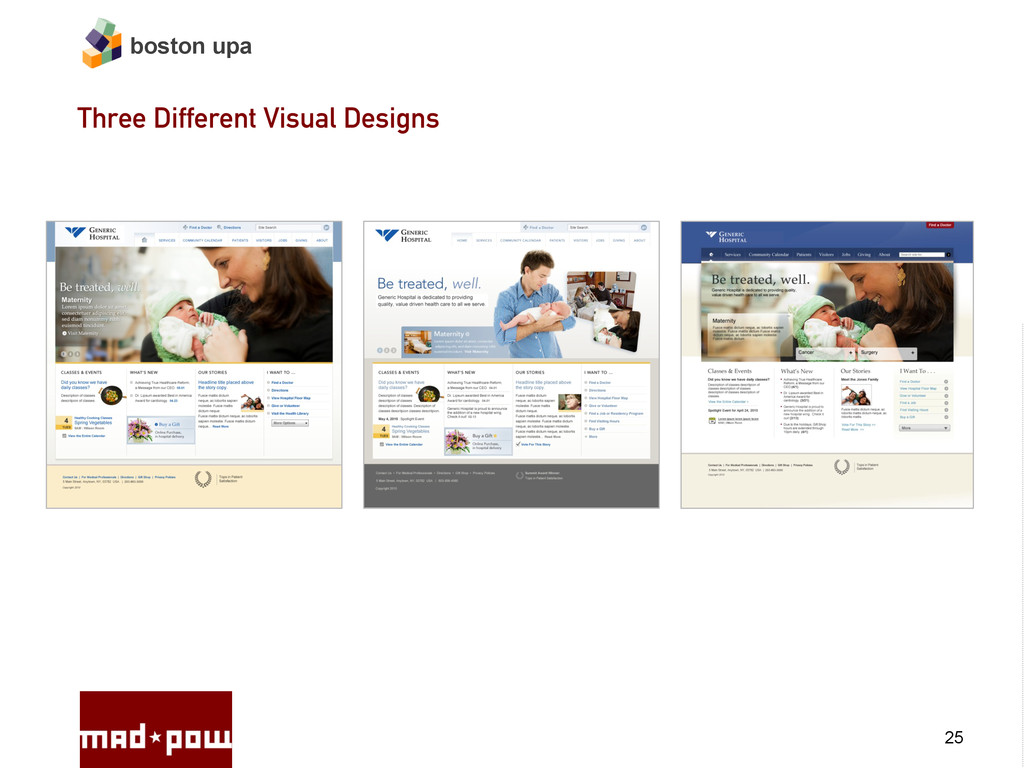
In the design process we follow, once we have defined the conceptual direction and content strategy for a given design and refined our approach through user research and iterative usability testing, we start applying visual design. Generally, we take a key screen whose structure and functionality we have finalized—for example, a layout for a home page or a dashboard page—and explore three alternatives for visual style. These three alternative visual designs, or comps, include the same content, but reflect different choices for color palette and imagery. The idea is to present business owners and stakeholders with different visual design options from which they can choose. Sometimes there is a clear favorite among stakeholders or an option that makes the most sense from a brand perspective. However, there can often be disagreements among the members of a project team on which direction to choose. If we’ve done our job right, there are rationales for our various design decisions in the different comps, but even so, there may be disagreement about which rationale is most appropriate for the situation.
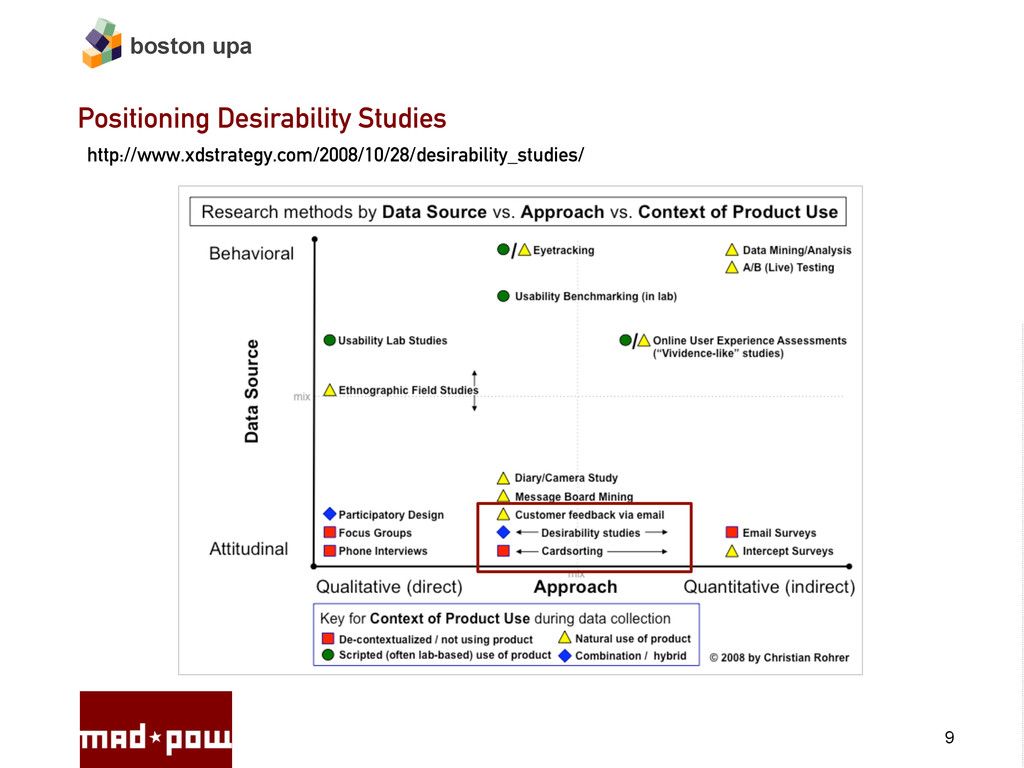
As practitioners of user-centered design, it is natural for us to turn to user research to help inform and guide the process of choosing a visual design. But traditional usability testing and related methods don’t seem particularly well suited for assessing visual design for two reasons:

1. When we reach out to users for feedback on visual design options, stakeholders are generally looking for large sample sizes—larger than are typical for a qualitative usability study.
2. The response we are looking for from users is more emotional—that is, less about users’ ability to accomplish tasks and more about their affective response to a given design.

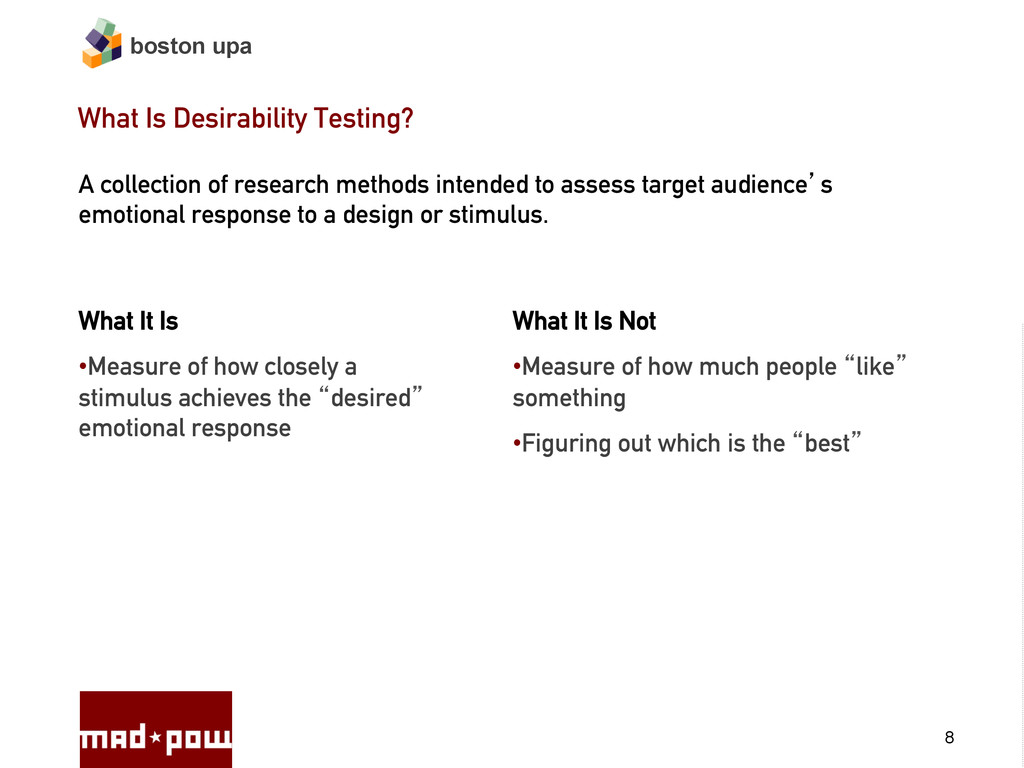
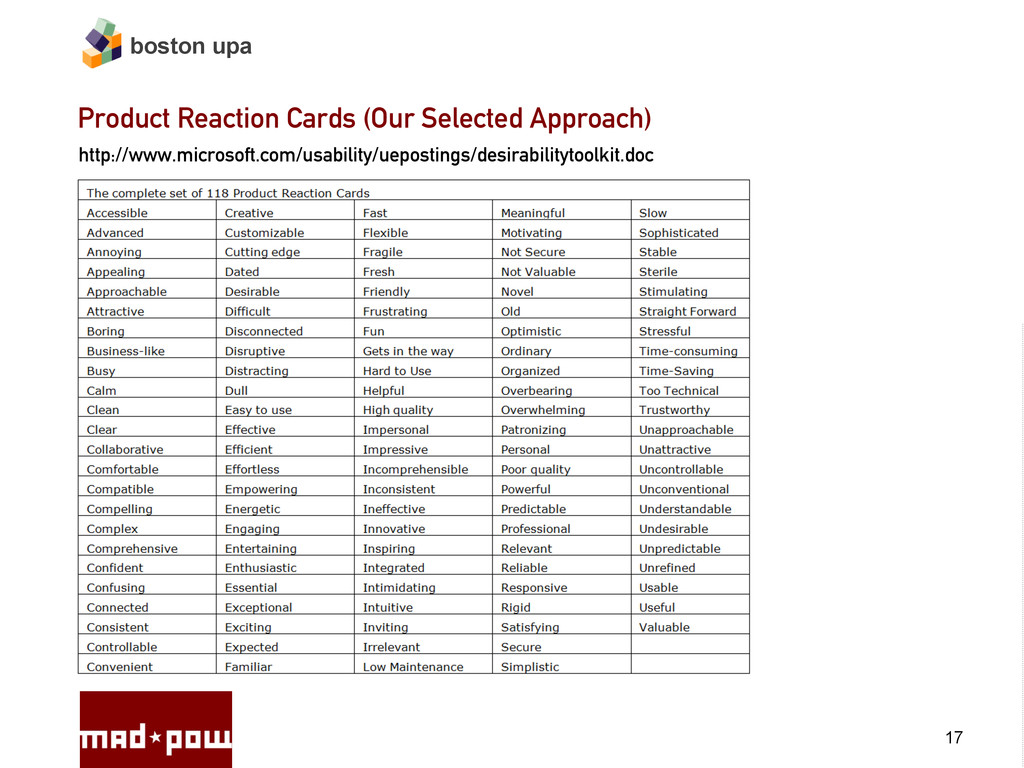
With this in mind, we were very interested in articles we saw on Desirability Testing. In one article, the author posits desirability testing as a mix of quantitative and qualitative methods that allow you to assess users’ attitudes toward aesthetics and visual appeal. Inspired by his overview, we researched desirability studies a bit further and tried a modified version of the techniques on one of our projects. This presentation reviews the variants of desirability testing that we considered and the lessons we learned from a desirability study on visual design options for one of our projects. Interestingly, we found that while desirability testing did help us better understand participant’s self reported emotional response to a visual design, it also helped us identify other key areas of the experience that could be improved.

Megan Grocki

June 09, 2010
Tweet

More Decks by Megan Grocki

Other Decks in Design

Transcript

  1. Prepared by: Michael Hawley – VP Experience Design Megan Grocki

    – Senior Experience Designer June 9, 2009 Rapid Desirability Testing ANALYZING EMOTIONAL RESPONSE TO A DESIGN (ON A BUDGET) boston upa
  2. boston upa Agenda • Introduction • The Situation • Desirability Testing Overview • Methods

    Considered • Our Selected Process • Case Study • Lessons Learned 2
  3. boston upa What Is Desirability Testing? A collection of research

    methods intended to assess target audience`s emotional response to a design or stimulus. 8 What It Is Not • Measure of how much people llikez something • Figuring out which is the lbestz What It Is • Measure of how closely a stimulus achieves the ldesiredz emotional response
  4. boston upa Why Is It Important First impressions of a

    design to impact a product`s or application`s perceived utility, usability, and credibility. 10 Functionality Aesthetics Usability
  5. boston upa Triading Definition Present three different concepts or ideas

    to participants, and ask them to identify how two of them are different from the third and why. 12
  6. boston upa Quantitative Questionnaires Definition Broad, experience-based questionnaires, that also

    include questions relating to visual appeal and aesthetics • SUS (System Usability Scale), • QUIS (Questionnaire for User Interface Satisfaction) • WAMMI (Website Analysis and Measurement Inventory) 13
  7. boston upa Show participants a user interface for a very

    brief moment, then take it away. Participants recall their first impression, then moderator probes for meaning • Helpful for layout decisions, prominence of content, even labels • www.fivesecondtest.com Quick Exposure Memory Tests 14 Attention designers: You have 50 milliseconds to make a good first impression
  8. boston upa Physiological and Neurological Measurements Definition • Sensors track participants`

    physiological measurements to particular designs. Changes in suggest a particular emotional response. • Paired with attitudinal and self-reporting surveys measurements give a multifaceted view of emotional reactions to a design •  Electroencephalography (EEG): Brain activity •  Electromyography (EMG): Muscles and Excitement •  Electrodermal Activity (EDA): Sweat, Excitement •  Blood Volume Pressure (BVP): Arousal •  Pupil Dilation: Arousal and Mental Workload •  Respiration: Negative Valence or Arousal 15
  9. boston upa Before You Begin Determine intended brand attributes (and

    their opposites) 19 1.  Leverage existing marketing/brand materials 2.  Alternatively, stakeholder brainstorm to identify key brand attributes/descriptors using full list of product reaction cards as a start 3.  Tip: lIf the brand was a person, how would it speak to your customers?z
  10. boston upa Process - Conducting Methodology 1.  Include 60/40 split

    of positive and negative words 2.  Target 60 words, optimized to test brand 3.  Simple question: lWhich of the following words do you feel best describe the site/design/product (please select 5):z 4.  One comp per participant, or multiple comps per participant (no more than 3) Participants 1.  Qualitative: Paired with usability testing 2.  Quantitative: Target minimum of 30 per option if possible 20
  11. boston upa Process - Analyzing 1.  Calculate percentage of positive

    and negative attributes per design 2.  Visualize overall sentiment of feedback using lword cloudsz (see wordle.net) 21 68% Positive 32% Negative Tip: Use word list spreadsheet available at http:// www.userfocus.co.uk/articles/satisfaction.html
  12. boston upa Case Study: Greenwich Hospital Website Redesign Background and

    Goals • Align the website with the character of Greenwich Hospital •  lluxurious, approachable, friendly, capable, multi-cultural/inclusive, establishedz • Update the site after nearly 10 years • Counter impressions that Greenwich Hospital is more than just about maternity and elder care, without damaging those notions • Communicate that they are long-standing members of the community 23
  13. boston upa Case Study: Greenwich Hospital Website Redesign Methodology • 3

    visually designed comps • 50 people reacted to each comp (quantitative) via survey • Additional feedback obtained via participant interviews (qualitative) 24 Hello, I am requesting feedback on a website I am working on. Your answers let me know if the site is conveying the right feel. 1. What are your initial reactions to the web site? 2. Which of the following words best do you feel best describe the site (please select 5): Survey Questions
  14. boston upa Results: Concept 1 26 88% Positive 12% Negative

    lMy initial reaction to this web site is that it seems kind of plain. There is not much going on in the page, and the colors seem kind of drab.z lThis is a nice looking website. It is well designed, well laid out, and is appealing to look at. It makes me want to continue to navigate the site to learn more. l
  15. boston upa Results: Concept 2 27 87% Positive 13% Negative

    lMen don`t really go with children… where`s a baby, there must be a mother. l lMy initial reaction to the website is that it seems very clean and modern. I like the layout, it looks like its easy to find information. l
  16. boston upa Results: Concept 3 28 95% Positive 5% Negative

    lI felt love. I saw a mother holding a child.. that`s pretty touchy. The site looks good, and it makes the hospital trustworthy.z lMy initial reaction was that the Hospital is represented by a caring, warm and friendly website.z
  17. boston upa Lessons Learned Methodology •  Mix of qualitative and

    quantitative is key. Qualitative helps provide color to the results, quantitative resonates with stakeholders and executives •  Position results as one form of input to decision-making process, not declaring a lwinnerz •  Simple, cost-efficient way to assess audience`s emotional response to a design 30
  18. boston upa Key Take Aways The Challenge: •  Measuring emotional

    responses to a design important, but complex. Experiences of a visual design are multifaceted, and a number of design aspects can impact their response to a product. •  There are a number of alternatives available to measure emotional response Our Experience: •  Leveraging Product Reaction Cards provides a low-cost, low-effort means to help us align aesthetics and general feel with desired brand attributes 31
  19. boston upa Thank You Documentation Case Study results and full

    presentation slides: http://www.madpow.net 32 Have a question? Michael Hawley [email protected] @hawleymichael Megan Grocki [email protected] @megangrocki 603-436-7177
  20. boston upa Additional Reading Benedek, Joey and Trish Miner. lMeasuring

    Desirability: New Methods for Evaluating Desirability in a Usability Lab Setting.zProceedings of UPA 2002 Conference, Orlando, FL, July 8–12, 2002. http://www.microsoft.com/usability/uepostings/desirabilitytoolkit.doc Lindgaard, Gitte, Gary Fernandes, Cathy Dudek, and J. Brown. "Attention Web Designers: You Have 50 Milliseconds to Make a Good First Impression!" Behaviour and Information Technology, 2006. http://www.imagescape.com/library/whitepapers/first-impression.pdf Rohrer, Christian. lDesirability Studies: Measuring Aesthetic Response to Visual Designs.zxdStrategy.com, October 28, 2008. Retrieved February 10, 2010. http://www.xdstrategy.com/2008/10/28/desirability_studies 33
  21. boston upa Additional Reading User Focus. "Measuring satisfaction: Beyond the

    Usability Questionnaire." Retrieved February 10, 2010. http://www.userfocus.co.uk/articles/satisfaction.html UserEffect. "Guide to Low-Cost Usability Tools." Retrieved May 12, 2010. http://www.usereffect.com/topic/guide-to-low-cost-usability-tools Tullis, Thomas and Jacqueline Stetson. lA Comparison of Questionnaires for Assessing Website Usability.zUsability Professionals` Association Conference, 2004. home.comcast.net/~tomtullis/publications/UPA2004TullisStetson.pdf Westerman, S. J., E. Sutherland, L. Robinson, H. Powell, and G. Tuck. lA Multi- method Approach to the Assessment of Web Page Designs.zProceedings of the 2nd international conference on Affective Computing and Intelligent Interaction, 2007. http:// portal.acm.org/citation.cfm?id=1422200 34
  22. boston upa Additional Tools Five Second Test http://fivesecondtest.com/ Feedback Army

    http://www.feedbackarmy.com Wordle http://www.wordle.net PrEmo http://www.premo-online.com 35