Upgrade to Pro — share decks privately, control downloads, hide ads and more …

Shipping Metrics from the Edge

Shipping Metrics from the Edge

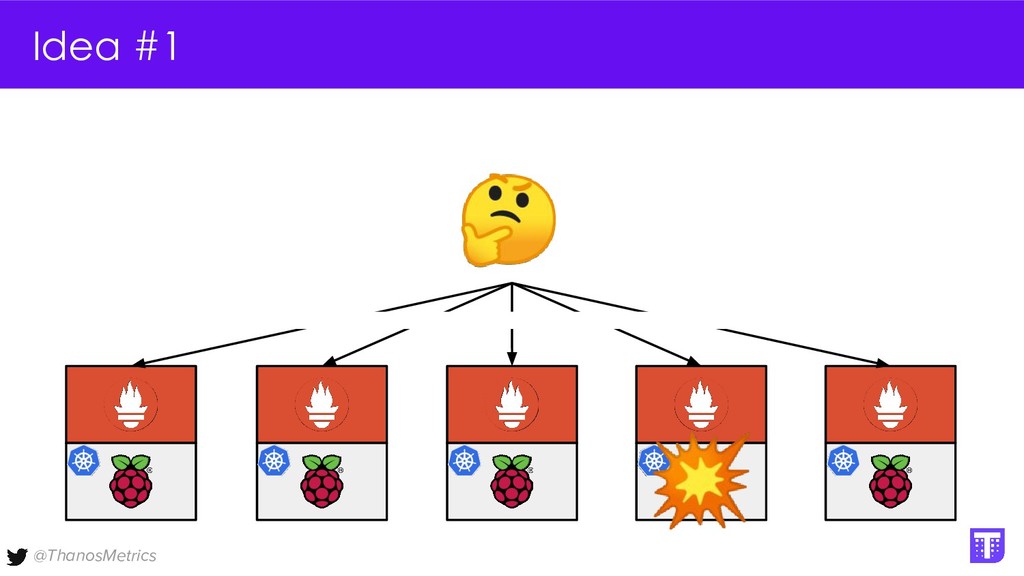
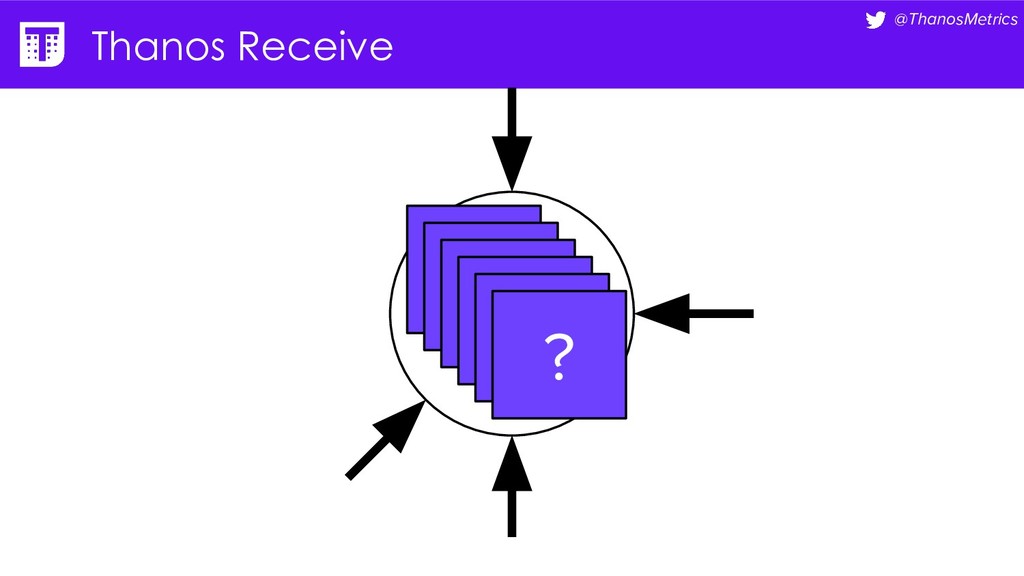
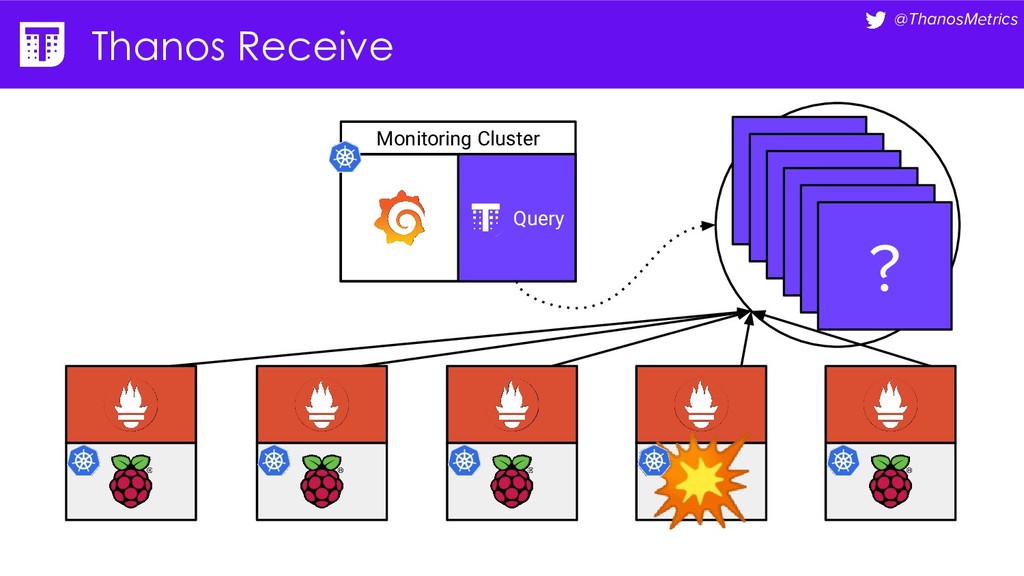
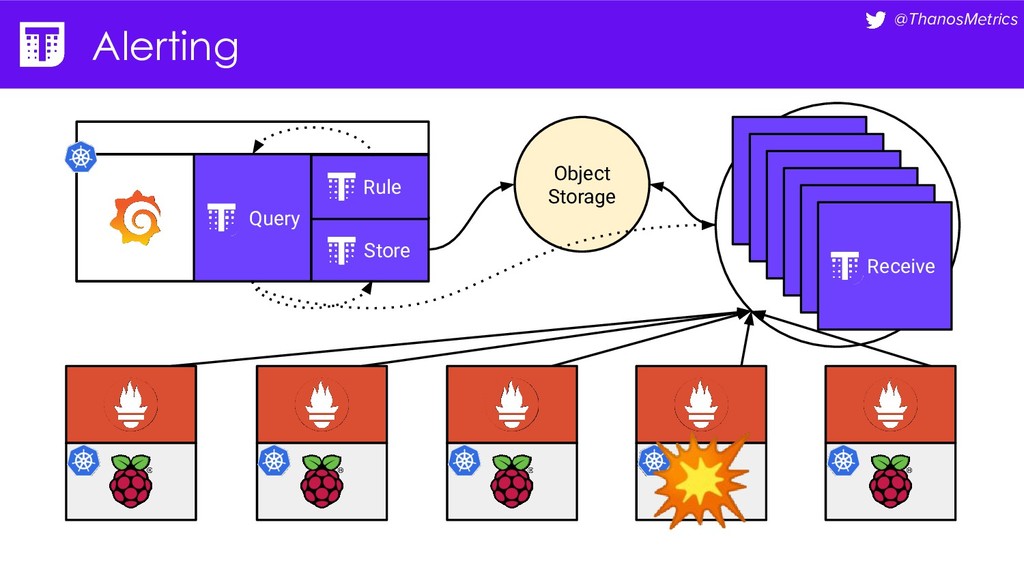
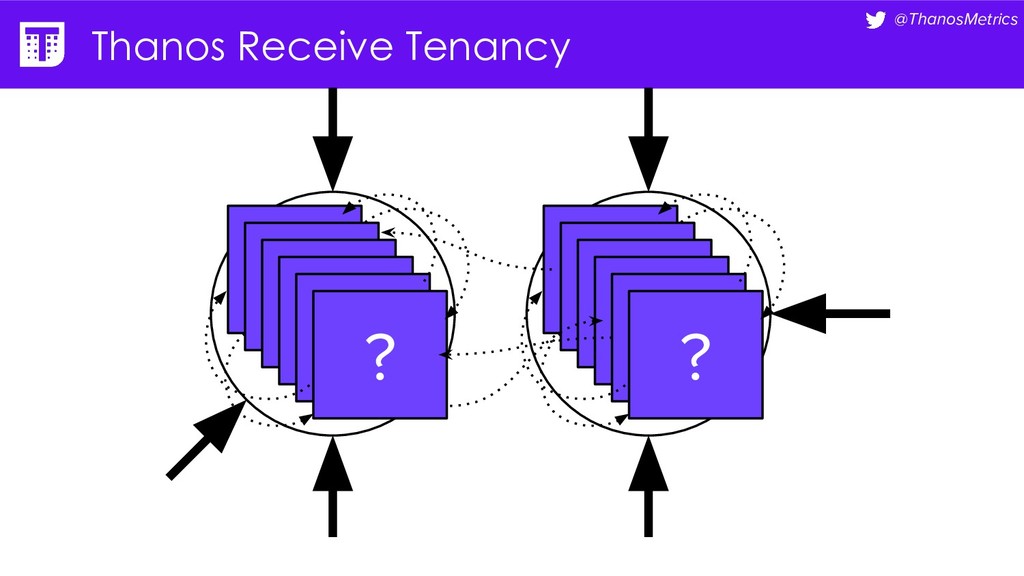
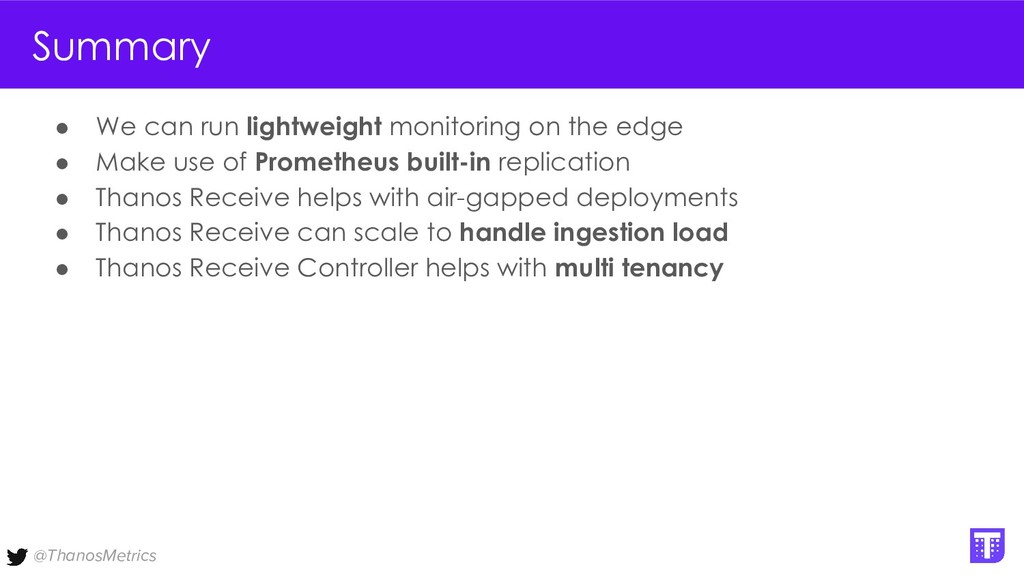
Computing is getting pushed to the edge, it may be your car, TV, washing machine, or your toaster. All these devices have a lot of computing power these days. While extending the cloud to the edge is getting solved with projects like KubeEdge or k3s, in this talk we want to take a closer look at how to run Prometheus on them. We want to configure Prometheus in a way that we can replicate its data to a central collecting point, that is running Thanos on Kubernetes in a replicated setup, and then make use of all the shipped metrics to efficiently query across the entire fleet.

Matthias Loibl

November 20, 2019
Tweet

More Decks by Matthias Loibl

Other Decks in Programming

Transcript

  1. @ThanosMetrics Shipping Metrics from the Edge Matthias Loibl, Software Engineer

    (Red Hat) [email protected] KubeCon + CNCF San Diego - November 19, 2019 metalmatze
  2. @ThanosMetrics Matthias Loibl ▪ Software Engineer @ Red Hat ▪

    OpenShift Monitoring Team ▪ OSS Contributor ◦ Prometheus Operator ◦ Thanos ◦ gopass ▪ Meetup Organiser ◦ Prometheus Berlin ▪ Hobbies ◦ Playing Drums & Bass
  3. @ThanosMetrics Problem We have • many air-gapped devices • many

    applications monitored independently We want • to know if specific device has problem • to know how everything as a whole is doing • to alert on problems on the device • to alert on problems across multiple devices
  4. @ThanosMetrics Alerting Client • Devices alert individually – they are

    provisioned with rules upon deployment • Configured to send alerts to central Alertmanager with device ID Server • Runs a cluster of Alertmanager • Receives alerts and de-duplicates then notifies according to routing No alerting across all devices yet :/
  5. @ThanosMetrics Idea #1 • Run Prometheus on each device •

    Run reverse proxy on device for access or access via SSH
  6. @ThanosMetrics Idea #1 • Run Prometheus on each device •

    Run reverse proxy on device for access or access via SSH Problems • We expose things to the outside – might not even be possible • No way of aggregating across devices easily ◦ Could scrape them individually and then aggregate :/
  7. @ThanosMetrics Idea #2 • Run Prometheus on each device •

    Run reverse proxy on device for access • Run central Prometheus that federates from individual devices
  8. @ThanosMetrics Idea #2 • Run Prometheus on each device •

    Run reverse proxy on device for access • Run central Prometheus that federates from individual devices Improvements • We can aggregate and query across all devices with central Prometheus Problems • We expose things to the outside – might not even be possible • We might only be able to federate every so often and lose samples
  9. @ThanosMetrics Idea #3 • Run Prometheus on each device •

    Run app/client that collects metrics from Prometheus, then forwards those to central place via some protocol
  10. @ThanosMetrics Idea #3 • Run Prometheus on each device •

    Run app/client that collects metrics from Prometheus, then forwards those to central place via some protocol Improvements • We don’t expose Prometheus to the outside Problems • Collect metrics from Prometheus every 1 min ◦ Depending on target scrape interval of Prometheus we lose samples • Most likely something custom-built
  11. @ThanosMetrics Idea #4 • Run Prometheus on each device •

    Run the Thanos sidecar and upload written blocks to some central object storage
  12. @ThanosMetrics Idea #4 • Run Prometheus on each device •

    Run the Thanos sidecar and upload written blocks to some central object storage Problems • We will have lag of metrics showing up, by default at least 2h until a block is written • We need to expose object storage to devices (not too bad, but we can do better)
  13. @ThanosMetrics Prometheus Remote Write • Queue per destination • Each

    queue reads from the write-ahead-log (WAL) • Sends requests to configured endpoint • Retries to send upon failure WAL Shard 1 Shard ... Shard n endpoint endpoint endpoint
  14. @ThanosMetrics Thanos Receive • Hashes are calculated from the entire

    label set • Tenant’s ID will help to distribute the load across receivers • Hashing function is xxHash, same as Prometheus
  15. @ThanosMetrics Thanos Receive Controller • Maps Tenants to individual hashrings

    / StatefulSets ◦ Populates endpoints in configmap ◦ Every Thanos receiver mounts same ConfigMap
  16. @ThanosMetrics KubeCon + CloudNativeCon Thanos Deep Dive: Inside a Distributed

    Monitoring System ▪ Bartłomiej Płotka & Frederic Branczyk, RedHat ▪ Wednesday November 20, 2019 ▪ 5:20pm (Room 6C)
  17. @ThanosMetrics Summary • We can run lightweight monitoring on the

    edge • Make use of Prometheus built-in replication • Thanos Receive helps with air-gapped deployments • Thanos Receive can scale to handle ingestion load • Thanos Receive Controller helps with multi tenancy
  18. @ThanosMetrics Work with us Red Hat’s Observability Team is hiring!

    https://global-redhat.icims.com/jobs/74508/principal-software-engineer---prometheus/job