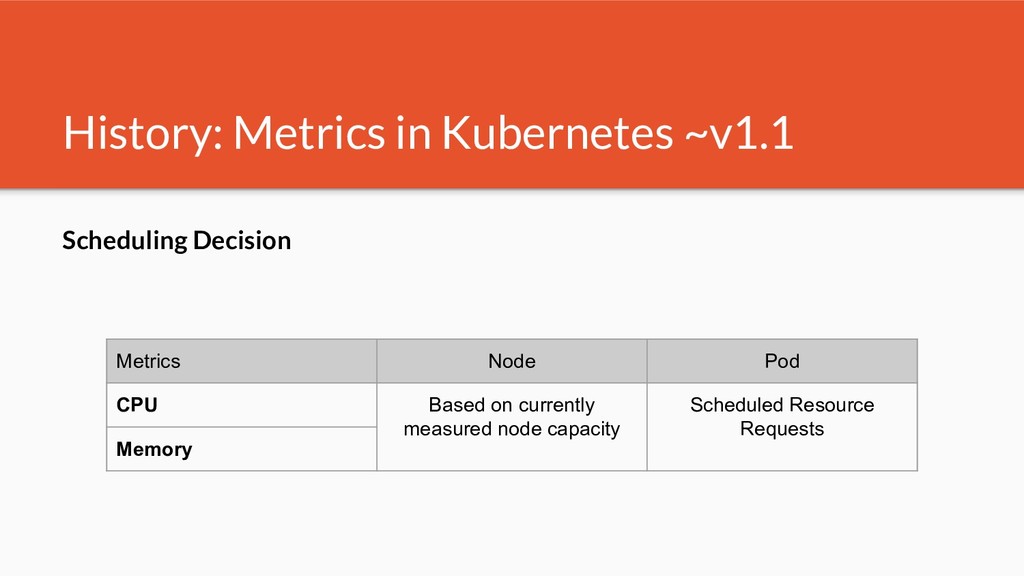
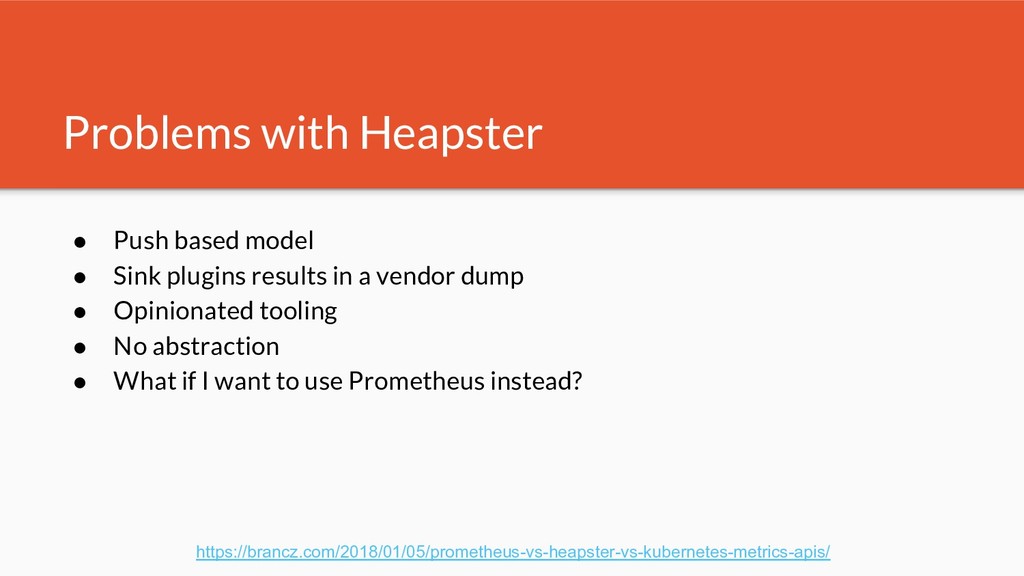
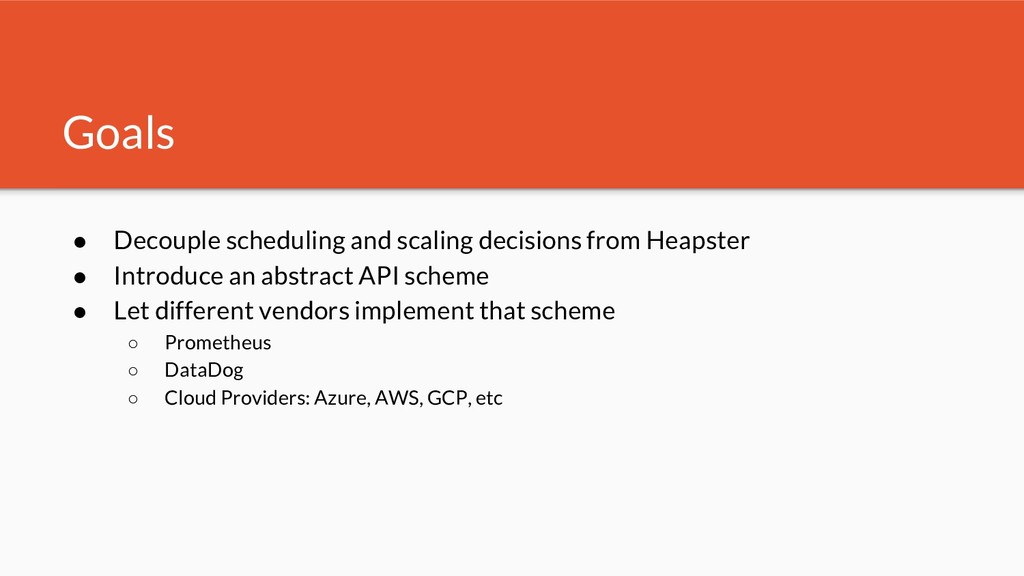
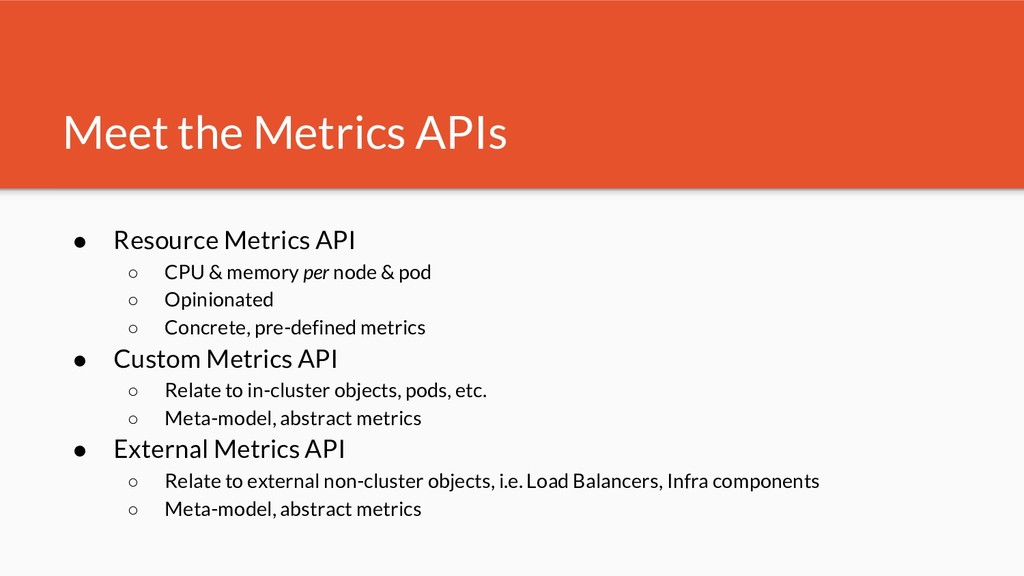
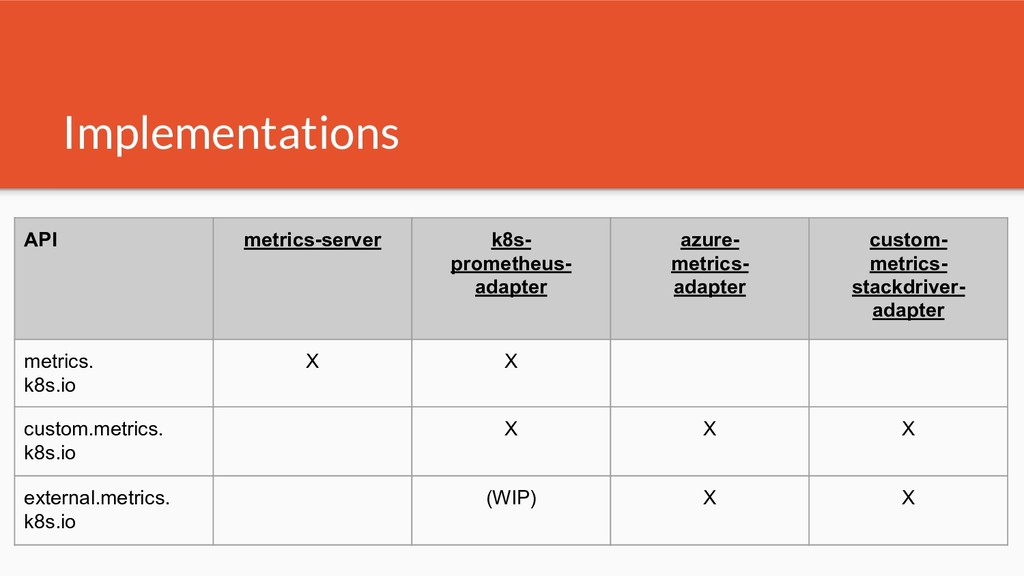
Kubernetes traditionally uses metrics for its core scheduling decisions - in the beginning all of this started with an opinionated internal stack. Since then Kubernetes has introduced 3 orthogonal standardized metrics APIs. As of today many implementations exist - i.e. for cloud providers and on premise.
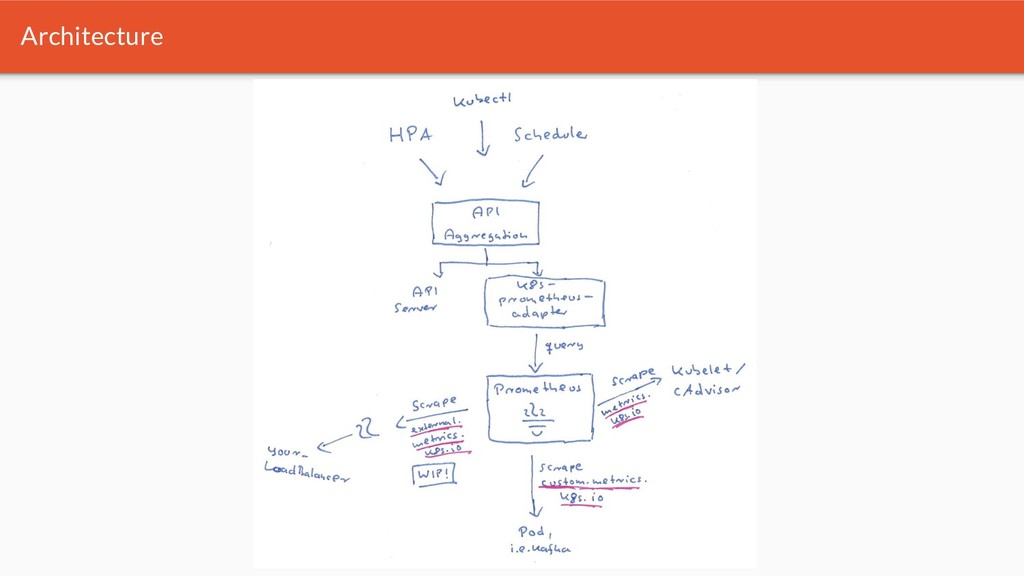
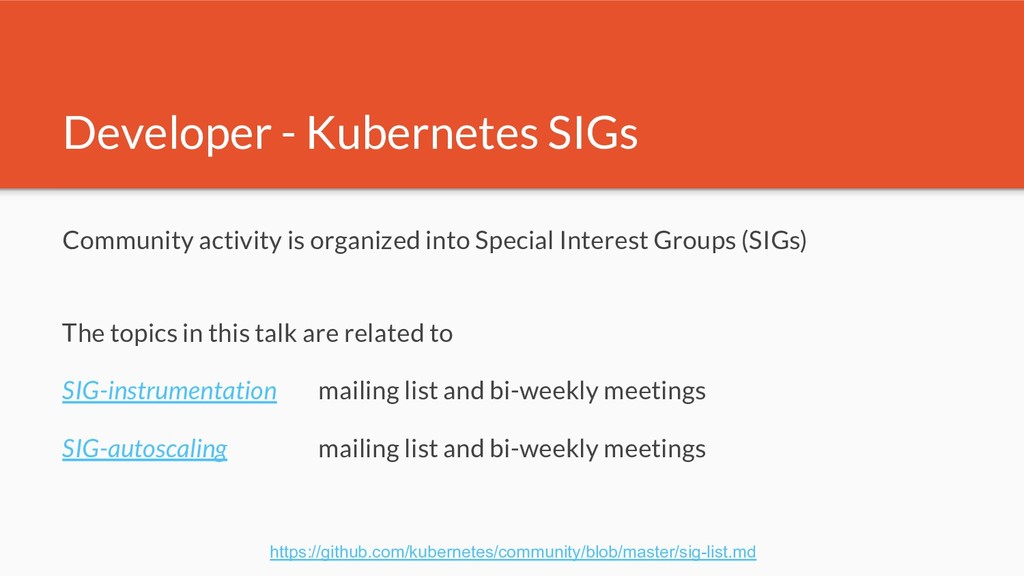
In this talk we will first show the community process around metrics in Kubernetes, how the Special Interest Group (SIG) for instrumentation works and how to get involved. We will do an overview and deep dive in all 3 metric APIs, with a concrete fully open source Prometheus based deployment example. Once we have Prometheus running we will show how to bridge the gap between Prometheus and Kubernetes to use these APIs. Finally, we will conclude the talk with an example on scaling your deployments based on custom metrics served by your Prometheus.
![Association $ curl -s 'http://localhost:9090/api/v1/series?match[]=container_cpu_usage_seconds_total' \ | jq . {](https://files.speakerdeck.com/presentations/e2c714955b2044c3b0a669958d6b9c18/slide_22.jpg)
![Discovery $ curl -s 'http://localhost:9090/api/v1/series?match[]=http_requests_total\{namespace!=""\}' \ | jq . {](https://files.speakerdeck.com/presentations/e2c714955b2044c3b0a669958d6b9c18/slide_31.jpg)
![Association $ curl -s 'http://localhost:9090/api/v1/series?match[]=http_requests_total\{namespace!=""\}' \ | jq . {](https://files.speakerdeck.com/presentations/e2c714955b2044c3b0a669958d6b9c18/slide_33.jpg)
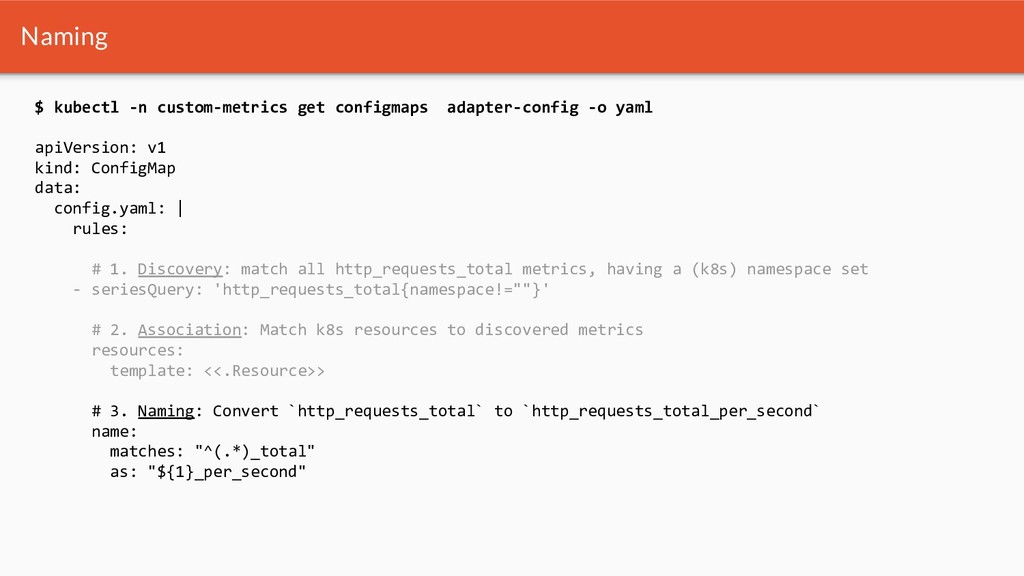
![Naming $ curl -s 'http://localhost:9090/api/v1/series?match[]=http_requests_total\{namespace!=""\}' \ | jq . {](https://files.speakerdeck.com/presentations/e2c714955b2044c3b0a669958d6b9c18/slide_35.jpg)