Upgrade to Pro — share decks privately, control downloads, hide ads and more …

Uber: Anomaly Detection At Scale

Uber: Anomaly Detection At Scale

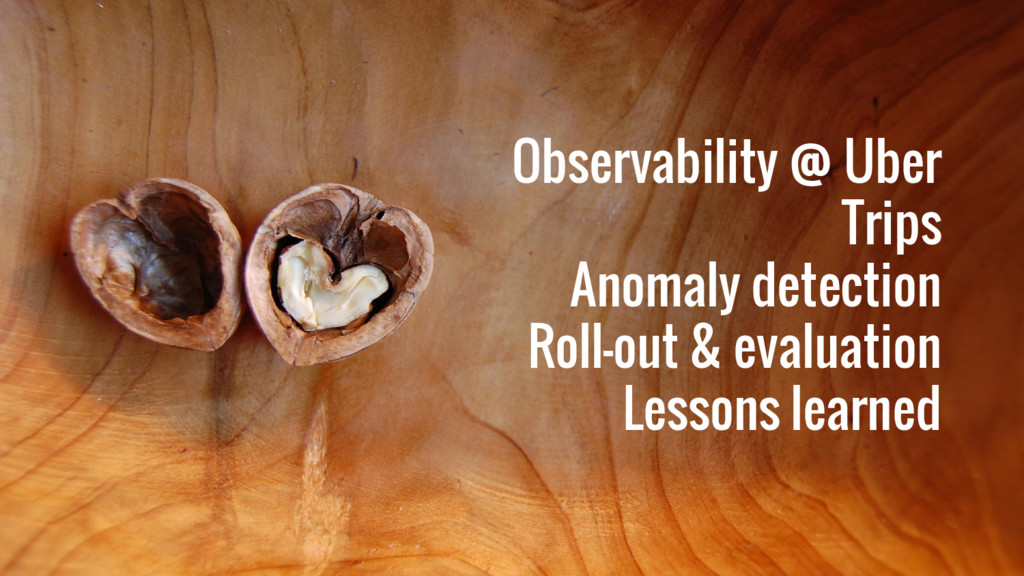
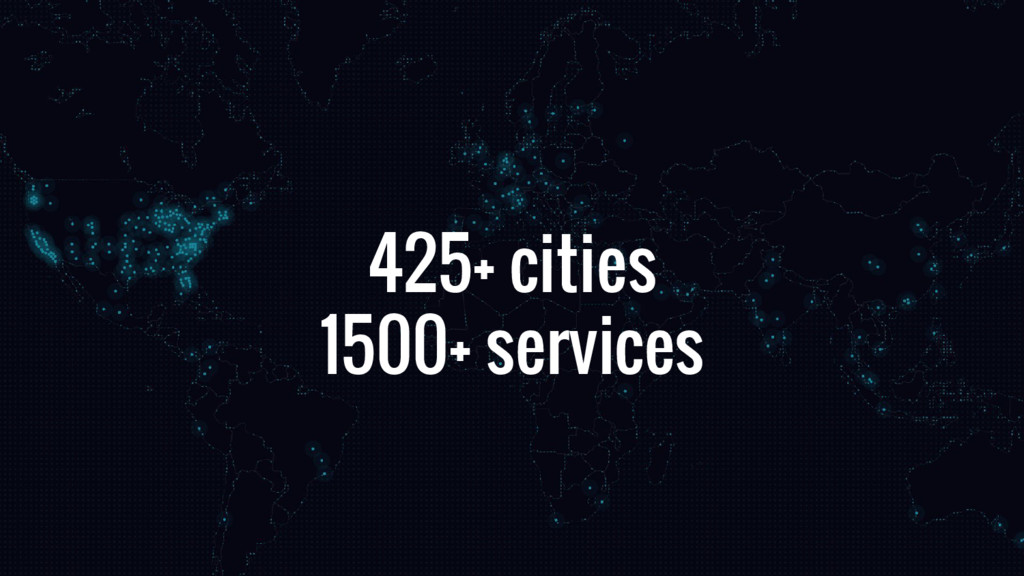
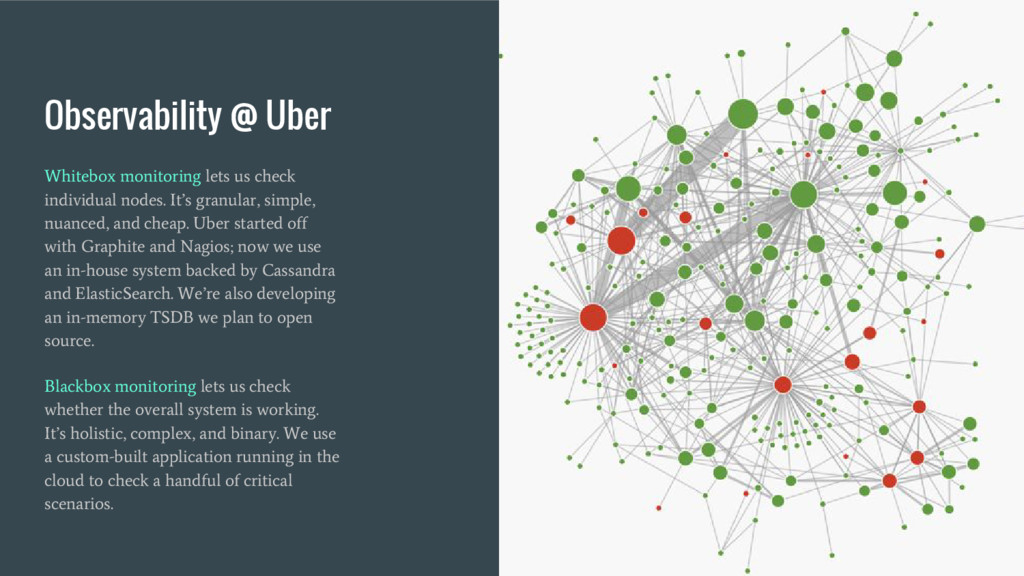
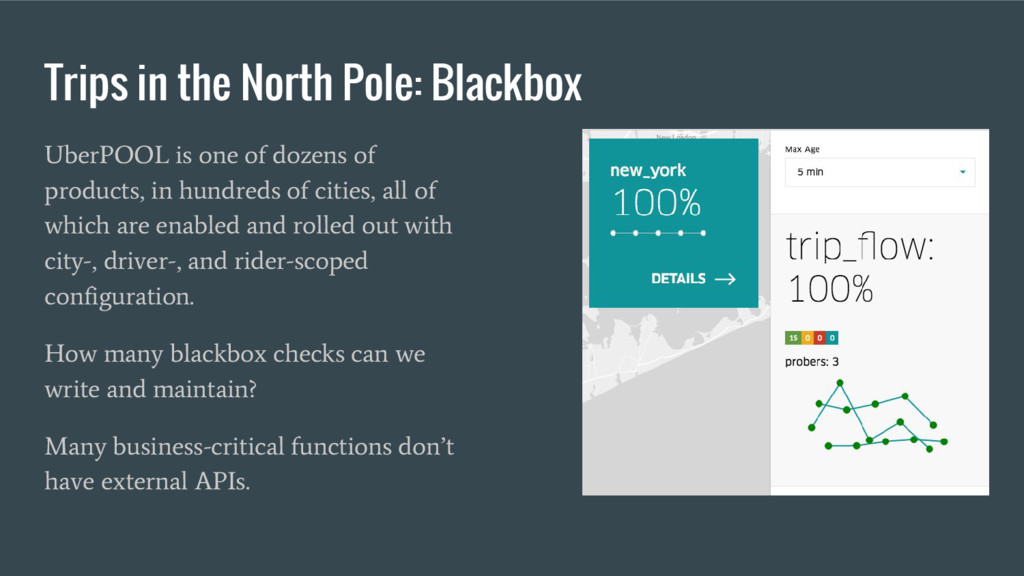
Like many companies, Uber launched with a monolithic backend; driver dispatching, receipt processing, and every other business function ran as a component within one application. A few short years later, Uber runs a complex system of more than a thousand microservices. While applications are now simpler to modify and safer to deploy, they’re further removed from the business that they support—even if every service is healthy, Uber can’t be sure that riders in each city are able to take trips.

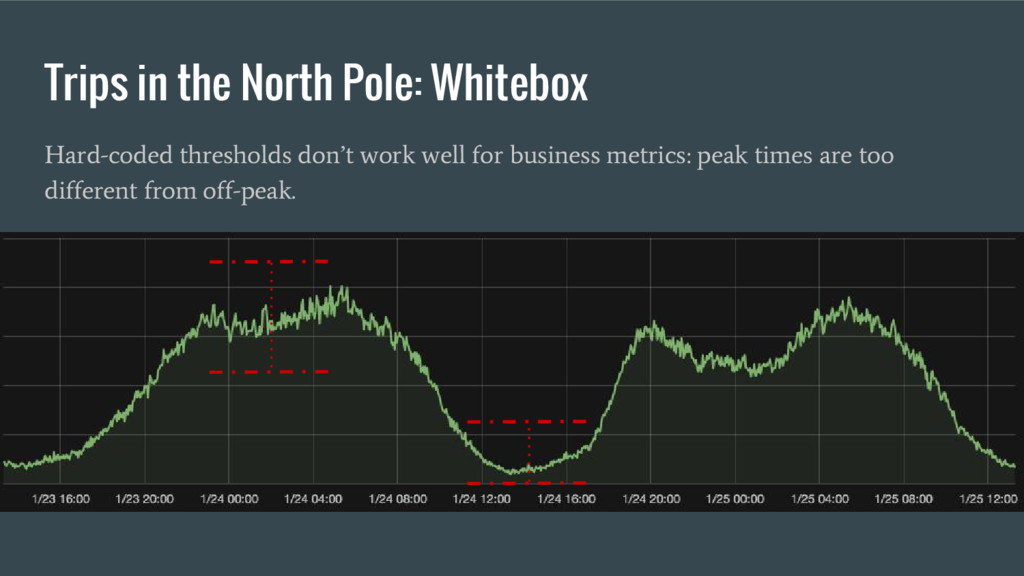
If you’re planning (or in the midst of) a transition to microservices, you’ll need a strategy to deal with the same challenge: your system architecture no longer matches your business. How can you reassemble the metrics from your microservices to confidently monitor the messy world of business outcomes? How can you strike the right balance between catching outages and avoiding midnight pages?

Akshay Shah and Michael Hamrah share the challenges Uber faced when monitoring business outcomes instead of engineering metrics and why building an anomaly detection system to solve those problems is easier than you might expect. Akshay and Michael describe how Uber selected which metrics to monitor and why traditional software monitoring tools don’t work for business metrics. They also offer an overview of Uber’s scalable, low-noise, highly accurate anomaly detection system, highlighting the design trade-offs made to prioritize simplicity and performance.

Michael Hamrah

September 22, 2016
Tweet

More Decks by Michael Hamrah

Other Decks in Programming

Transcript

  1. Anomaly Detection at Scale Or, how Uber monitors the health

    of its city operations September 22, 2016 Velocity NYC
  2. Observability @ Uber Whitebox monitoring lets us check individual nodes.

    It’s granular, simple, nuanced, and cheap. Uber started off with Graphite and Nagios; now we use an in-house system backed by Cassandra and ElasticSearch. We’re also developing an in-memory TSDB we plan to open source. Blackbox monitoring lets us check whether the overall system is working. It’s holistic, complex, and binary. We use a custom-built application running in the cloud to check a handful of critical scenarios.
  3. Trips in the North Pole Imagine that Uber operated in

    the North Pole. The city team there wants to make sure that uberPOOL is working, and this chart shows the number of completed pool trips. How do we monitor this?
  4. Trips in the North Pole: Whitebox Hard-coded thresholds don’t work

    well for business metrics: peak times are too different from off-peak.
  5. Trips in the North Pole: Blackbox UberPOOL is one of

    dozens of products, in hundreds of cities, all of which are enabled and rolled out with city-, driver-, and rider-scoped configuration. How many blackbox checks can we write and maintain? Many business-critical functions don’t have external APIs.
  6. Generic solutions are hard github.com/etsy/skyline github.com/ankane/anomaly github.com/numenta/nupic github.com/linkedin/luminol github.com/yahoo/egads github.com/twitter/AnomalyDetection

    “Numenta Platform for Intelligent Computing: a brain-inspired machine intelligence platform, and biologically accurate neural network based on cortical learning algorithms.” ¯\_( ツ )_/¯
  7. Generic solutions are hard slow, complex, and imperfect Generic anomaly

    detection is an active research area, with approaches based on statistics, run-of-the-mill machine learning, and deep learning. Papers don’t always work well in production, especially if you only care about your data. Plus, we don’t want cutting-edge machine learning algorithms in our monitoring stack (yet). So we kept it simple and took shortcuts
  8. Shortcuts Uber’s business has a strong weekly cycle - weekends

    are busy, and weekday afternoons are quiet. Changes in rider demand and car supply happen over minutes and hours, not seconds. Virtually all important business metrics and user interactions have the same weekly cycle and slow change. We hard-code those parameters and hand-configure any exceptions. now -1w -3w -2w -4w -5w
  9. Simplicity Every half-hour, we make a forecast about the next

    half-hour. What are the upper and lower bounds of normal? Save the forecast. Every minute, check the most recent reading against the latest forecast and page someone if we’re outside the normal range. (This is basically teaching a computer set Nagios thresholds.) 5w raw data forecasting (every 30m) thresholds current data evaluation (every 1m) alert
  10. Forecasting If it’s 4pm on a Thursday, so focus on

    the 4-5pm hour from the past five Thursdays. For each week, calculate a ratio between the 5pm measurement and the 4pm measurement. Multiply the median ratio by the current number. That’s the forecast. To generate thresholds, estimate how spiky this metric is. Multiply that by a hard-coded constant, and then add a little fudge factor. Add that to your forecast to generate an upper threshold, and subtract to generate the lower threshold. Use increasing constants to produce thresholds for increasing degrees of weirdness. (We use a 9-point scale.) 1.1x 1.4x 1.1x 1.3x 1.5x now -1w -2w -3w -4w -5w 4pm 5pm forecast 1.3x current
  11. Trips in the North Pole Armed with our forecasting algorithm,

    monitoring uberPOOL in the North Pole is easy.*
  12. Complexity Of course, it’s not quite that simple. We window

    and summarize the input data to make our forecasts more stable, and we ended up needing other approaches to detect really gradual and abrupt outages. We also use a few different techniques to prevent outages from polluting subsequent forecasts. Even with all that, this algorithm is implemented in 1300 lines of Go and doesn’t use anything beyond the standard library. Creating a forecast takes tens of milliseconds. 99% of outages detected 65% of pages accurate
  13. Implementation A dedicated service polls for data periodically, calculates the

    forecasts, and saves them. On demand, the core query engine fetches and applies forecasts to convert raw metrics into anomaly levels (on a 9-point scale). Our monitoring system’s query language has a user-defined function for anomaly detection. To users, this is no different from any other function. We’re currently using anomaly detection to track thousands of metrics. Query Engine Dashboards Alerting Metrics Ingest and Storage Forecast Storage Forecast Engine
  14. Challenges: Adoption Threshold-based alerting is familiar, so machine-calculated thresholds were

    a comfortable next step. More exotic techniques would have taken longer to be trusted. Visualizing the thresholds helped a lot. Usability really matters, even for an audience of developers. Adding a dedicated UI increased adoption greatly, even among engineers comfortable with the monitoring query language.
  15. Challenges: Tracking Effectiveness Difficult for us to measure real-world accuracy.

    Our outages database wasn’t designed for training algorithms, so there isn’t a 100%-complete source of truth. Best option is to have users rate each page. Misconfiguration is common, and sometimes metrics change over time. We now auto-detect when forecasting is applied to an unsuitable timeseries and message the user. Improving these algorithms is hard - it requires batch access to lots of monitoring data. We haven’t solved this one yet.
  16. Lessons Learned • Hard-coding our typical weekly period made the

    algorithm much simpler. • The core forecasting idea was familiar to users. • Polling forecast engine can be used with other data sources. • Architecture keeps experimental forecasting code separate from mission-critical query engine. • Go was a good language choice, despite lack of libraries. • Measure real-world accuracy (v. using a set of test data). • Vet initial users carefully, plan for dirty input data. • Build a complete outage-reporting system sooner. • Get monitoring data into a batch-processing system.
  17. Of course, the two of us didn’t build all this

    ourselves. Dozens of engineers and data scientists, both here and in SF, built these systems and continue to improve them.