◦ Java, Groovy, Scala, Spring Boot, IOT, AWS, Terraform, Infrastructure • Enjoying the good things • Chef leuke dingen doen == “trying out cool and new stuff” • Currently involved in a big IOT project • Wannabe chef, movie & Netflix addict
features • I can demo so it works :) • It works with 1 user, so it will work with multiple • Don’t worry about performance we will just scale using multiple machines/processes • Logging is into place
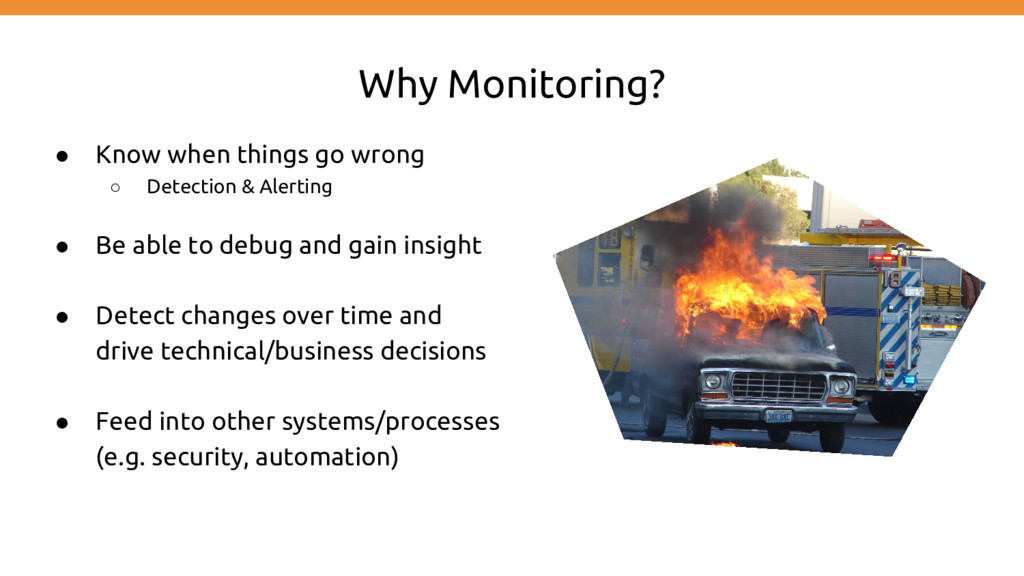
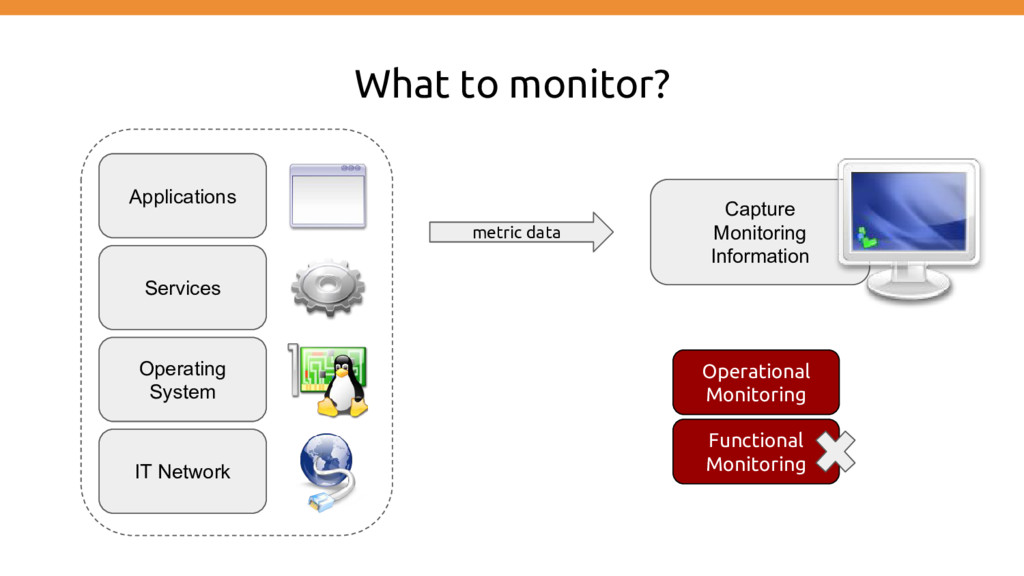
& Alerting • Be able to debug and gain insight • Detect changes over time and drive technical/business decisions • Feed into other systems/processes (e.g. security, automation)
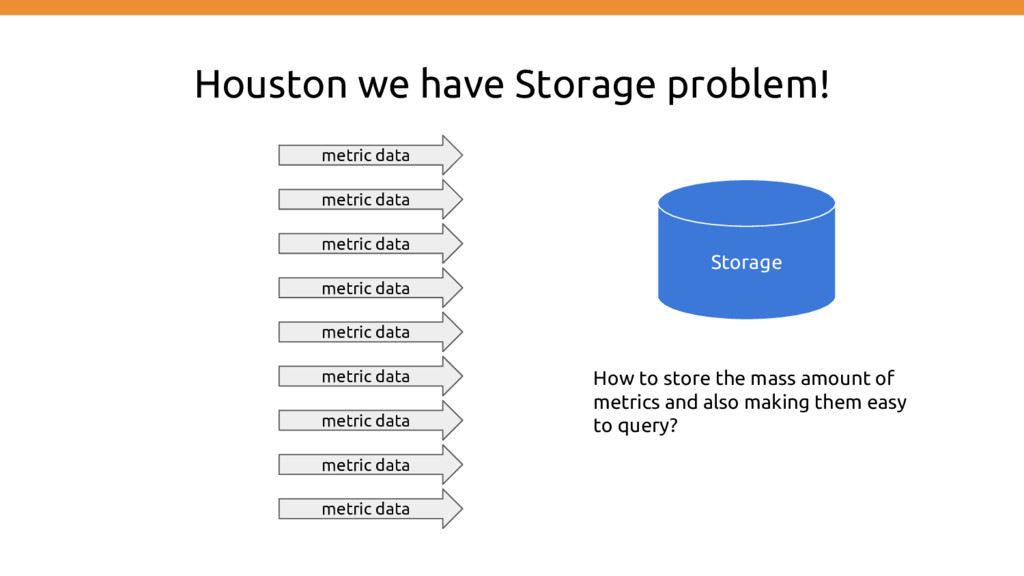
metric data metric data metric data metric data metric data metric data metric data How to store the mass amount of metrics and also making them easy to query?
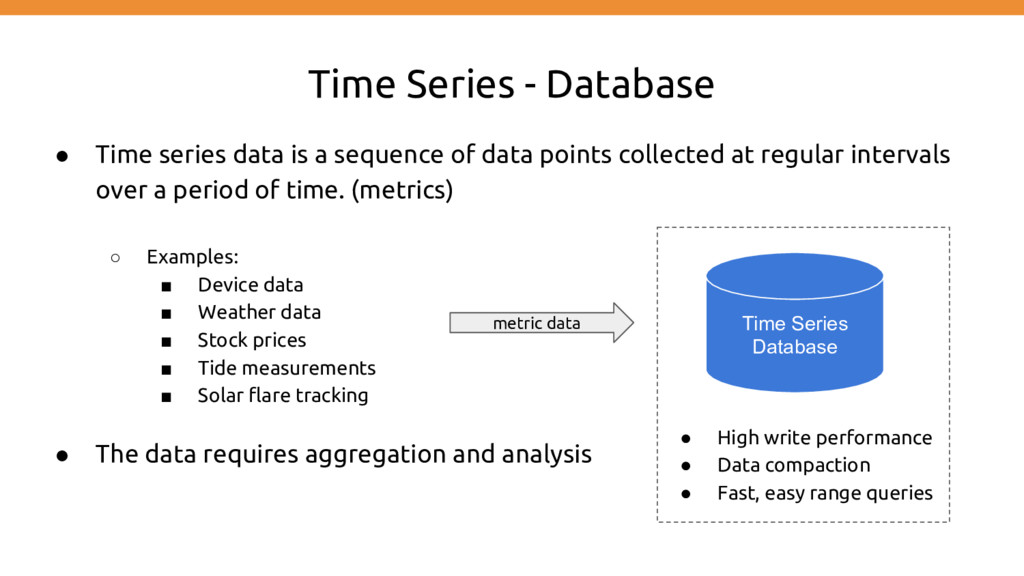
sequence of data points collected at regular intervals over a period of time. (metrics) ◦ Examples: ▪ Device data ▪ Weather data ▪ Stock prices ▪ Tide measurements ▪ Solar flare tracking • The data requires aggregation and analysis Time Series Database metric data • High write performance • Data compaction • Fast, easy range queries
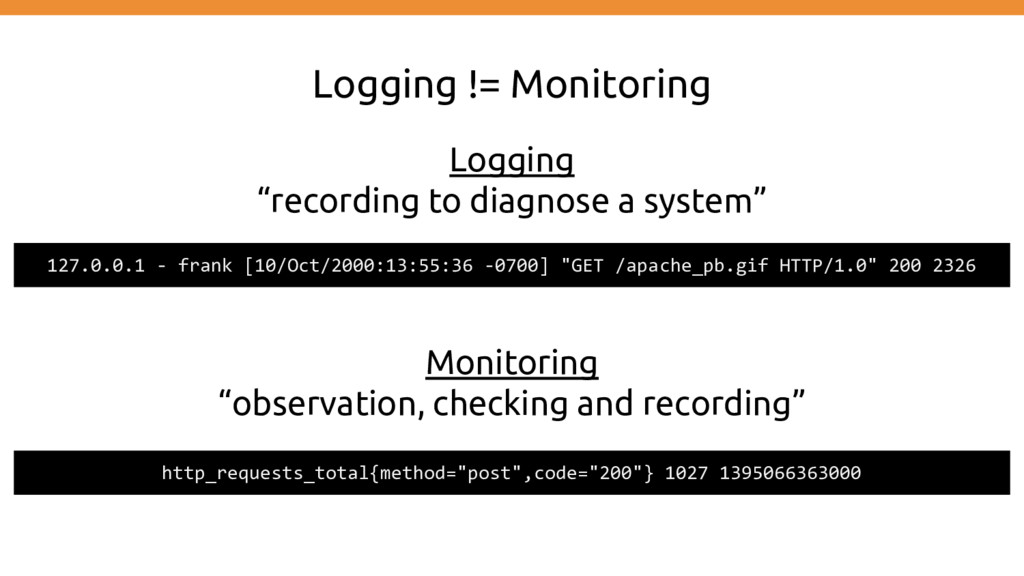
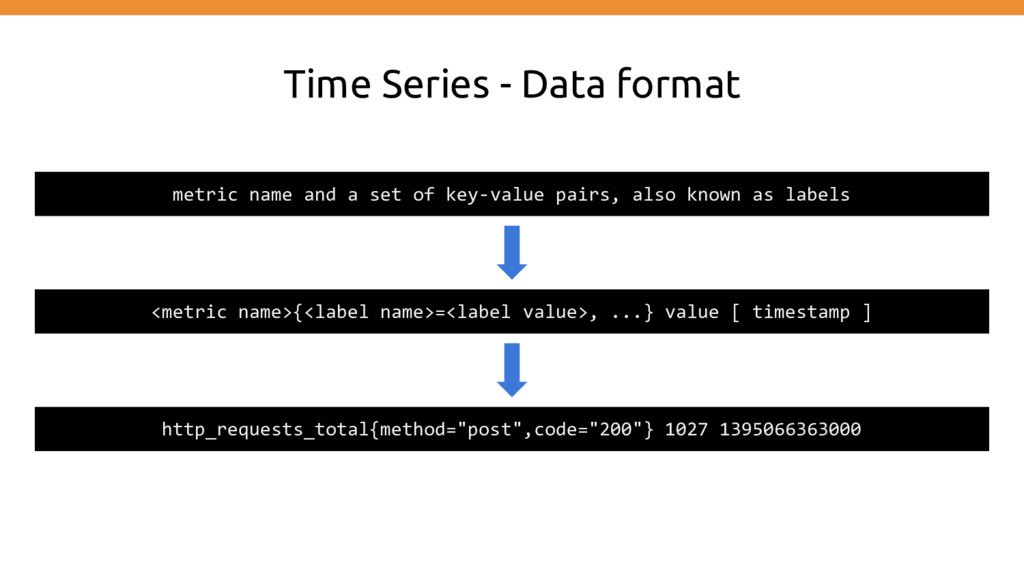
as labels <metric name>{<label name>=<label value>, ...} value [ timestamp ] http_requests_total{method="post",code="200"} 1027 1395066363000 Time Series - Data format
originally built at SoundCloud. It is now a standalone open source project and maintained independently of any company. https://prometheus.io Implemented using
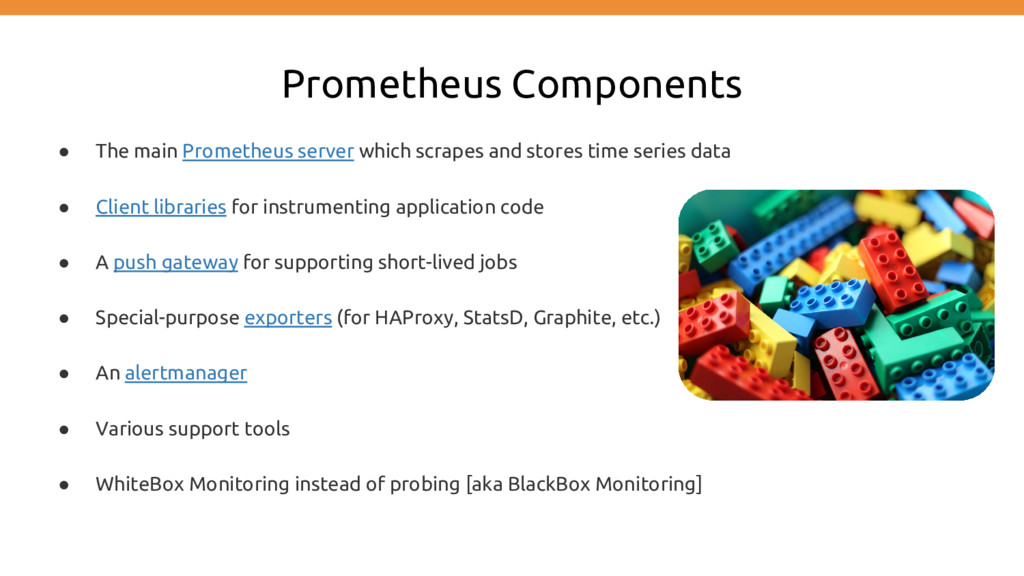
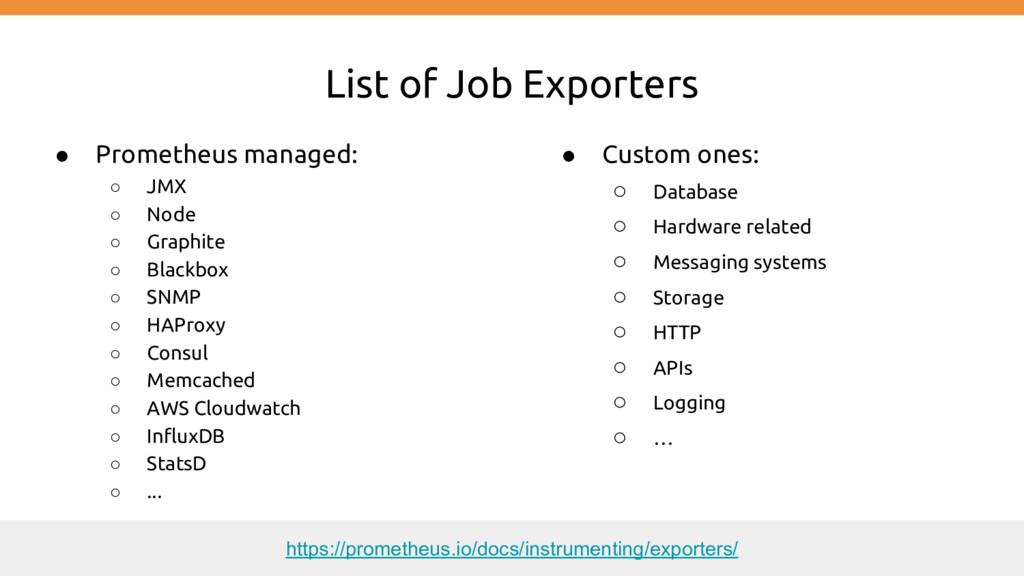
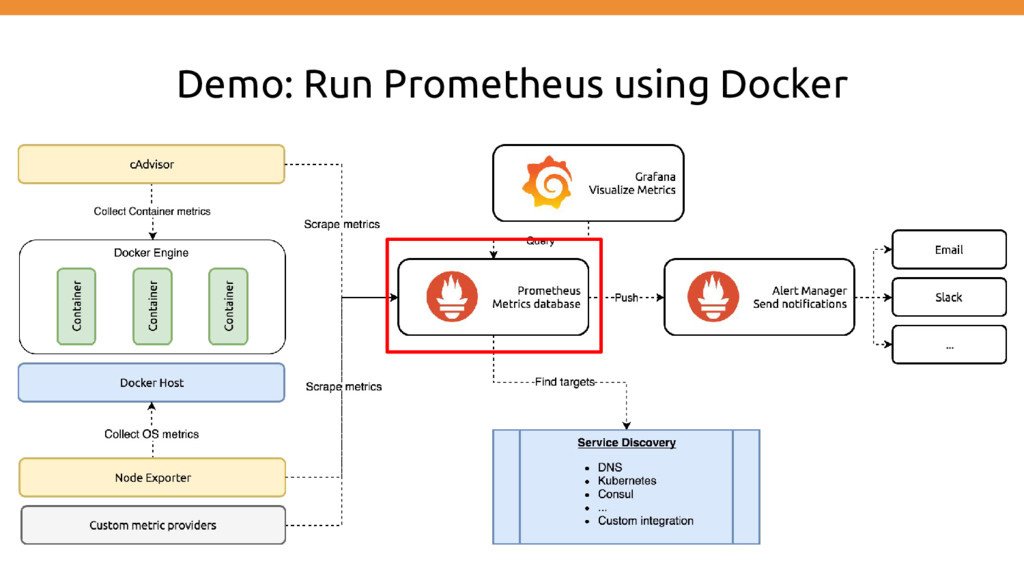
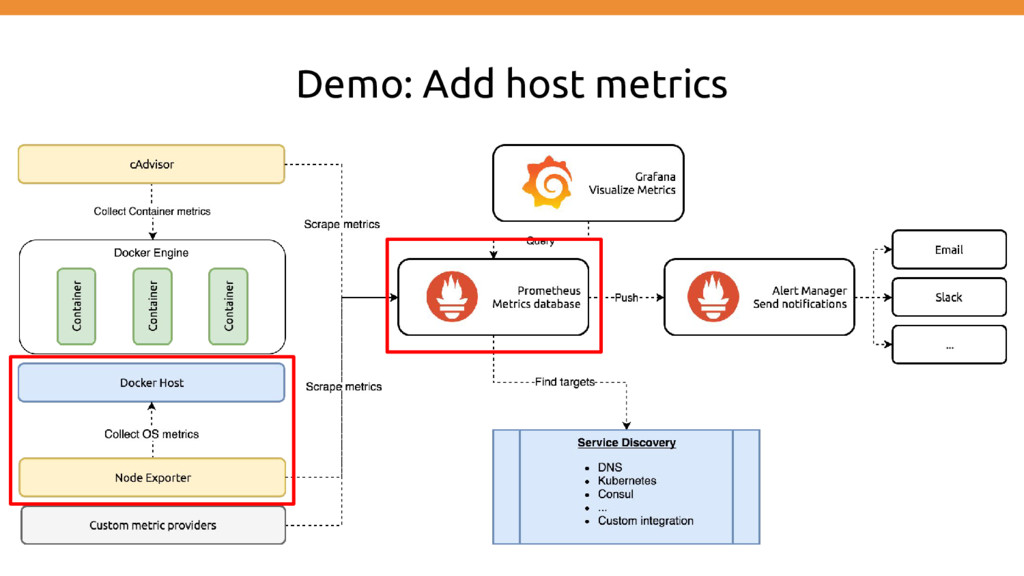
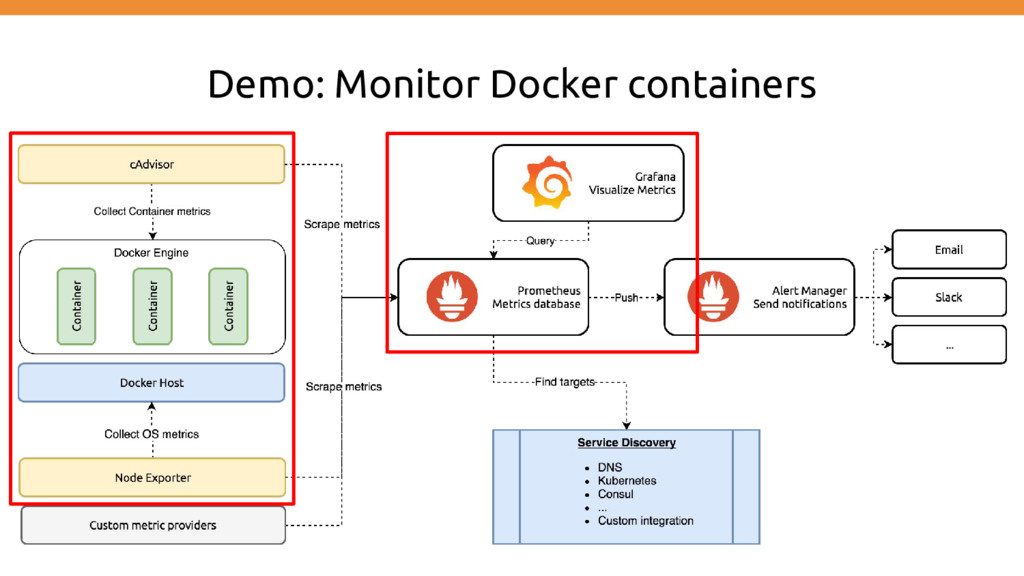
stores time series data • Client libraries for instrumenting application code • A push gateway for supporting short-lived jobs • Special-purpose exporters (for HAProxy, StatsD, Graphite, etc.) • An alertmanager • Various support tools • WhiteBox Monitoring instead of probing [aka BlackBox Monitoring]
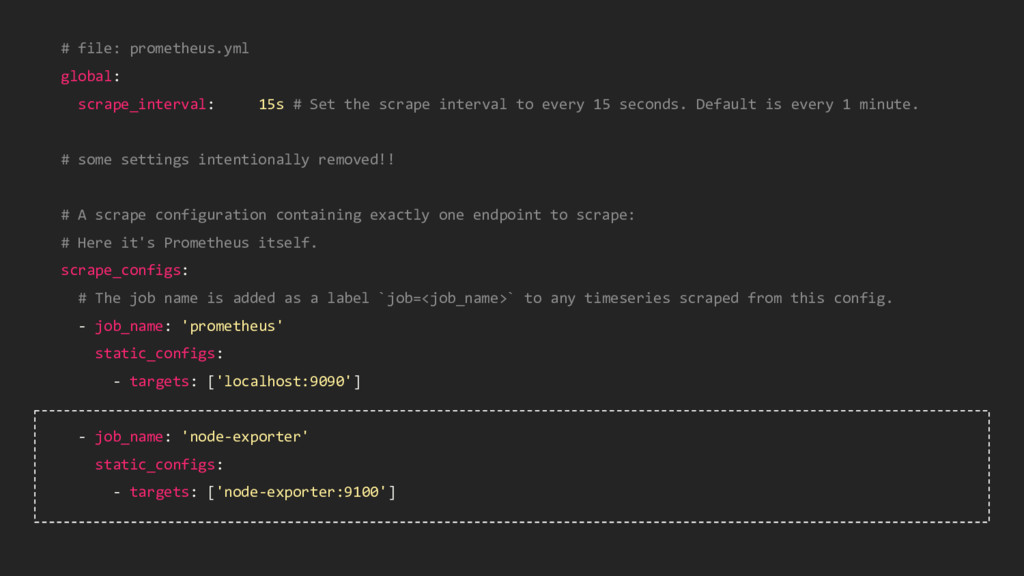
interval to every 15 seconds. Default is every 1 minute. # some settings intentionally removed!! # A scrape configuration containing exactly one endpoint to scrape: # Here it's Prometheus itself. scrape_configs: # The job name is added as a label `job=<job_name>` to any timeseries scraped from this config. - job_name: 'prometheus' static_configs: - targets: ['localhost:9090']
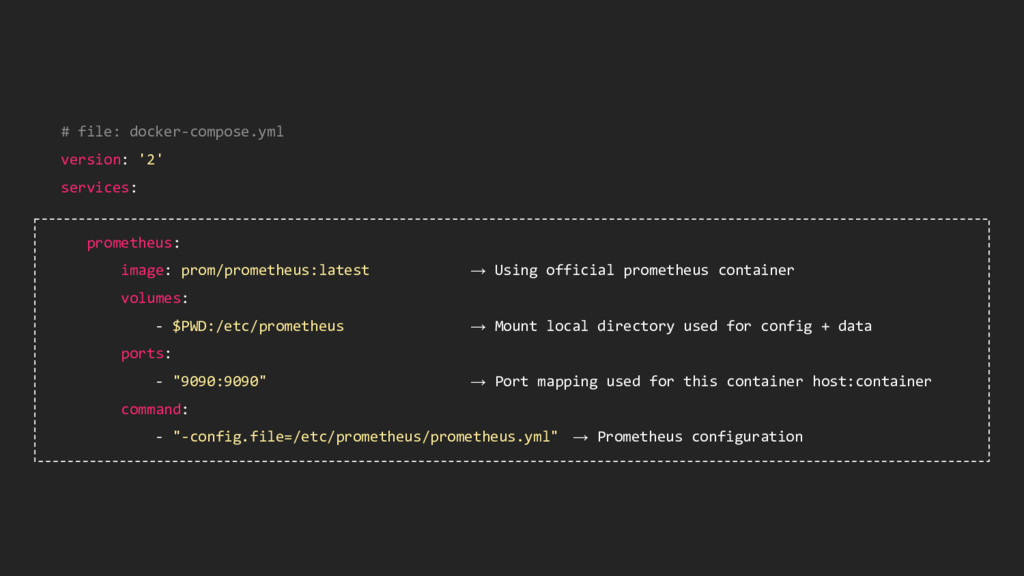
→ Using official prometheus container volumes: - $PWD:/etc/prometheus → Mount local directory used for config + data ports: - "9090:9090" → Port mapping used for this container host:container command: - "-config.file=/etc/prometheus/prometheus.yml" → Prometheus configuration
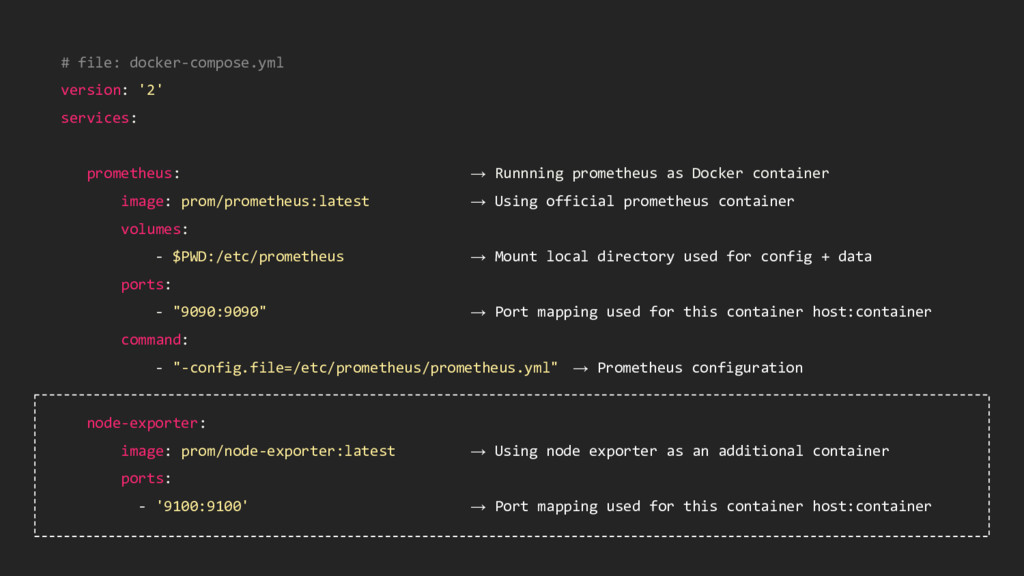
as Docker container image: prom/prometheus:latest → Using official prometheus container volumes: - $PWD:/etc/prometheus → Mount local directory used for config + data ports: - "9090:9090" → Port mapping used for this container host:container command: - "-config.file=/etc/prometheus/prometheus.yml" → Prometheus configuration node-exporter: image: prom/node-exporter:latest → Using node exporter as an additional container ports: - '9100:9100' → Port mapping used for this container host:container
scrape interval to every 15 seconds. Default is every 1 minute. # some settings intentionally removed!! # A scrape configuration containing exactly one endpoint to scrape: # Here it's Prometheus itself. scrape_configs: # The job name is added as a label `job=<job_name>` to any timeseries scraped from this config. - job_name: 'prometheus' static_configs: - targets: ['localhost:9090'] - job_name: 'node-exporter' static_configs: - targets: ['node-exporter:9100']
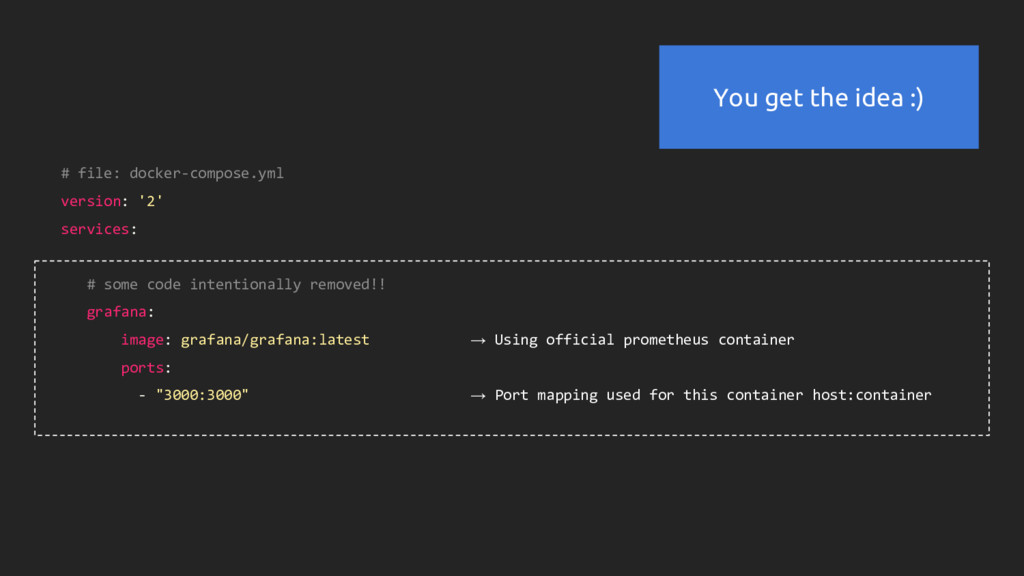
removed!! grafana: image: grafana/grafana:latest → Using official prometheus container ports: - "3000:3000" → Port mapping used for this container host:container You get the idea :)
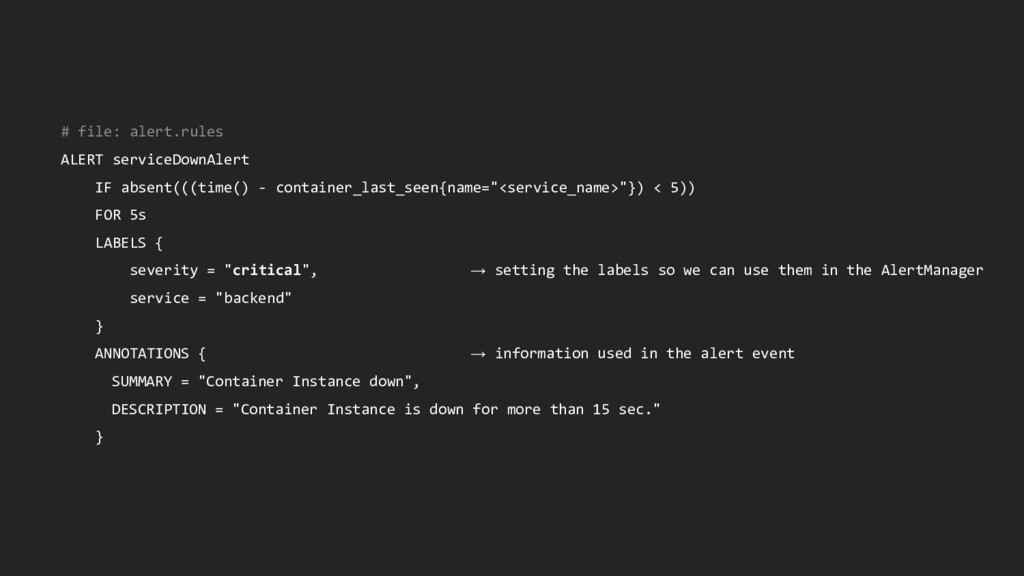
5)) FOR 5s LABELS { severity = "critical", → setting the labels so we can use them in the AlertManager service = "backend" } ANNOTATIONS { → information used in the alert event SUMMARY = "Container Instance down", DESCRIPTION = "Container Instance is down for more than 15 sec." }
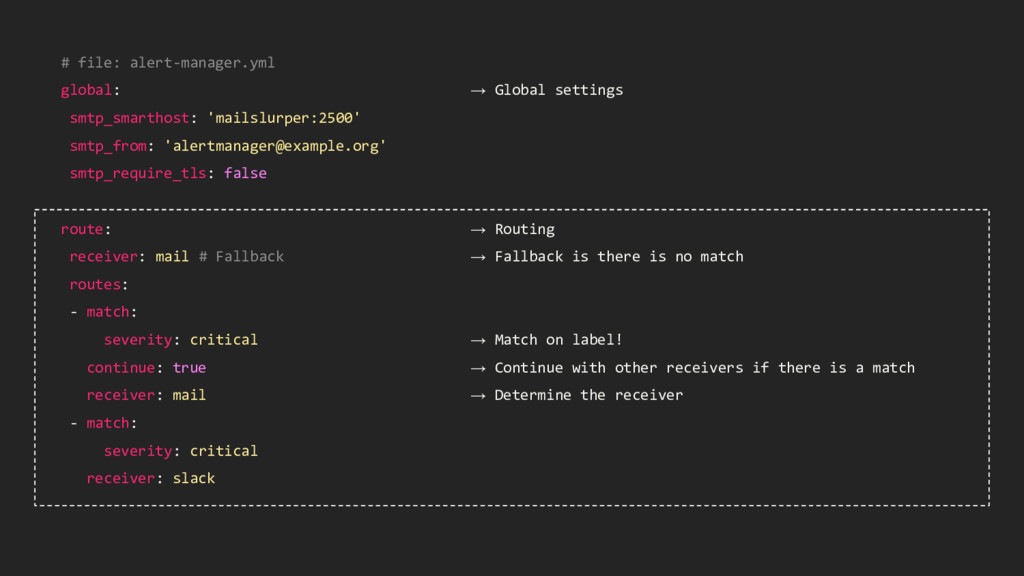
'[email protected]' smtp_require_tls: false route: → Routing receiver: mail # Fallback → Fallback is there is no match routes: - match: severity: critical → Match on label! continue: true → Continue with other receivers if there is a match receiver: mail → Determine the receiver - match: severity: critical receiver: slack
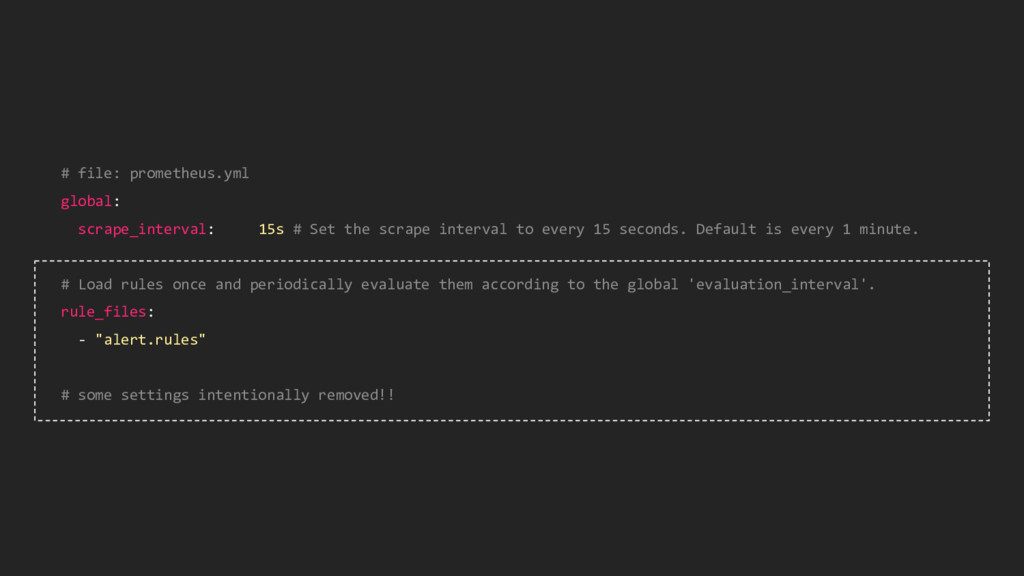
interval to every 15 seconds. Default is every 1 minute. # Load rules once and periodically evaluate them according to the global 'evaluation_interval'. rule_files: - "alert.rules" # some settings intentionally removed!!
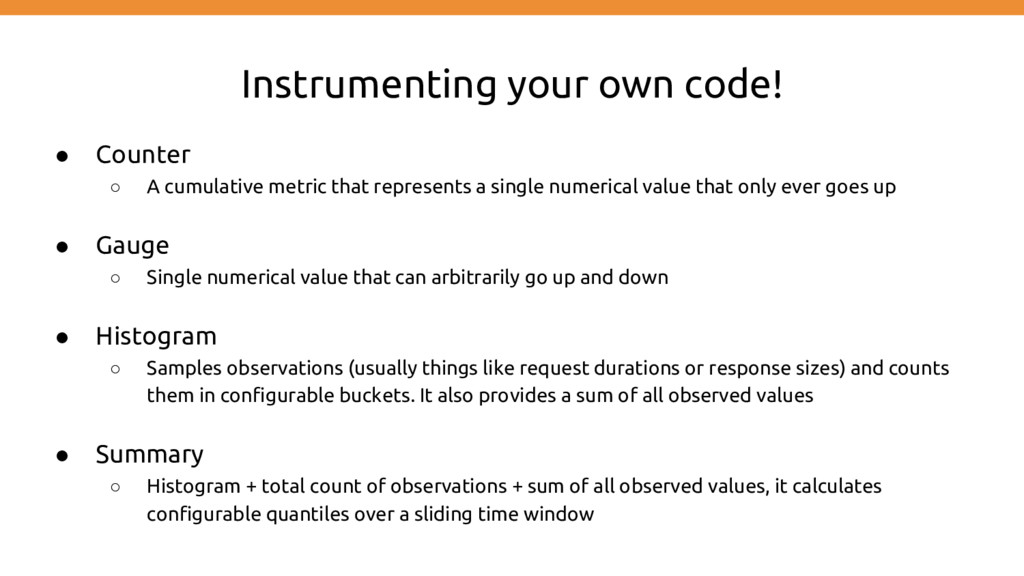
that represents a single numerical value that only ever goes up • Gauge ◦ Single numerical value that can arbitrarily go up and down • Histogram ◦ Samples observations (usually things like request durations or response sizes) and counts them in configurable buckets. It also provides a sum of all observed values • Summary ◦ Histogram + total count of observations + sum of all observed values, it calculates configurable quantiles over a sliding time window