Upgrade to Pro — share decks privately, control downloads, hide ads and more …

Rediculous easy centralized application logging & monitoring

Rediculous easy centralized application logging & monitoring

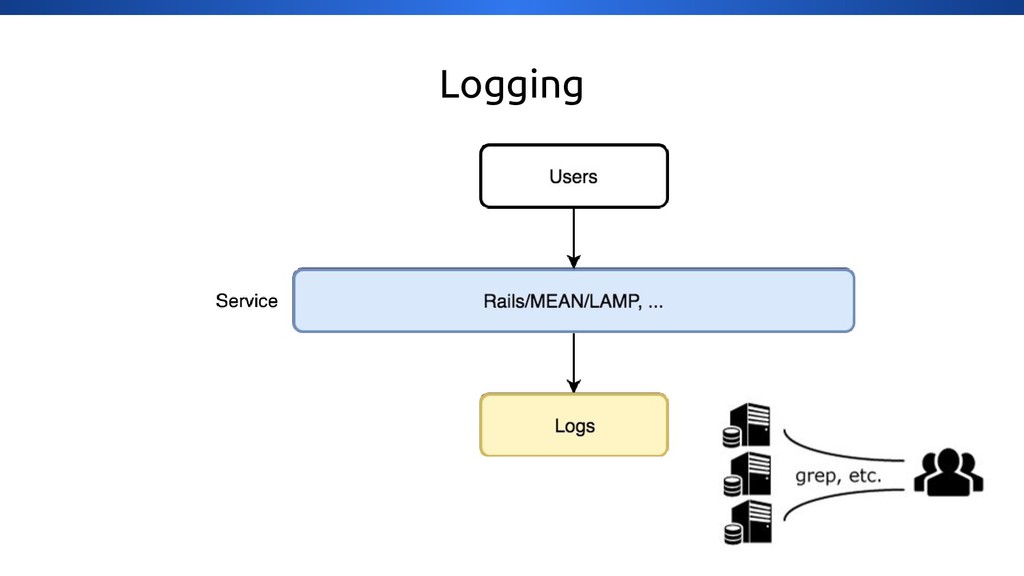
Finally you have managed to pack your application and are ready to deploy it onto your infrastructure. Ready to go!

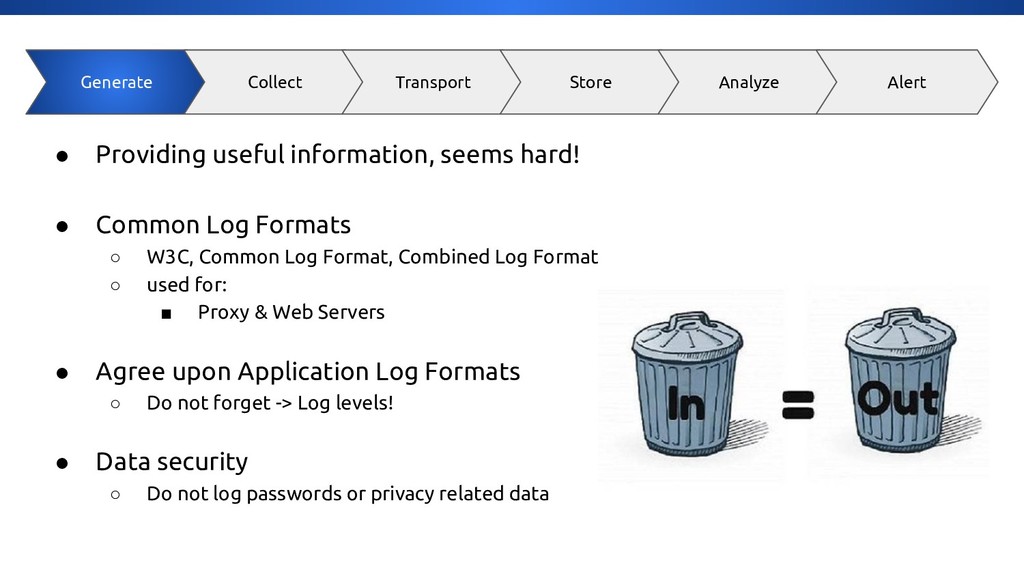
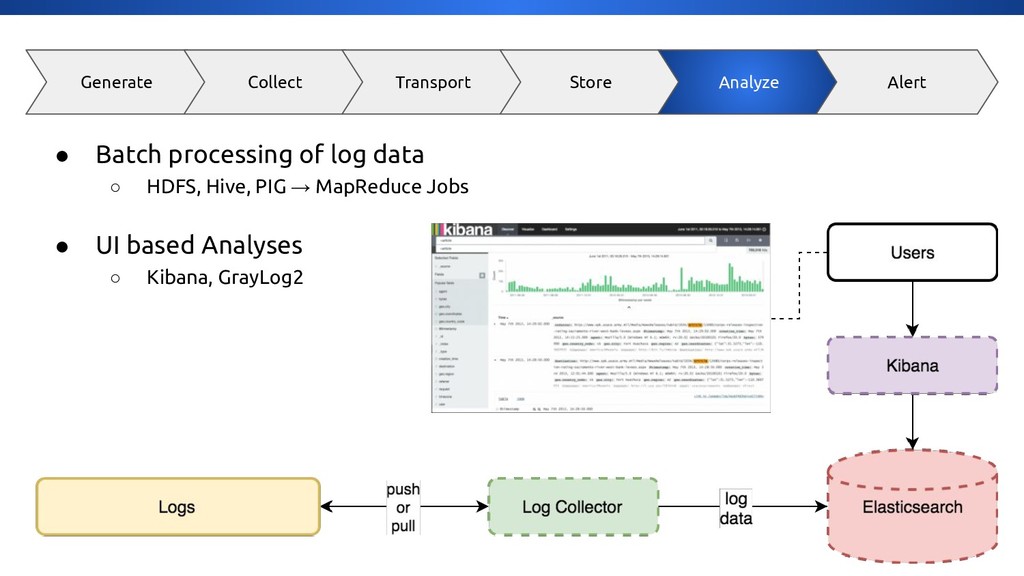
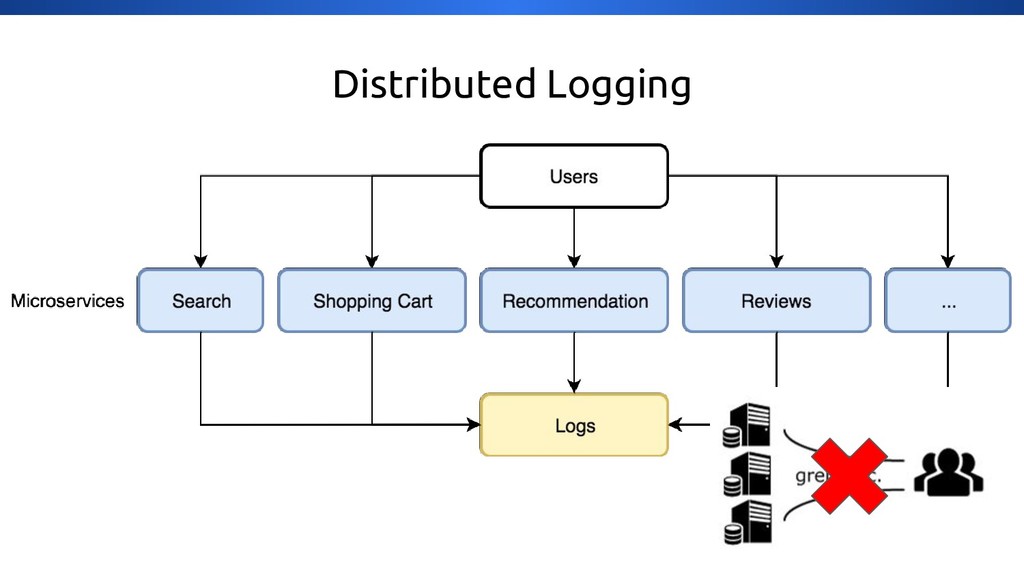
But wait, how do you deal with application logging & monitoring? No problem you will just send everything to a log file… think again! * how can you give that information to the operational department or even to your fellow engineers? * how to get monitoring metric data from your application and host operating system? * how to visualise visualise the information so it is easy to query? * how can you extract data from your logging data so its makes sense? * how do you alert on certain events that happened in your application?

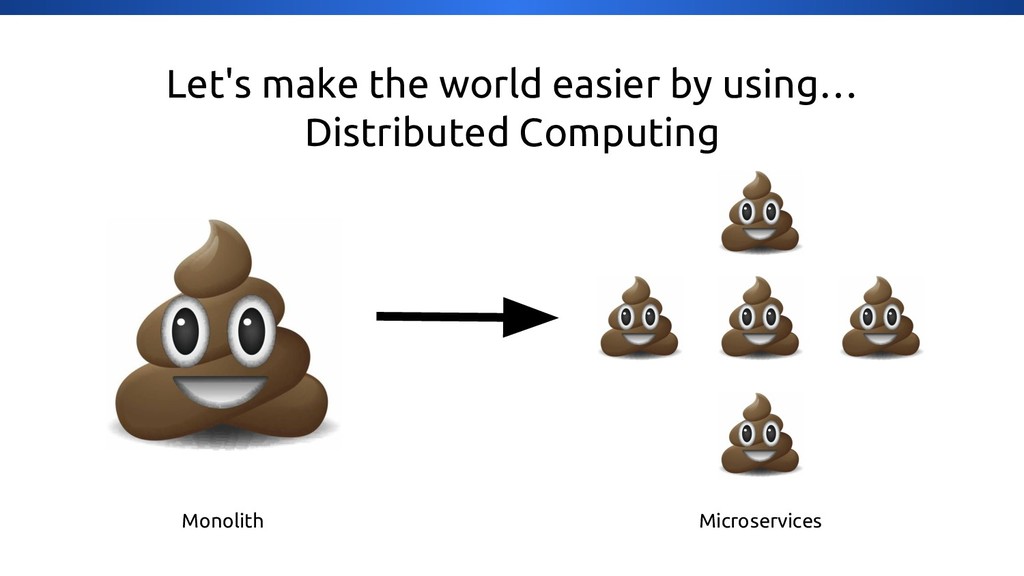
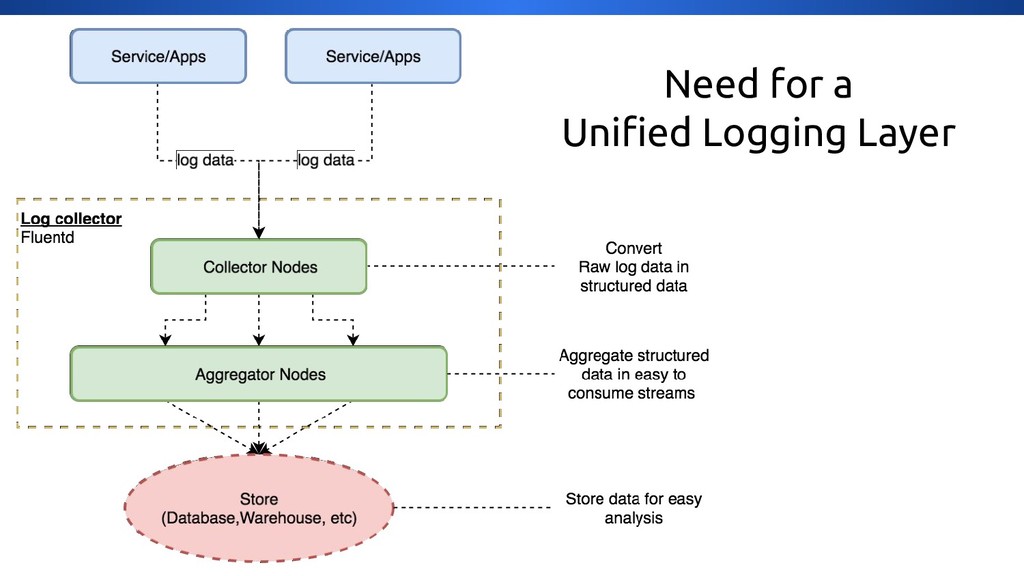
This hands on talk will give you an introduction on how easy it is to setup centralised logging & logging introducing Fluentd, Prometheus, ElasticSearch, Docker, Grafana. During the talk we will build an environment with the tools mentioned and deploy an application which you can monitor.

Marco Pas

May 31, 2018
Tweet

More Decks by Marco Pas

Other Decks in Programming

Transcript

  1. • Providing useful information, seems hard! • Common Log Formats

    ◦ W3C, Common Log Format, Combined Log Format ◦ used for: ▪ Proxy & Web Servers • Agree upon Application Log Formats ◦ Do not forget -> Log levels! • Data security ◦ Do not log passwords or privacy related data Generate Collect Transport Store Analyze Alert
  2. Some seriously useful log message :) • “No need to

    log, we know what is happening” • “Something happened not sure what” • “Empty log message” • “Lots of sh*t happing” • “It works b****” • “How did we end up here?” • “Okay i am getting tired of this error message” • “Does this work?” • “We hit a bug, still figuring out what” • “Call 911 we have a problem”
  3. • Syslog / Syslog-ng • Files -> multiple places (/var/log)

    ◦ Near real time replication to remote destinations • Stdout ◦ Normally goes to /dev/null Generate Collect Transport Store Analyze Alert In container based environments logging to “Stdout” has the preference
  4. • Specialized transporters and collectors available using frameworks like: ◦

    Logstash, Flume, Fluentd • Accumulate data coming from multiple hosts / services ◦ Multiple input sources • Optimized network traffic ◦ Pull / Push Generate Collect Transport Store Analyze Alert
  5. Generate Collect Transport Store Analyze Alert • Where should it

    be stored? ◦ Short vs Long term ◦ Associated costs ◦ Speed of data ingestion & retrieval ◦ Data access policies (who needs access) • Example storage options: ◦ S3, Glacier, Tape backup ◦ HDFS, Cassandra, MongoDB or ElasticSearch
  6. • Batch processing of log data ◦ HDFS, Hive, PIG

    → MapReduce Jobs • UI based Analyses ◦ Kibana, GrayLog2 Generate Collect Transport Store Analyze Alert
  7. • Based on patterns or “calculated” metrics → send out

    events ◦ Trigger alert and send notifications • Logging != Monitoring ◦ Logging -> recording to diagnose a system ◦ Monitoring -> observation, checking and recording Generate Collect Transport Store Analyze Alert http_requests_total{method="post",code="200"} 1027 1395066363000 127.0.0.1 - frank [10/Oct/2000:13:55:36 -0700] "GET /apache_pb.gif HTTP/1.0" 200 2326
  8. Fluentd • Open source log collector written in Ruby •

    Reliable, scalable and easy to extend ◦ Pluggable architecture ◦ Rubygem ecosystem for plugins • Reliable log forwarding
  9. Event structure • Tag ◦ Where an event comes from,

    used for message routing • Time ◦ When an event happens, Epoch time ◦ Parsed time coming from the datasource • Record ◦ Actual log content being a JSON object ◦ Internally MessagePack
  10. Event example 192.168.0.1 - - [28/Feb/2013:12:00:00 +0900] "GET / HTTP/1.1"

    200 777 tag:: apache.access # set by configuration time: 1362020400 # 28/Feb/2013:12:00:00 +0900 record: {"user":"-","method":"GET","code":200,"size":777,"host":"192.168.0.1","path":"/"}
  11. Configuration • Driven by a simple text based configuration file

    ◦ fluent.conf → Tell where the data comes from (input) → Tell fluentd what to do (output) → Event processing pipeline → Groups filter and output for internal routing <source><source/> <match></match> <filter></filter> source -> filter 1 -> ... -> filter N -> output <label></label>
  12. # receive events via HTTP <source> @type http port 9880

    </source> # read logs from a file <source> @type tail path /var/log/httpd.log format apache tag apache.access </source> # save access logs to MongoDB <match apache.access> @type mongo database apache collection log </match> # add a field to an event <filter myapp.access> @type record_transformer <record> host_param "#{Socket.gethostname}" </record> </filter>
  13. Our scary movie “The Happy Developer” • Let's push out

    features • I can demo so it works :) • It works with 1 user, so it will work with multiple • Don’t worry about performance we will just scale using multiple machines/processes • Logging is into place
  14. Logging “recording to diagnose a system” Monitoring “observation, checking and

    recording” http_requests_total{method="post",code="200"} 1027 1395066363000 127.0.0.1 - frank [10/Oct/2000:13:55:36 -0700] "GET /apache_pb.gif HTTP/1.0" 200 2326 Logging != Monitoring
  15. Why Monitoring? • Know when things go wrong ◦ Detection

    & Alerting • Be able to debug and gain insight • Detect changes over time and drive technical/business decisions • Feed into other systems/processes (e.g. security, automation)
  16. Houston we have Storage problem! Storage metric data metric data

    metric data metric data metric data metric data metric data metric data metric data How to store the mass amount of metrics and also making them easy to query?
  17. Time Series - Database • Time series data is a

    sequence of data points collected at regular intervals over a period of time. (metrics) ◦ Examples: ▪ Device data ▪ Weather data ▪ Stock prices ▪ Tide measurements ▪ Solar flare tracking • The data requires aggregation and analysis Time Series Database metric data • High write performance • Data compaction • Fast, easy range queries
  18. metric name and a set of key-value pairs, also known

    as labels <metric name>{<label name>=<label value>, ...} value [ timestamp ] http_requests_total{method="post",code="200"} 1027 1395066363000 Time Series - Data format
  19. Prometheus Prometheus is an open-source systems monitoring and alerting toolkit

    originally built at SoundCloud. It is now a standalone open source project and maintained independently of any company. https://prometheus.io Implemented using
  20. Prometheus Components • The main Prometheus server which scrapes and

    stores time series data • Client libraries for instrumenting application code • A push gateway for supporting short-lived jobs • Special-purpose exporters (for HAProxy, StatsD, Graphite, etc.) • An alertmanager • Various support tools
  21. List of Job Exporters • Prometheus managed: ◦ JMX ◦

    Node ◦ Graphite ◦ Blackbox ◦ SNMP ◦ HAProxy ◦ Consul ◦ Memcached ◦ AWS Cloudwatch ◦ InfluxDB ◦ StatsD ◦ ... • Custom ones: ◦ Database ◦ Hardware related ◦ Messaging systems ◦ Storage ◦ HTTP ◦ APIs ◦ Logging ◦ … https://prometheus.io/docs/instrumenting/exporters/