◦ Java, Groovy, Scala, Spring Boot, IOT, AWS, Terraform, Infrastructure • Enjoying the good things • Chef leuke dingen doen == “trying out cool and new stuff” • Currently involved in a big IOT project • Movie & Netflix addict
features • I can demo so it works :) • It works with 1 user, so it will work with multiple • Don’t worry about performance we will just scale using multiple machines/processes • Logging is into place
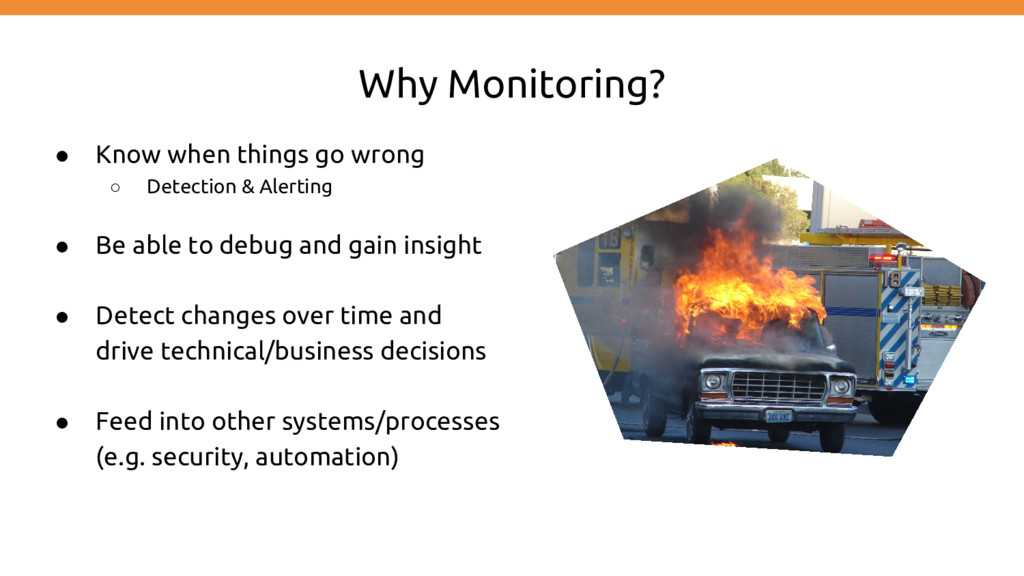
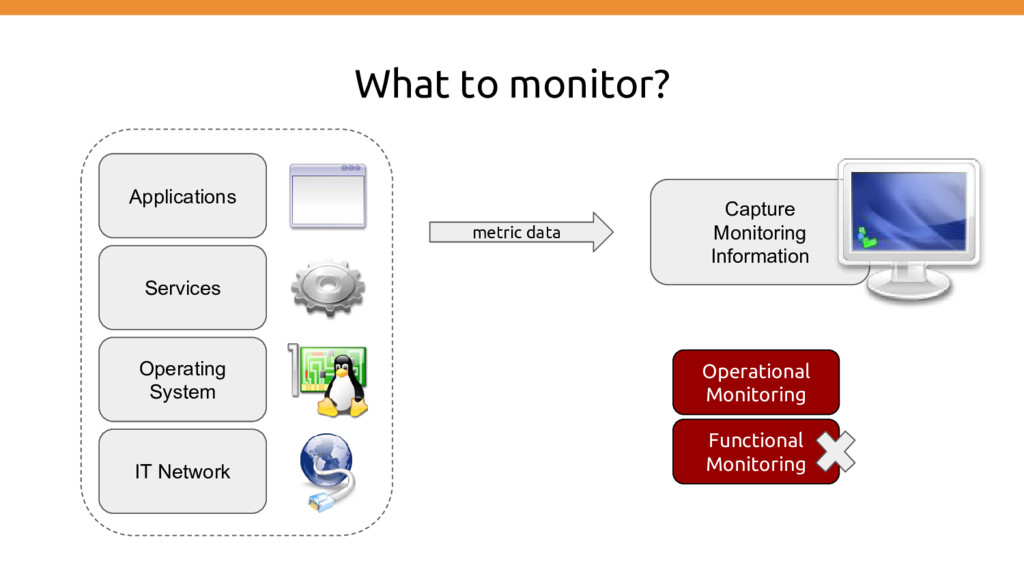
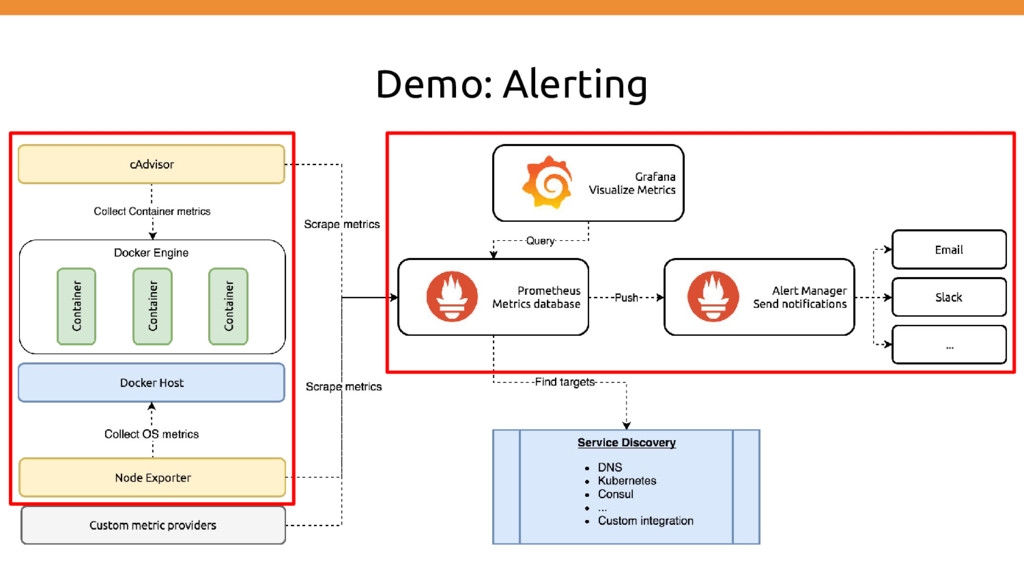
& Alerting • Be able to debug and gain insight • Detect changes over time and drive technical/business decisions • Feed into other systems/processes (e.g. security, automation)
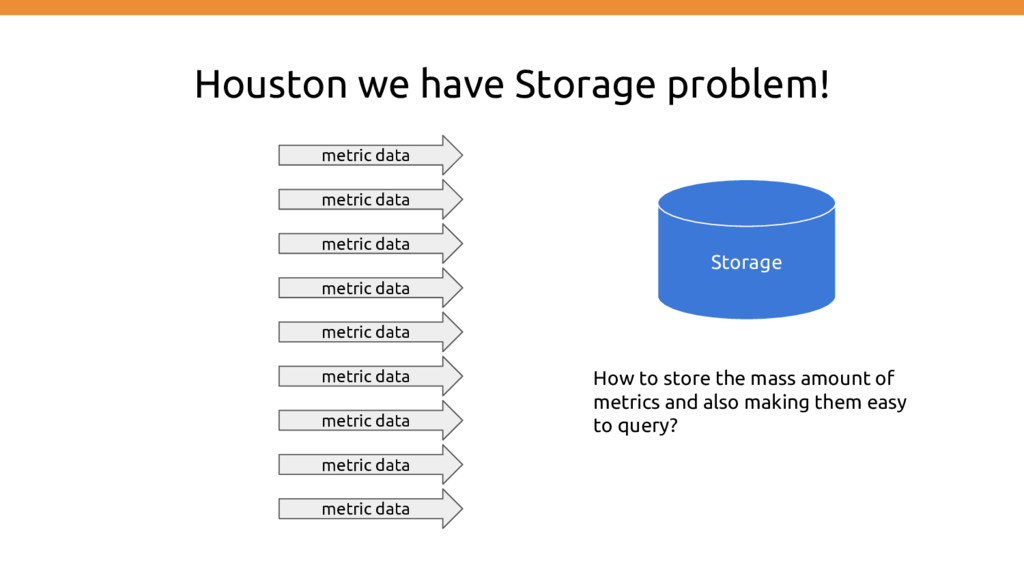
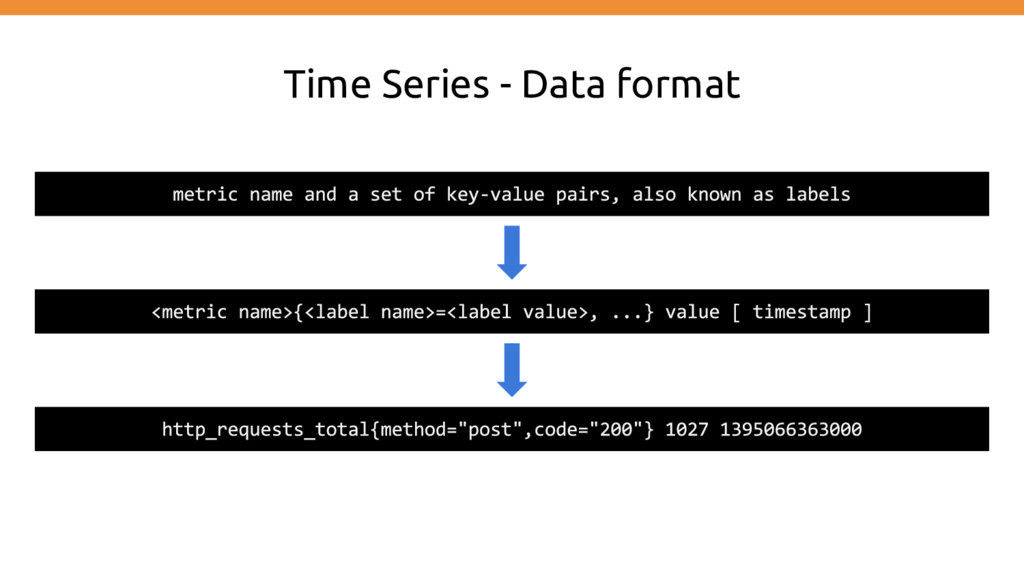
metric data metric data metric data metric data metric data metric data metric data How to store the mass amount of metrics and also making them easy to query?
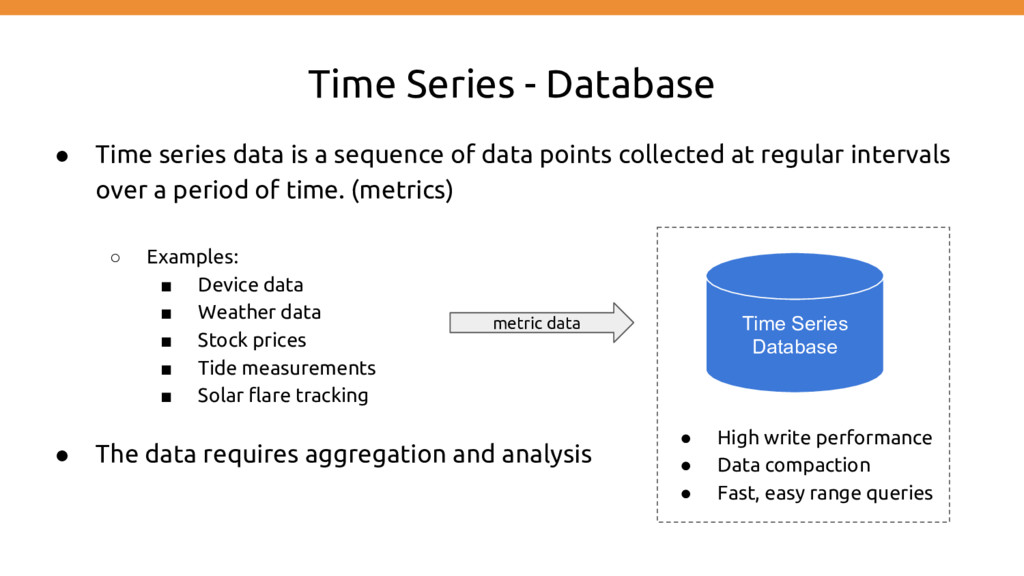
sequence of data points collected at regular intervals over a period of time. (metrics) ◦ Examples: ▪ Device data ▪ Weather data ▪ Stock prices ▪ Tide measurements ▪ Solar flare tracking • The data requires aggregation and analysis Time Series Database metric data • High write performance • Data compaction • Fast, easy range queries
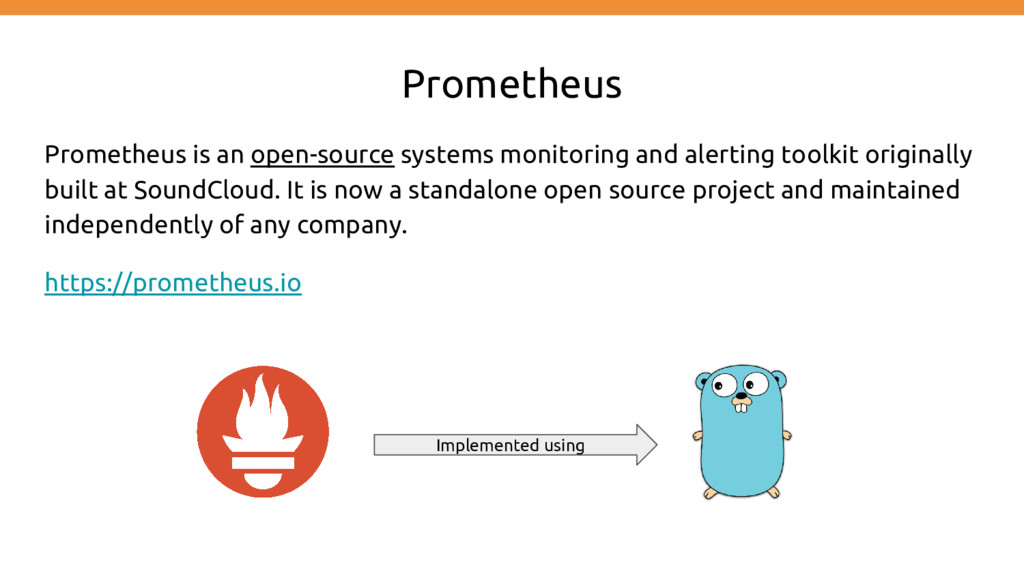
originally built at SoundCloud. It is now a standalone open source project and maintained independently of any company. https://prometheus.io Implemented using
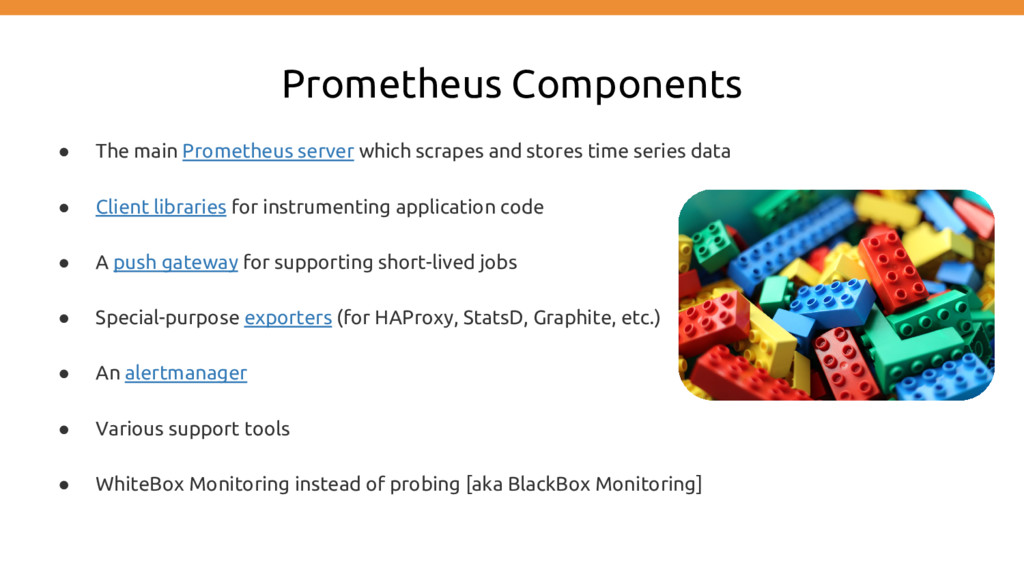
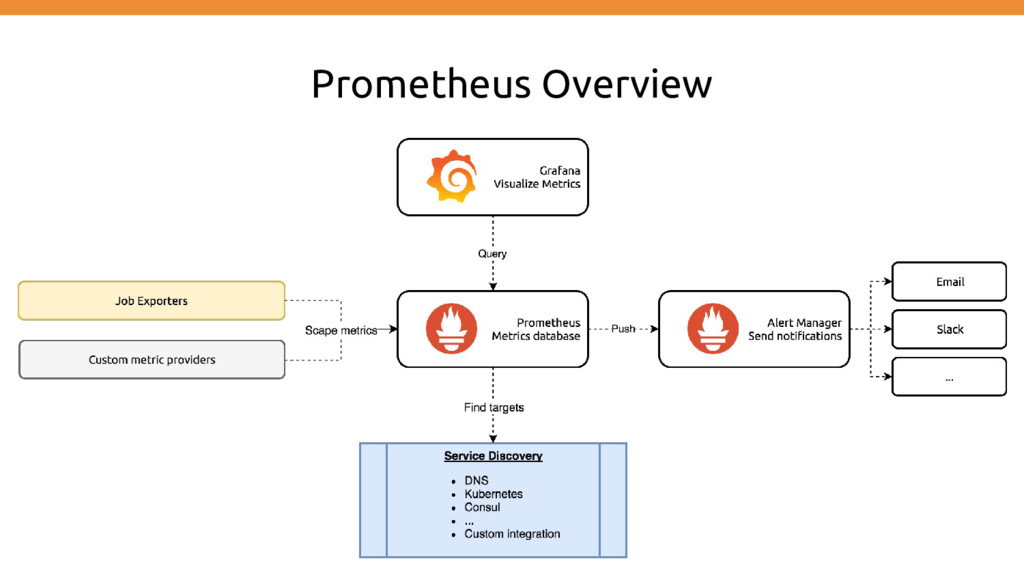
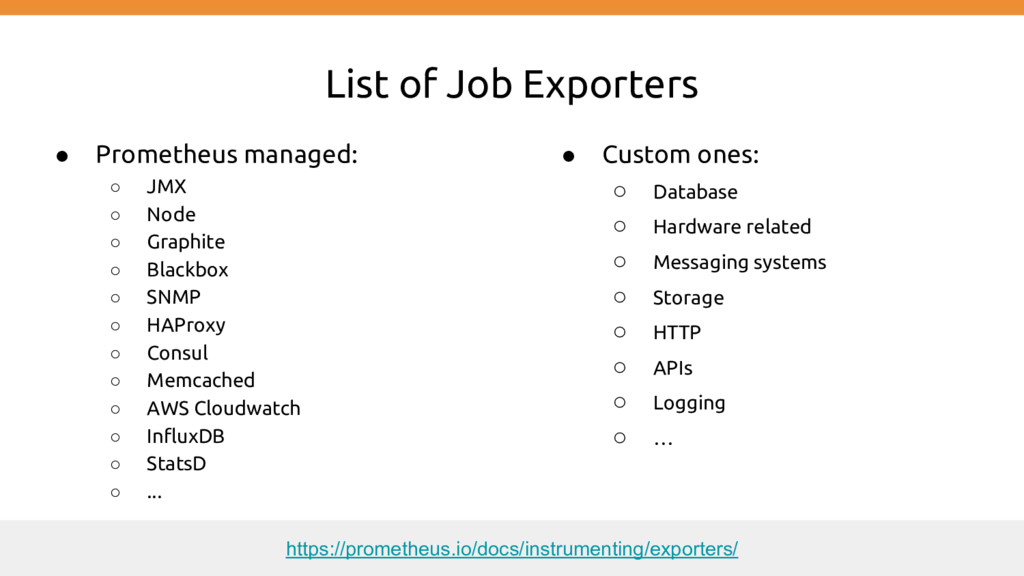
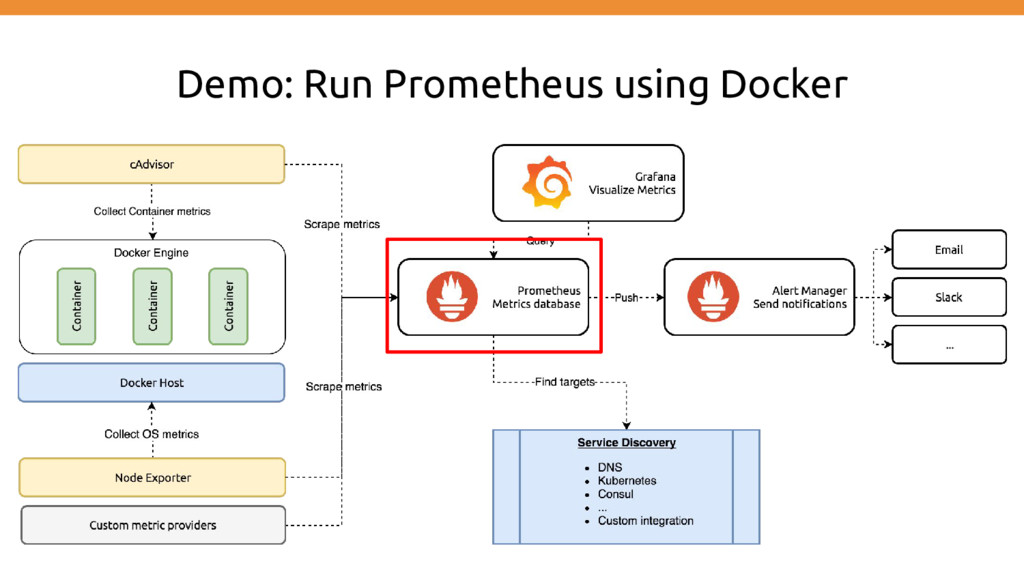
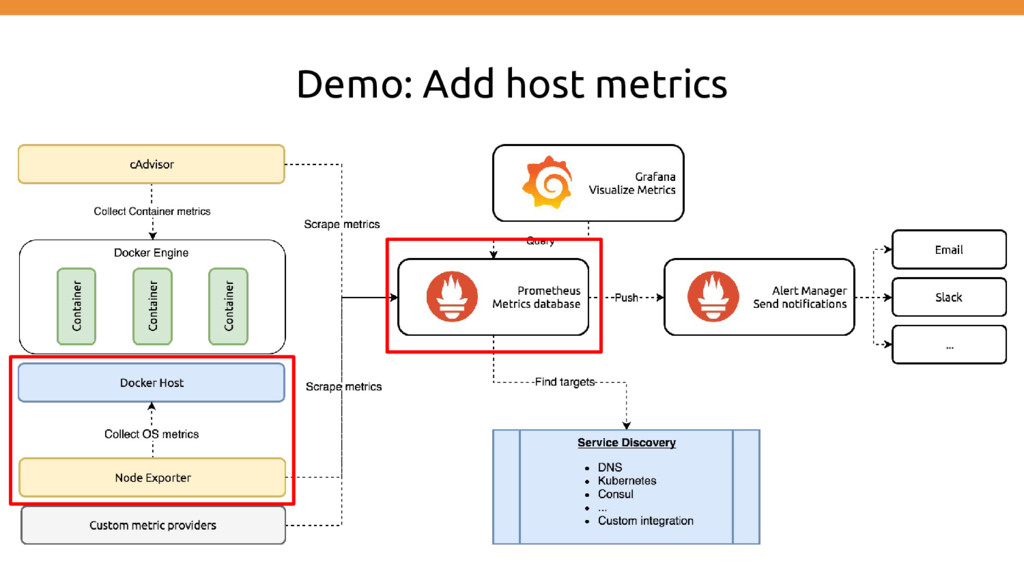
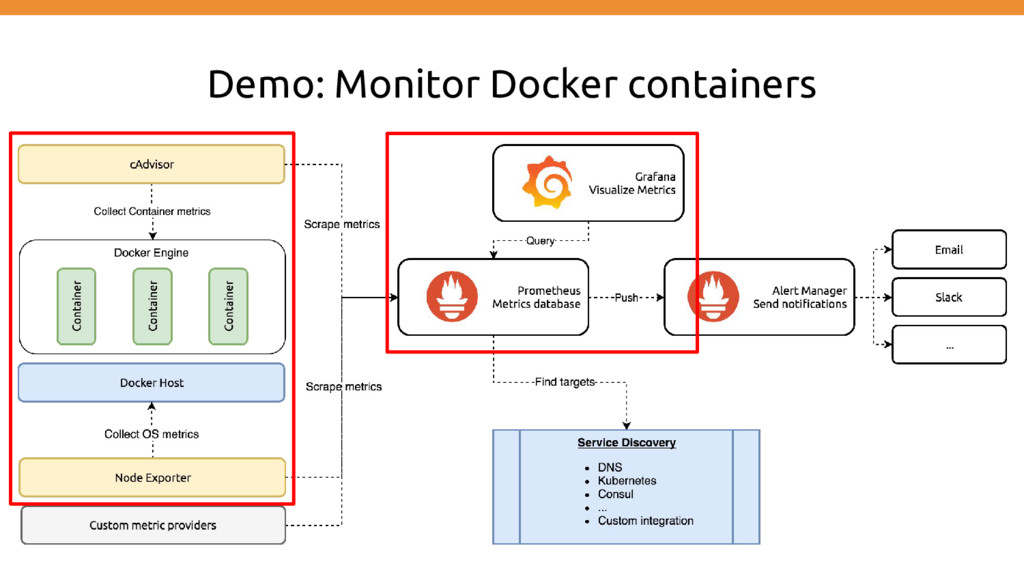
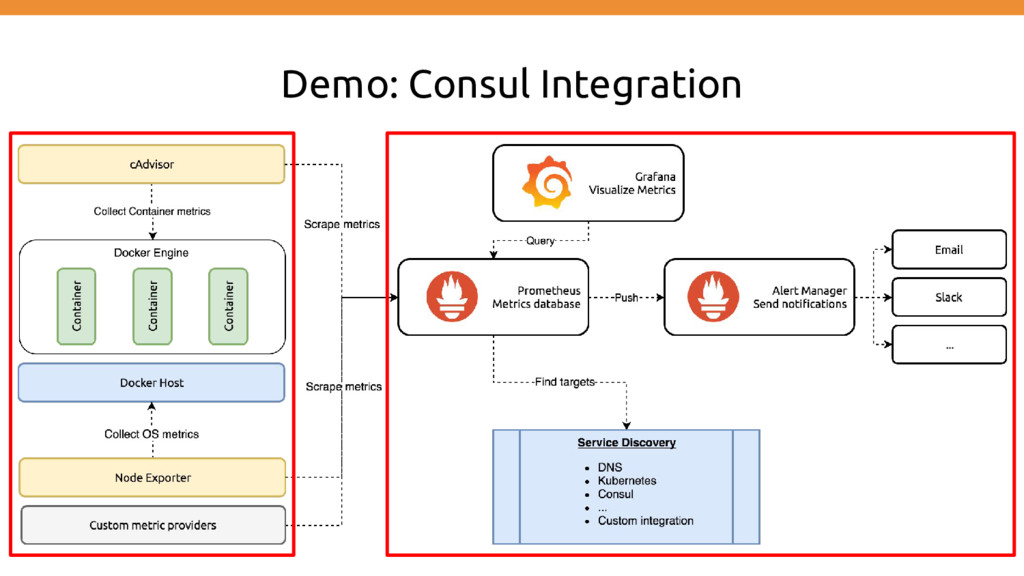
stores time series data • Client libraries for instrumenting application code • A push gateway for supporting short-lived jobs • Special-purpose exporters (for HAProxy, StatsD, Graphite, etc.) • An alertmanager • Various support tools • WhiteBox Monitoring instead of probing [aka BlackBox Monitoring]
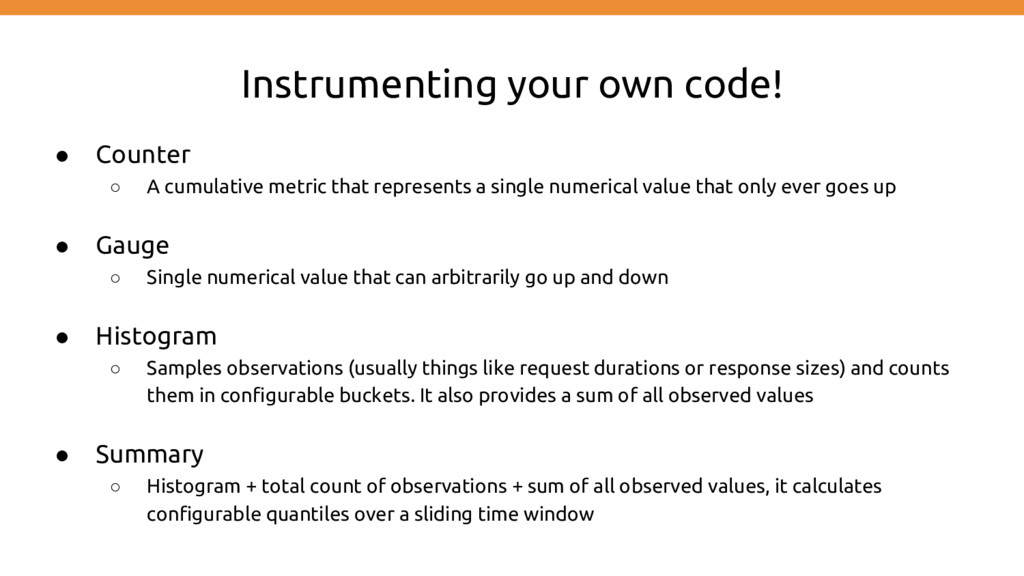
that represents a single numerical value that only ever goes up • Gauge ◦ Single numerical value that can arbitrarily go up and down • Histogram ◦ Samples observations (usually things like request durations or response sizes) and counts them in configurable buckets. It also provides a sum of all observed values • Summary ◦ Histogram + total count of observations + sum of all observed values, it calculates configurable quantiles over a sliding time window