◦ Java, Groovy, Scala, Spring Boot, IOT, AWS, Terraform, Infrastructure • Enjoying the good things • Chef leuke dingen doen == “trying out cool and new stuff” • Currently involved in a big IOT project • Wannabe chef, movie & Netflix addict
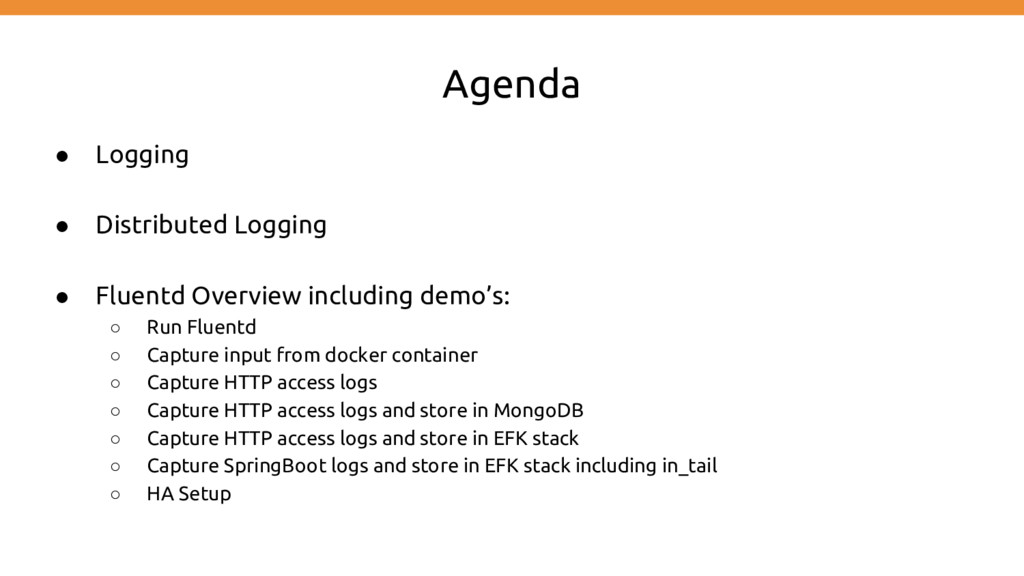
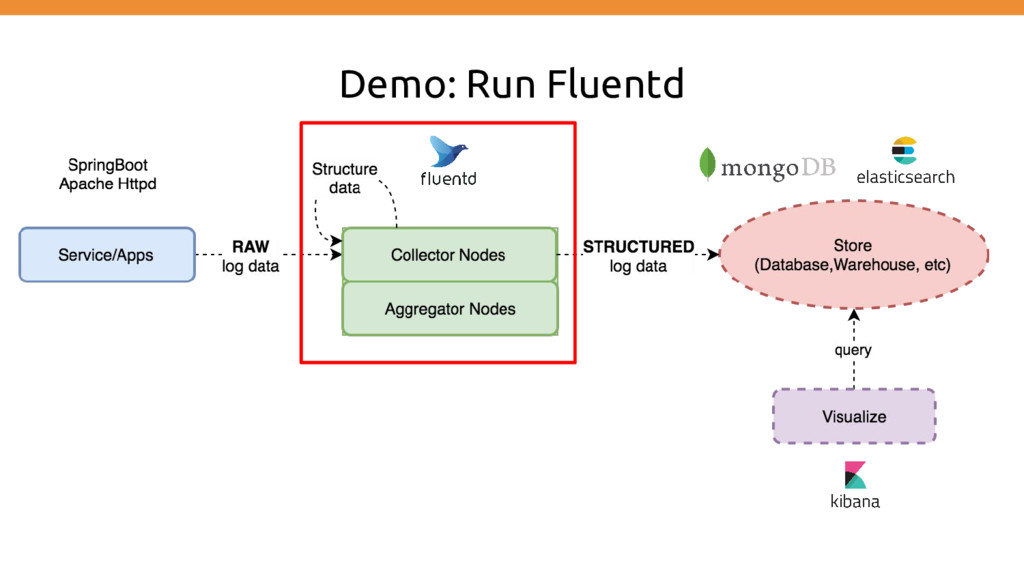
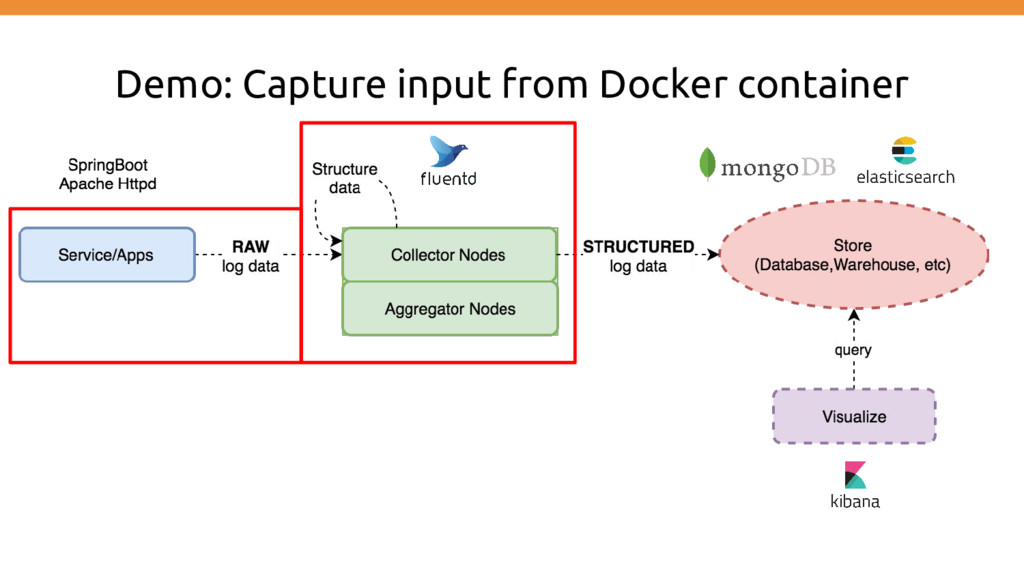
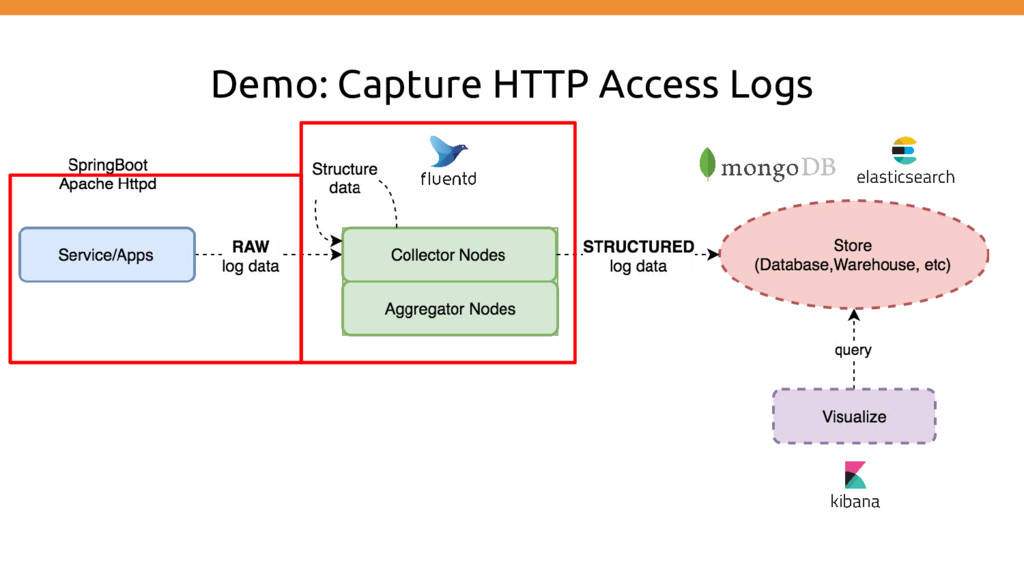
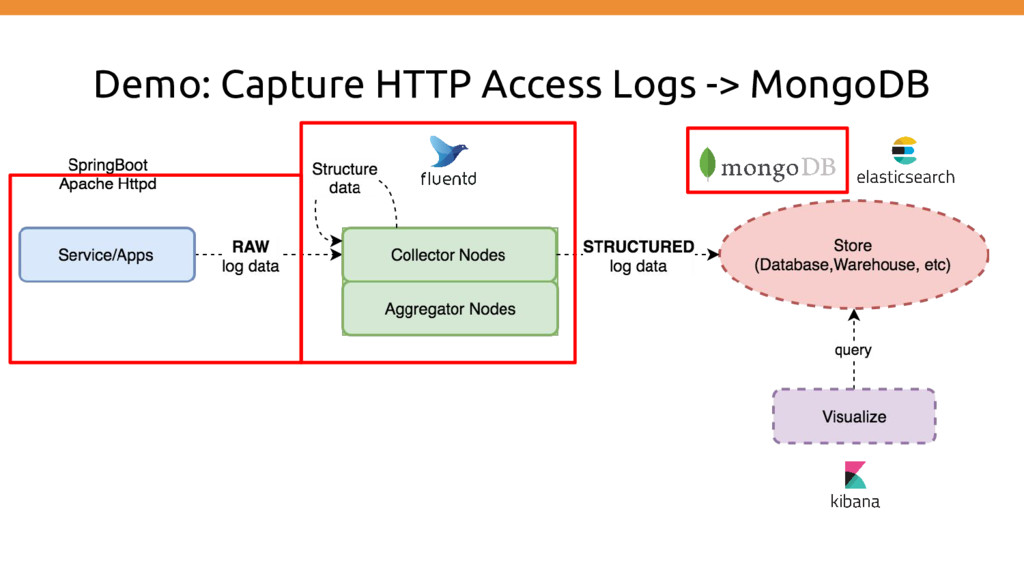
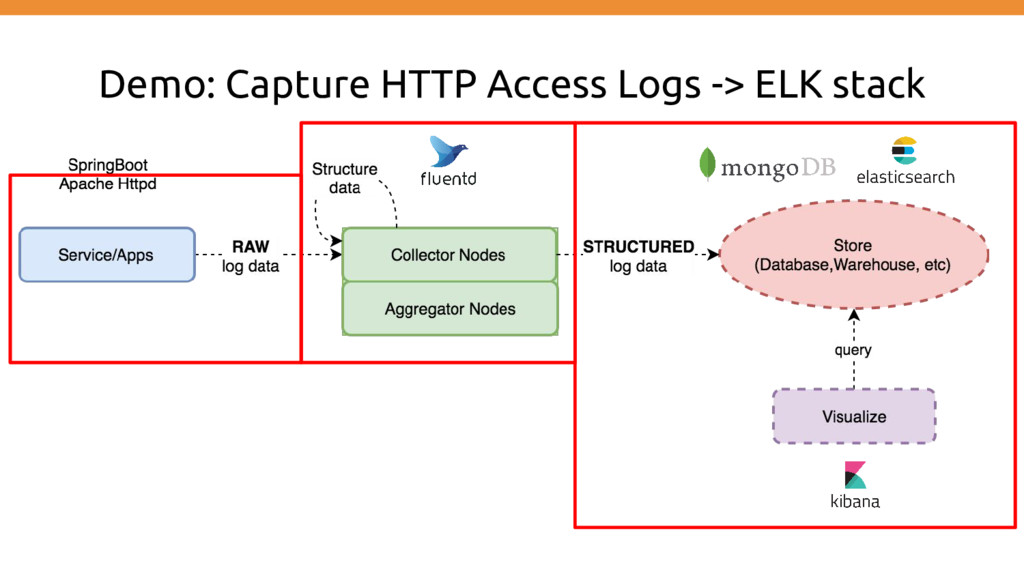
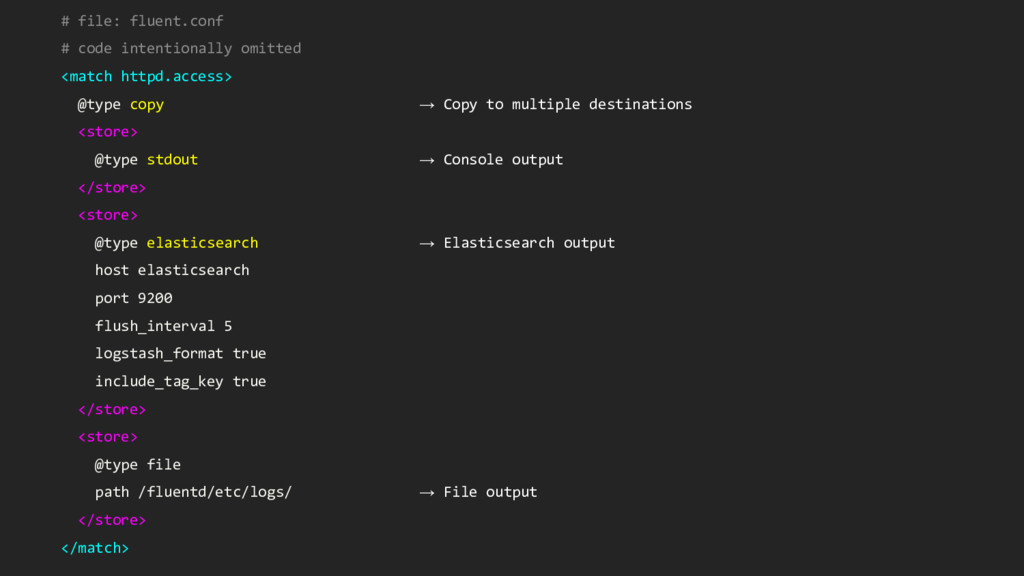
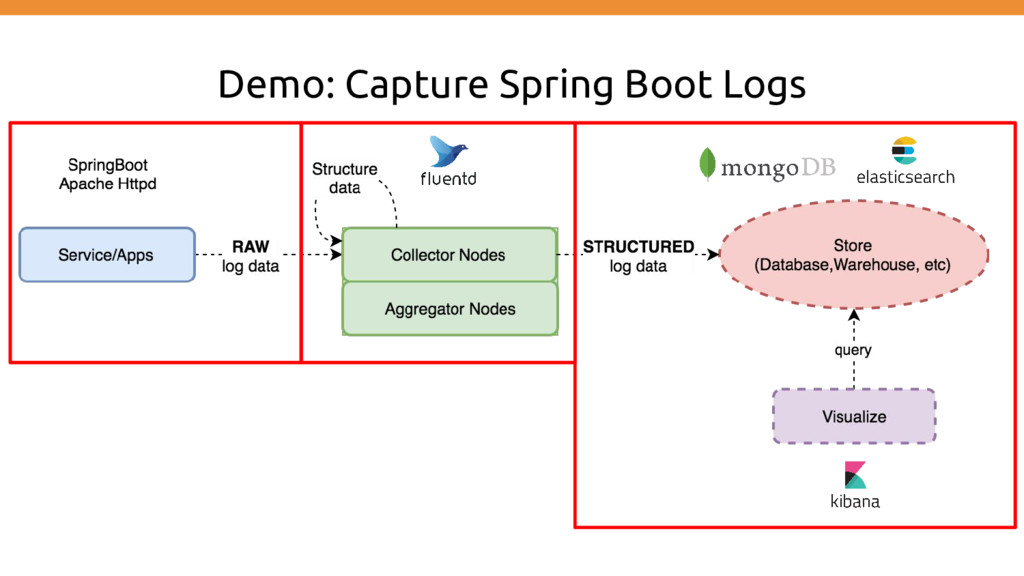
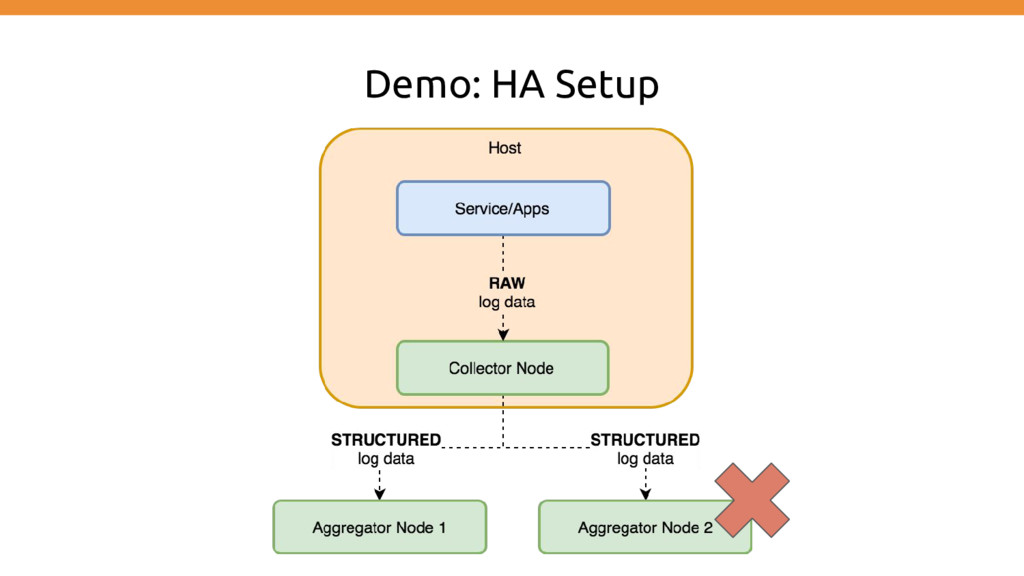
demo’s: ◦ Run Fluentd ◦ Capture input from docker container ◦ Capture HTTP access logs ◦ Capture HTTP access logs and store in MongoDB ◦ Capture HTTP access logs and store in EFK stack ◦ Capture SpringBoot logs and store in EFK stack including in_tail ◦ HA Setup
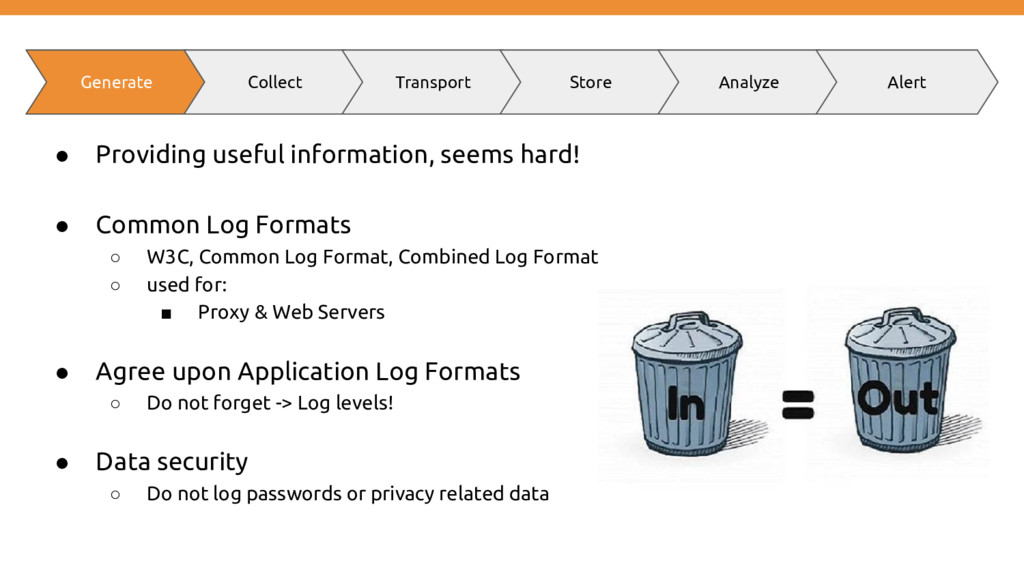
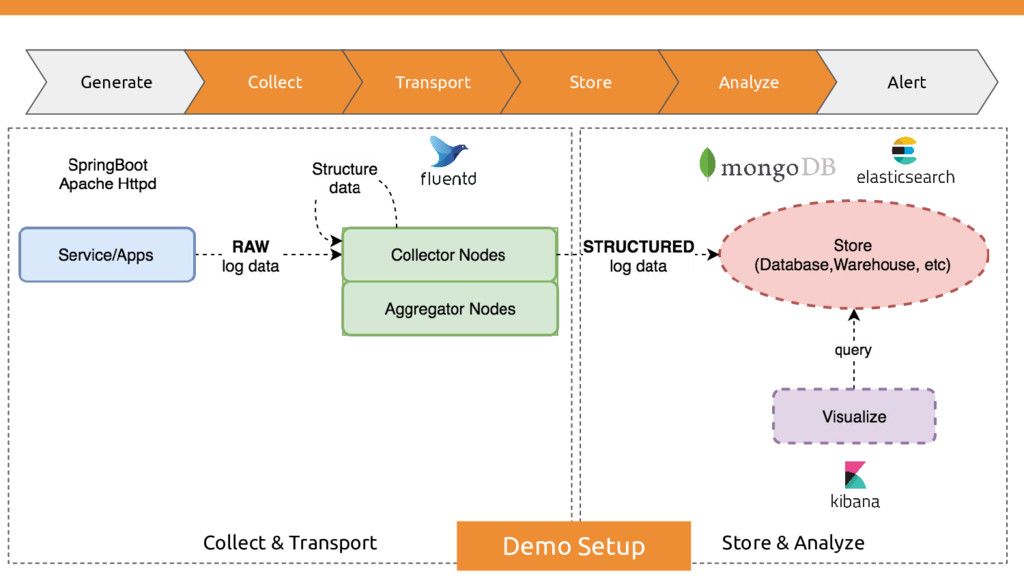
◦ W3C, Common Log Format, Combined Log Format ◦ used for: ▪ Proxy & Web Servers • Agree upon Application Log Formats ◦ Do not forget -> Log levels! • Data security ◦ Do not log passwords or privacy related data Generate Collect Transport Store Analyze Alert
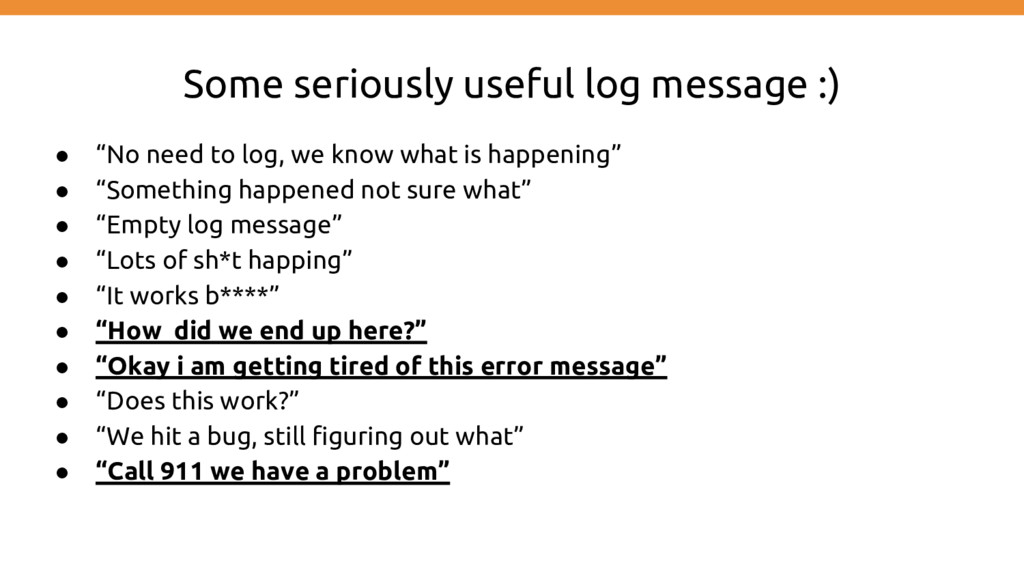
log, we know what is happening” • “Something happened not sure what” • “Empty log message” • “Lots of sh*t happing” • “It works b****” • “How did we end up here?” • “Okay i am getting tired of this error message” • “Does this work?” • “We hit a bug, still figuring out what” • “Call 911 we have a problem”
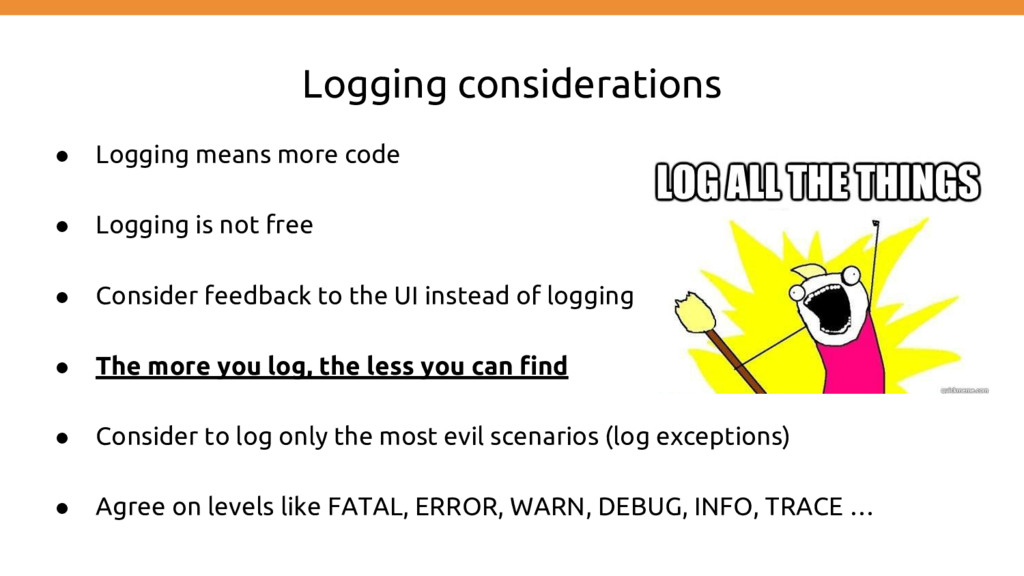
not free • Consider feedback to the UI instead of logging • The more you log, the less you can find • Consider to log only the most evil scenarios (log exceptions) • Agree on levels like FATAL, ERROR, WARN, DEBUG, INFO, TRACE …
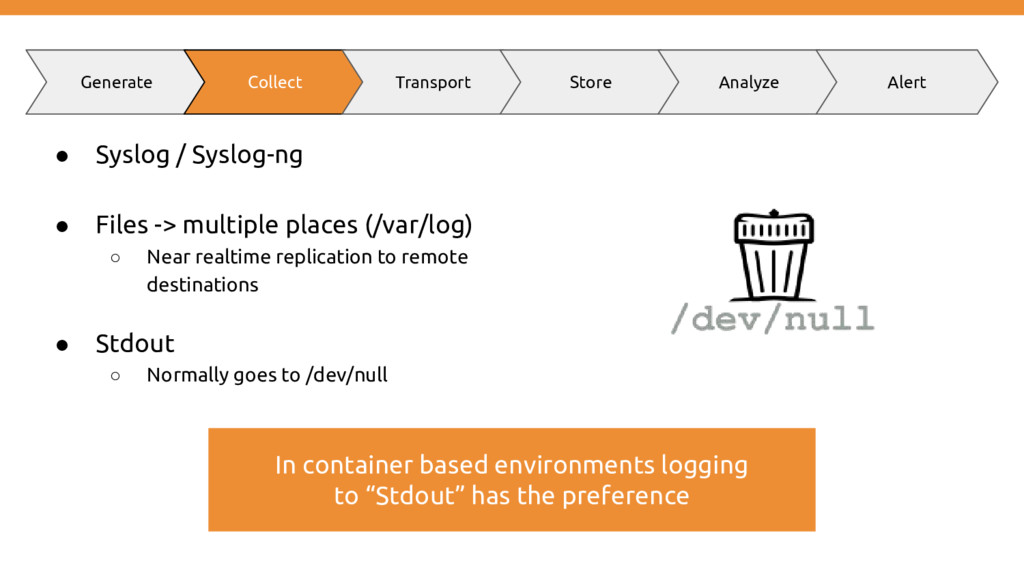
◦ Near realtime replication to remote destinations • Stdout ◦ Normally goes to /dev/null Generate Collect Transport Store Analyze Alert In container based environments logging to “Stdout” has the preference
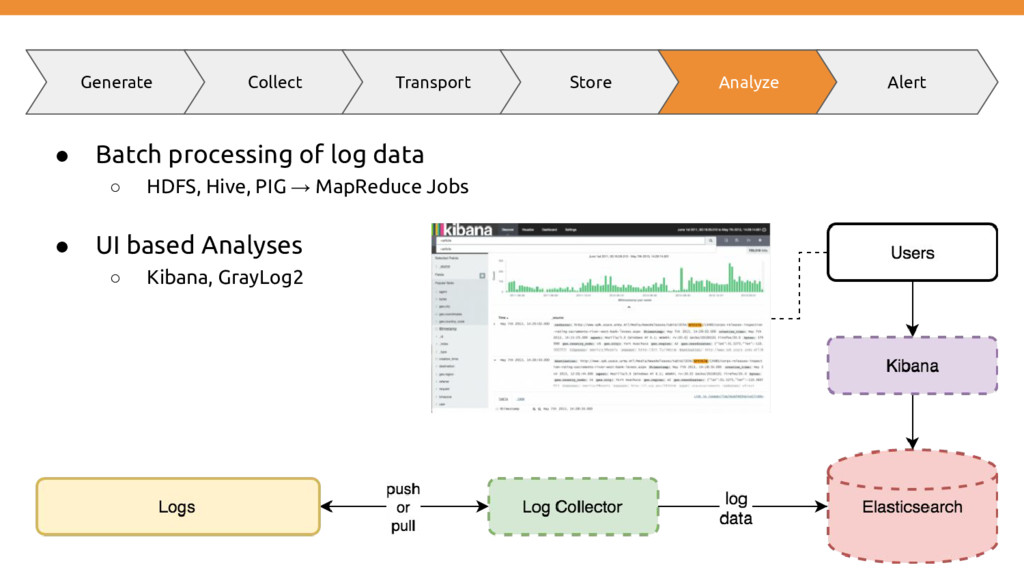
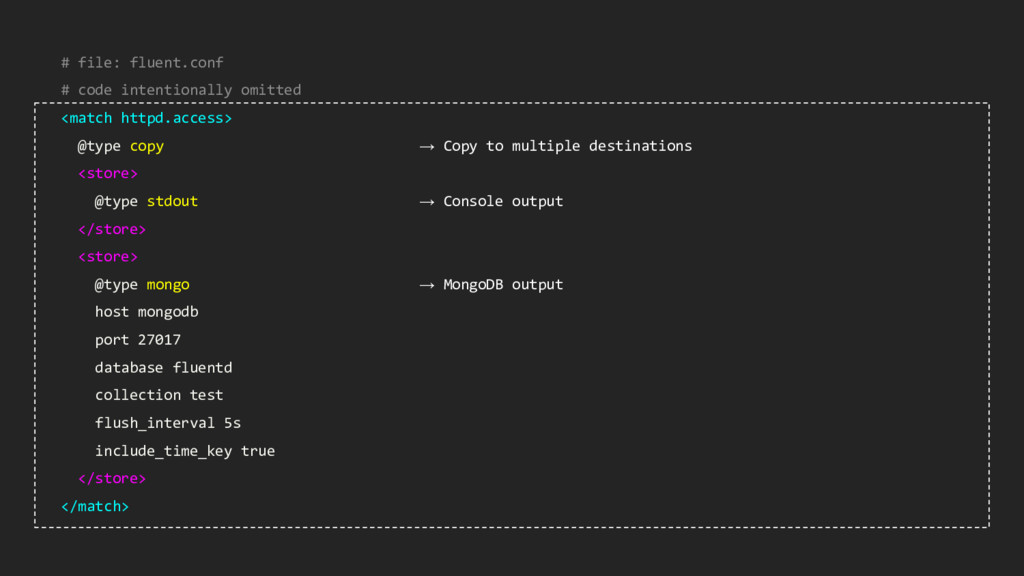
be stored? ◦ Short vs Long term ◦ Associated costs ◦ Speed of data ingestion & retrieval ◦ Data access policies (who needs access) • Example storage options: ◦ S3, Glacier, Tape backup ◦ HDFS, Cassandra, MongoDB or ElasticSearch
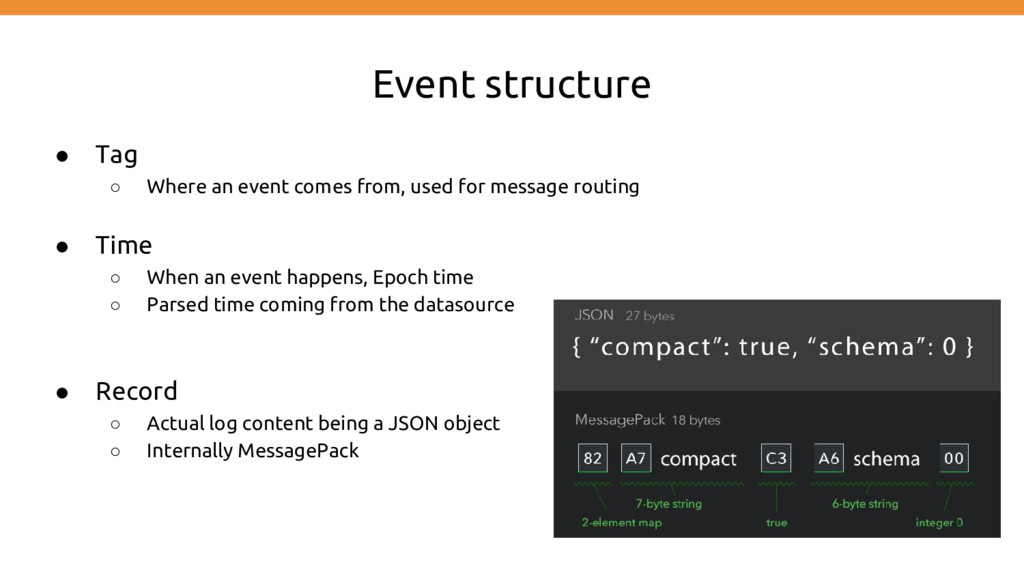
used for message routing • Time ◦ When an event happens, Epoch time ◦ Parsed time coming from the datasource • Record ◦ Actual log content being a JSON object ◦ Internally MessagePack
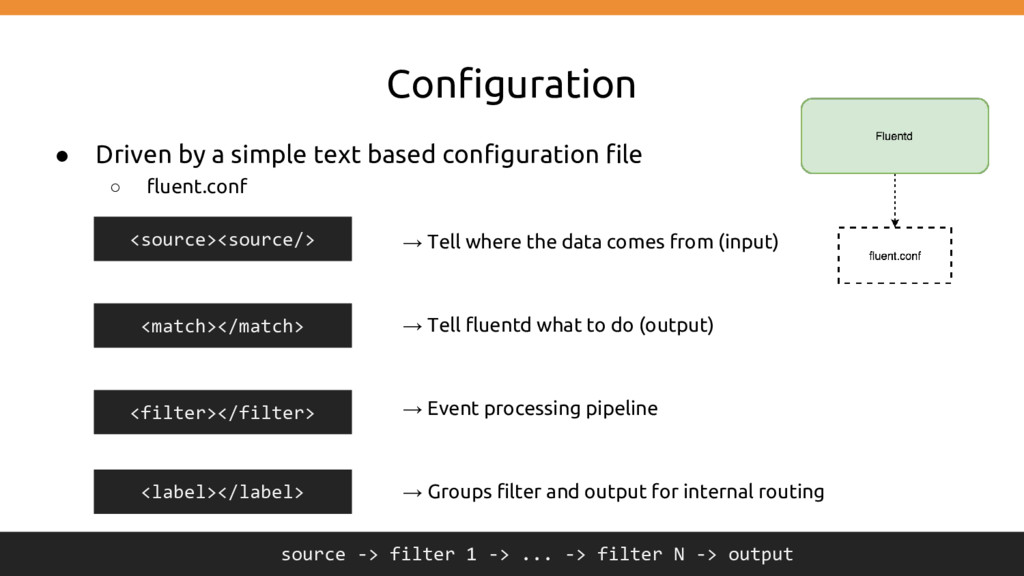
◦ fluent.conf → Tell where the data comes from (input) → Tell fluentd what to do (output) → Event processing pipeline → Groups filter and output for internal routing <source><source/> <match></match> <filter></filter> source -> filter 1 -> ... -> filter N -> output <label></label>
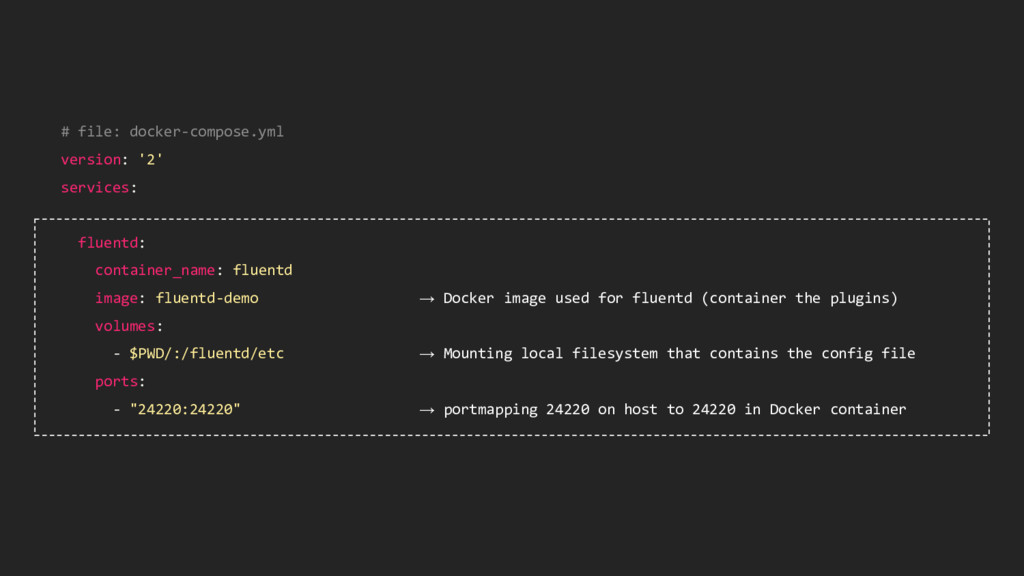
fluentd-demo → Docker image used for fluentd (container the plugins) volumes: - $PWD/:/fluentd/etc → Mounting local filesystem that contains the config file ports: - "24220:24220" → portmapping 24220 on host to 24220 in Docker container
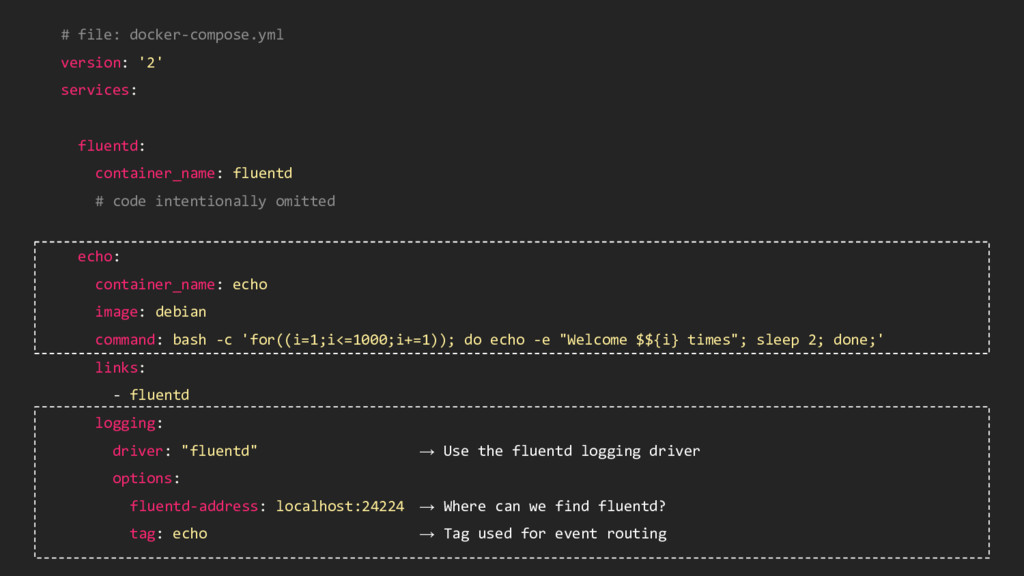
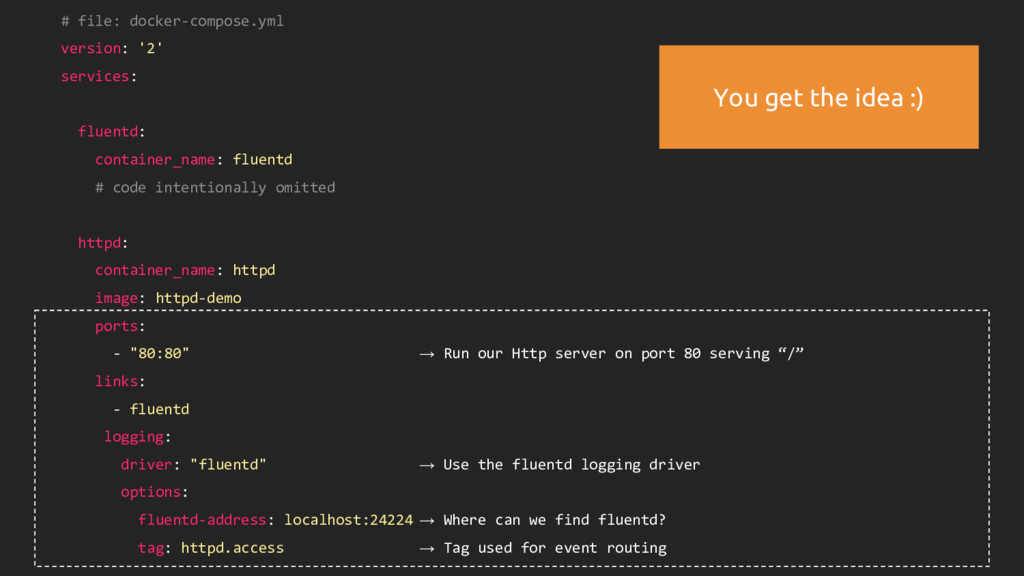
code intentionally omitted httpd: container_name: httpd image: httpd-demo ports: - "80:80" → Run our Http server on port 80 serving “/” links: - fluentd logging: driver: "fluentd" → Use the fluentd logging driver options: fluentd-address: localhost:24224 → Where can we find fluentd? tag: httpd.access → Tag used for event routing You get the idea :)
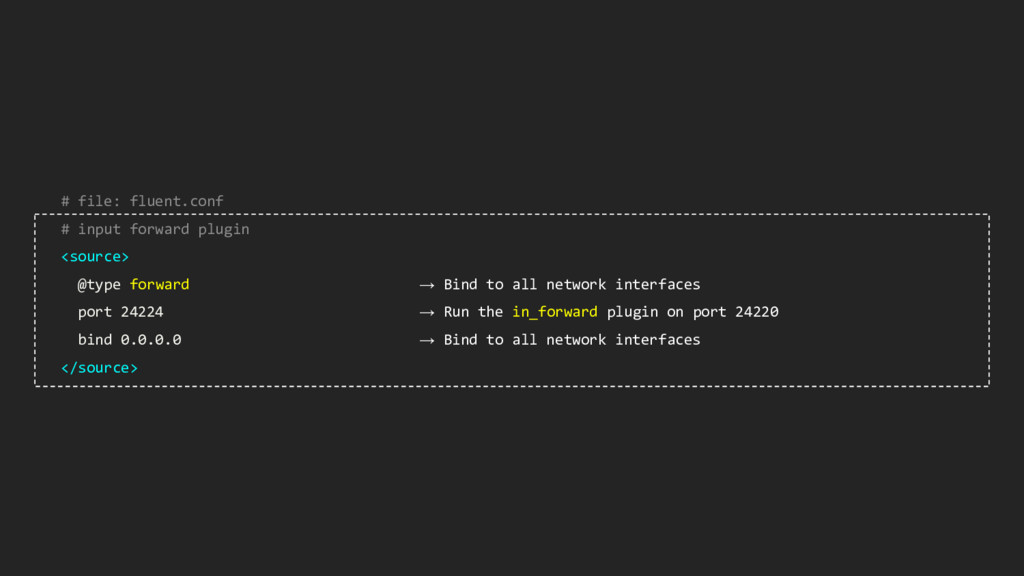
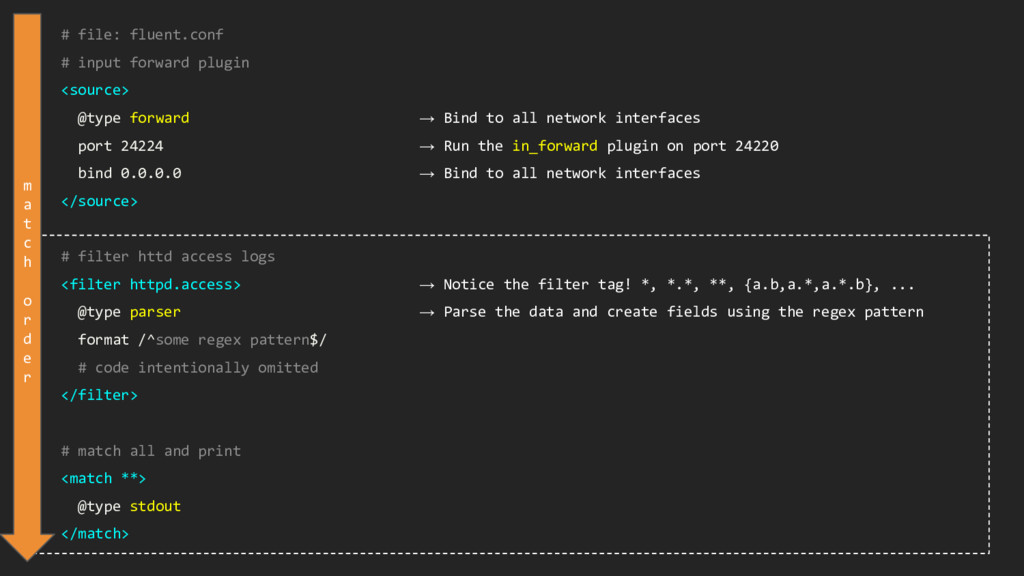
→ Bind to all network interfaces port 24224 → Run the in_forward plugin on port 24220 bind 0.0.0.0 → Bind to all network interfaces </source> # filter httd access logs <filter httpd.access> → Notice the filter tag! *, *.*, **, {a.b,a.*,a.*.b}, ... @type parser → Parse the data and create fields using the regex pattern format /^some regex pattern$/ # code intentionally omitted </filter> # match all and print <match **> @type stdout </match> m a t c h o r d e r
![Event example 192.168.0.1 - - [28/Feb/2013:12:00:00 +0900] "GET / HTTP/1.1"](https://files.speakerdeck.com/presentations/d8fb09d4bb944a3788ad8c718bd40e65/slide_23.jpg)