Upgrade to Pro — share decks privately, control downloads, hide ads and more …

Intro to Causal Modeling

Avatar for Munich DataGeeks Munich DataGeeks
June 30, 2016
160

Intro to Causal Modeling

Avatar for Munich DataGeeks

Munich DataGeeks

June 30, 2016
Tweet

More Decks by Munich DataGeeks

Transcript

  1. 2 TABLE OF CONTENTS Motivation Correlation is not causation Paradox

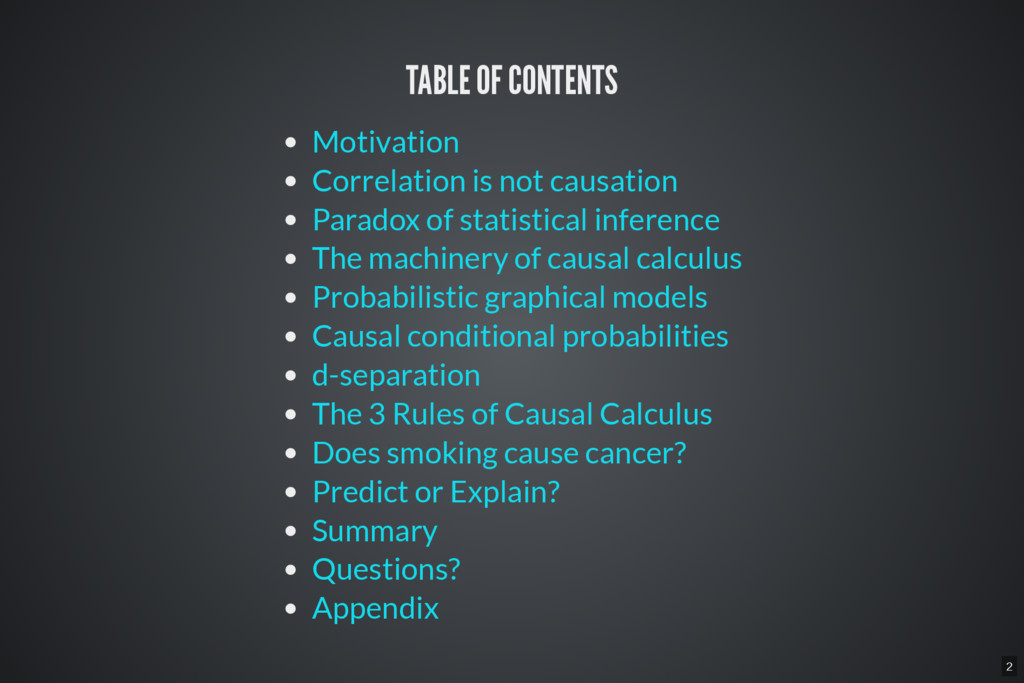
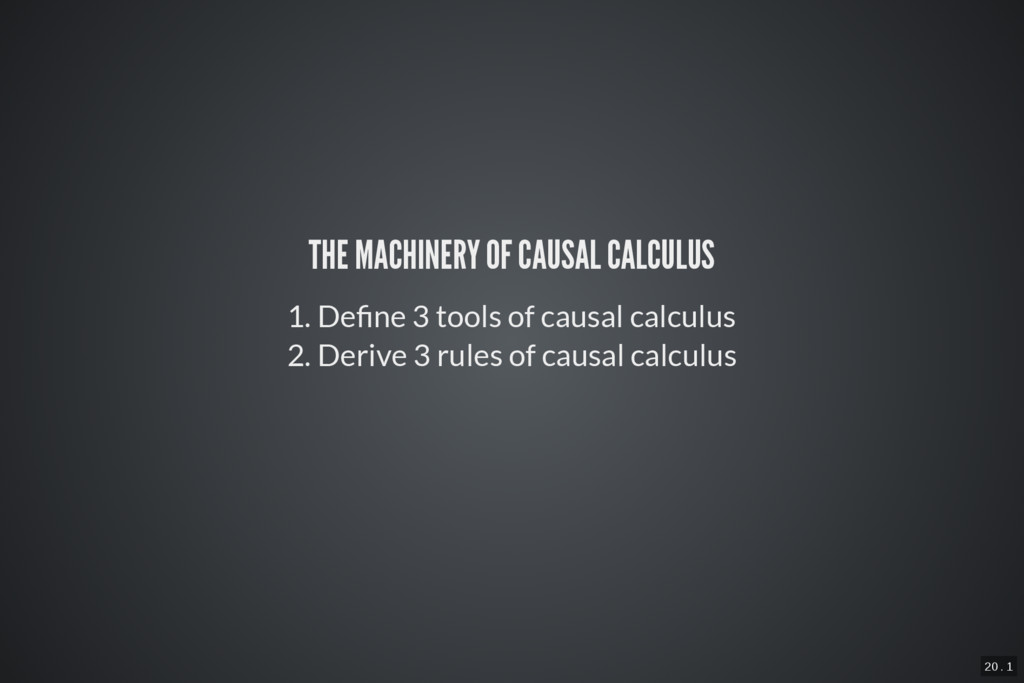
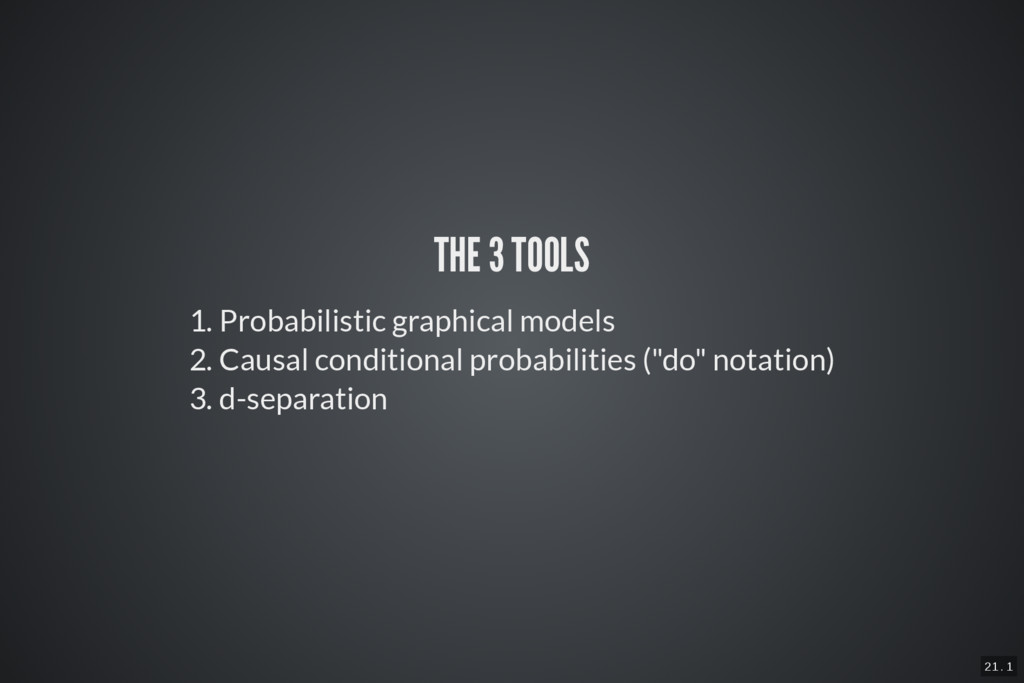
    of statistical inference The machinery of causal calculus Probabilistic graphical models Causal conditional probabilities d-separation The 3 Rules of Causal Calculus Does smoking cause cancer? Predict or Explain? Summary Questions? Appendix
  2. 9 . 1 DOES CORRELATION IMPLY CAUSATION? A causes B

    B causes A Correlation by random chance or selection bias A and B are caused by C
  3. 11 . 1 THE PARADOX Statistics can tell you ,

    p(disease|symptom) but never that symptoms do not cause disease.
  4. 12 . 1 THE PARADOX There are thousands of people

    paid to nd causal relationships and all they can deliver are correlations! – Judea Pearl (paraphrased)
  5. 14 . 1 IT MATTERS A LOT! Better overall: Treatment

    B Better for small stones: Treatment A Better for large stones: Treatment A
  6. 18 . 1 THE PROBLEM WITH RCTS 1. Can address

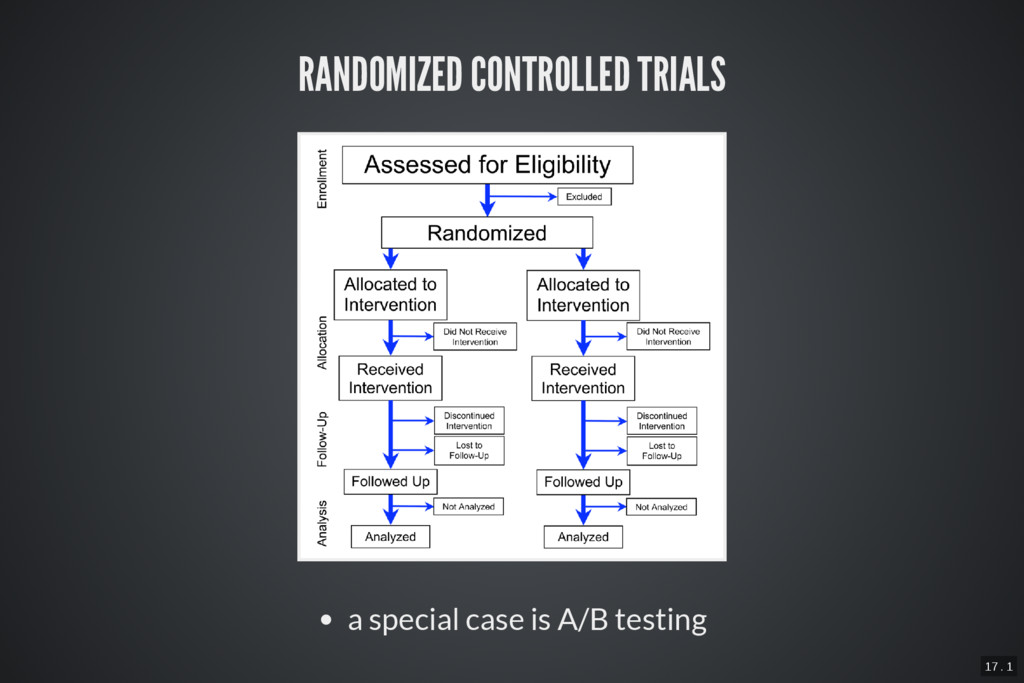
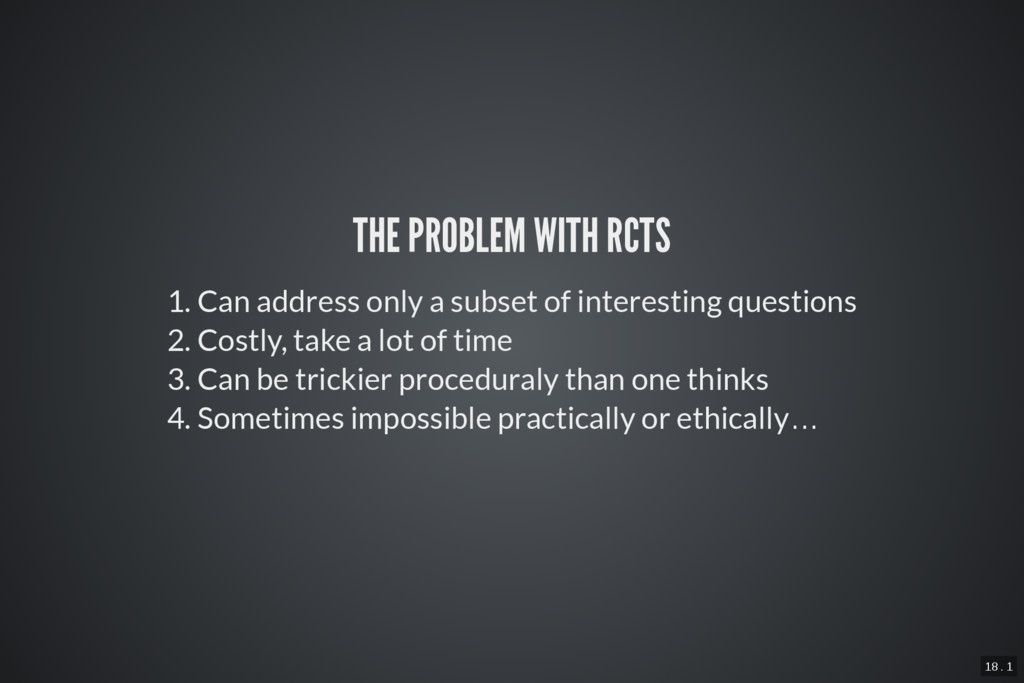
    only a subset of interesting questions 2. Costly, take a lot of time 3. Can be trickier proceduraly than one thinks 4. Sometimes impossible practically or ethically…
  7. 19 . 1 PROMISE OF CAUSAL MODELLING Given a data

    set, it is possible to constrain certain causal relationships. We can tell the effect of real-world interventions without actually doing them.
  8. 20 . 1 THE MACHINERY OF CAUSAL CALCULUS 1. De

    ne 3 tools of causal calculus 2. Derive 3 rules of causal calculus
  9. 21 . 1 THE 3 TOOLS 1. Probabilistic graphical models

    2. Causal conditional probabilities ("do" notation) 3. d-separation
  10. 23 . 1 JOINT PROBABILITY DISTRIBUTION As a good Bayesian,

    I'll just write down the full joint probability distribution of the model. p( , …, , …, ) x 1 x j x n
  11. 25 . 1 JOINT PROBABILITY DISTRIBUTION Smoking Tar Cancer %

    T T T .000162 T T F .0000085 T F T .0151 T F F .00168 F T T .0078 F T F .002 F F T .00097 F F F .972
  12. 26 . 1 PROBLEM: SCALING Joint probability functions scope scales

    at minimum as ! 2 n Q: How can we ef ciently and sparsely encode all this information? A: Graphical models!
  13. 27 . 1 GRAPHICAL MODELS Value of given node =

    ( ) X j f j Xpa(j) The graph's joint probability function p( , , …) = p( |pa( )) x 1 x 2 ∏ j x j x j
  14. 29 . 1 THE "DO" NOTATION We don't / can't

    do a RCT, so let's "simulate" an experimental intervention: p( , …, , …, |do( )) = x 1 x ̂ j x n x j p( , …, ) x1 xn p( |pa( )) xj xj
  15. 30 . 1 DEFINITION OF CAUSAL INFLUENCE We say X

    has a causal in uence over Y, iff there are values and of X and y of Y such that x 1 x 2 p(y|do( )) ≠ p(y|do( )) x 1 x 2
  16. 32 . 1 INFORMAL DEFINITION X and Y are d-separated

    on a graph G if a X can’t tell us anything about the value of another random variable Y in the model, or vice versa. Otherwise they are d-connected.
  17. 40 . 1 RULE 1: IGNORING OBSERVATIONS Suppose . (Y

    ⊥ Z|W, X) G X ⎯⎯ ⎯ Then: . p(y|w, do(x), z) = p(y|w, do(x))
  18. 41 . 1 RULE 2: IGNORING THE ACT OF INTERVENTION

    Suppose . (Y ⊥ Z|W, X) G , X ⎯⎯ ⎯ Z ⎯⎯ ⎯ Then: . p(y|w, do(x), do(z)) = p(y|w, do(x), z)
  19. 42 . 1 RULE 3: IGNORING AN INTERVENTION VARIABLE ENTIRELY

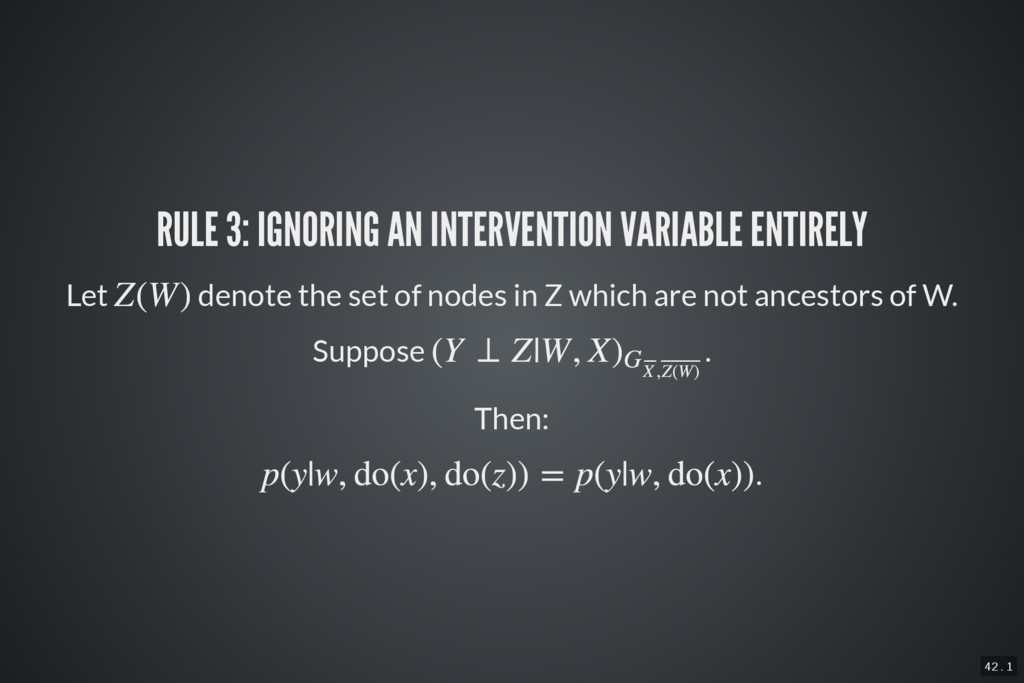
    Let denote the set of nodes in Z which are not ancestors of W. Z(W) Suppose . (Y ⊥ Z|W, X) G , X ⎯⎯ ⎯ Z(W) ⎯ ⎯ ⎯⎯⎯⎯⎯⎯⎯⎯ Then: . p(y|w, do(x), do(z)) = p(y|w, do(x))
  20. 43 . 1 PROOF The proof is left as an

    exercise to the reader :)
  21. 51 . 1 SMOKING CAUSES CANCER? Armed with the 3

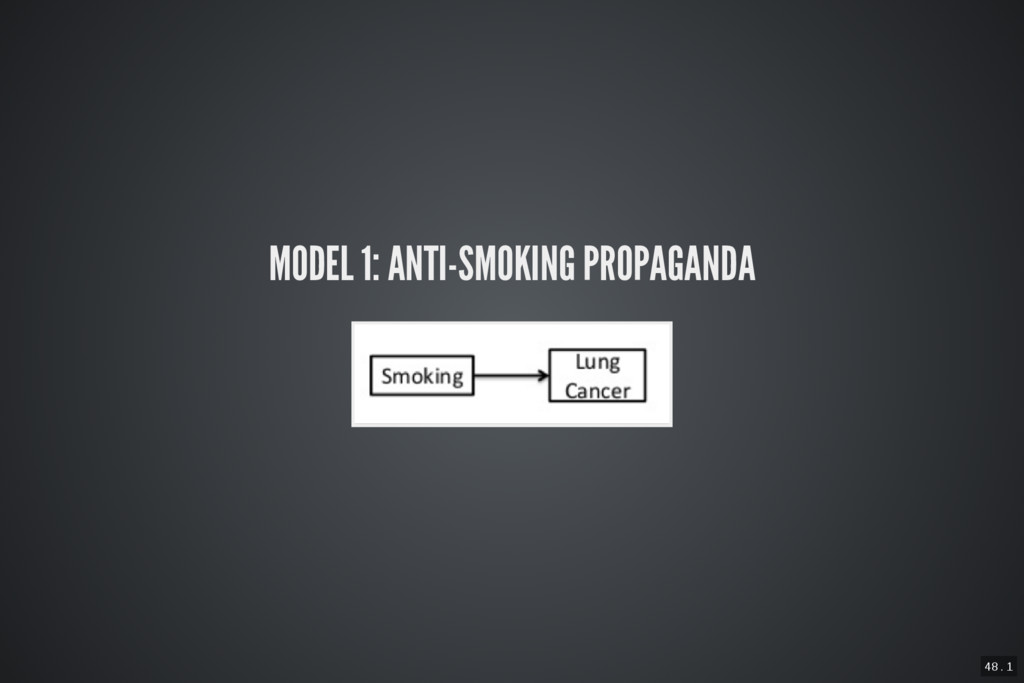
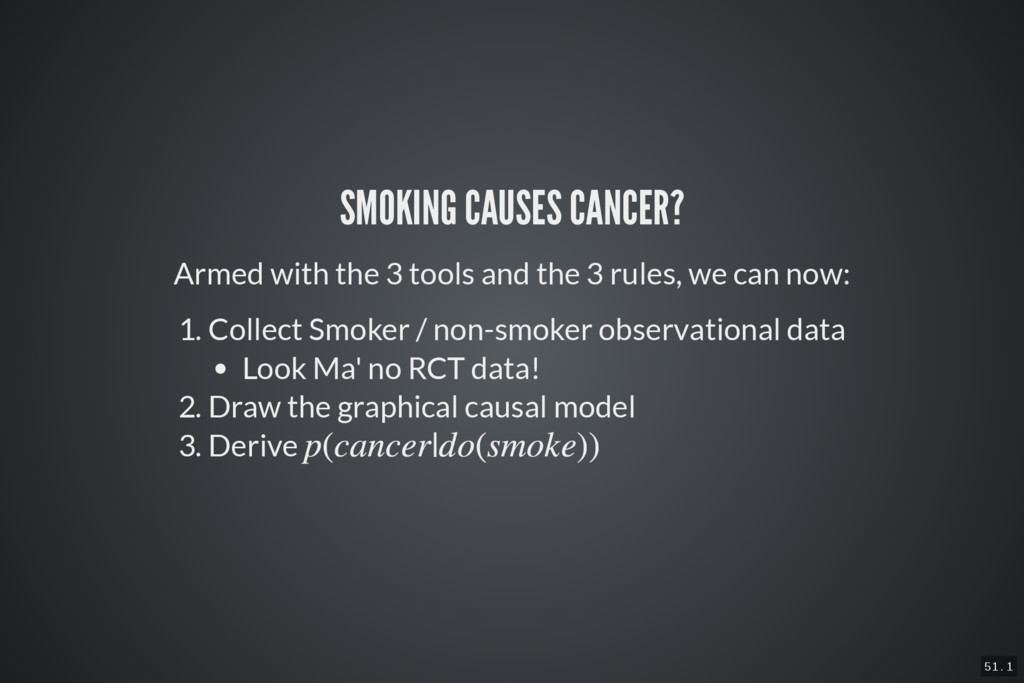
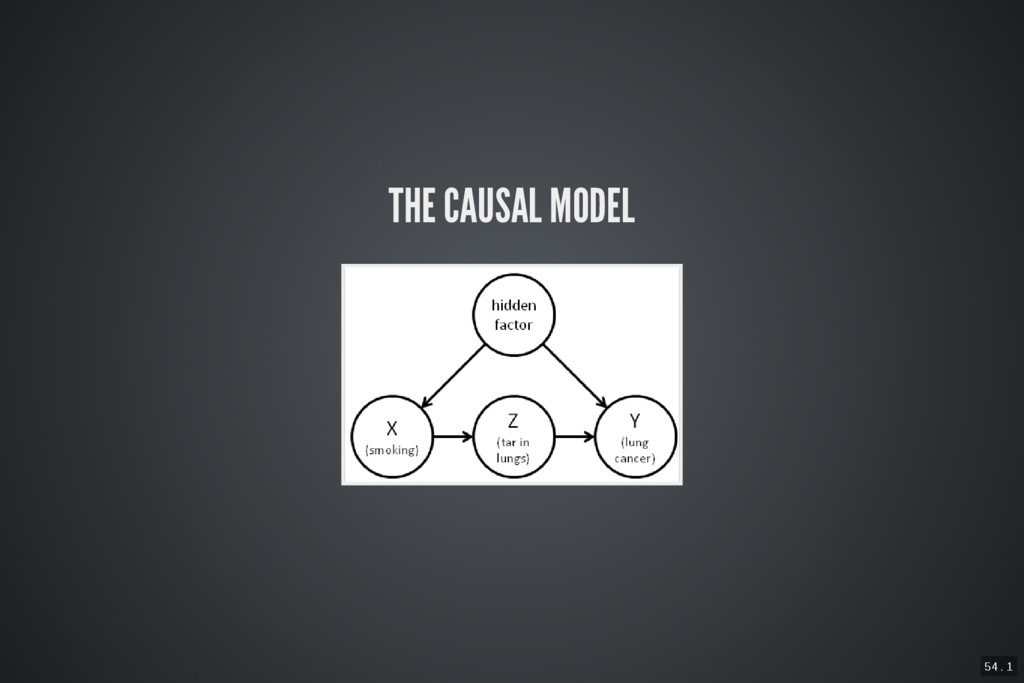
    tools and the 3 rules, we can now: 1. Collect Smoker / non-smoker observational data Look Ma' no RCT data! 2. Draw the graphical causal model 3. Derive p(cancer|do(smoke))
  22. 52 . 1 THE DATA 1 Note: all this purely

    type of data Tobacco companies: smoking in both tar & non-tar groups -> lower cancer rate p(X|Y) Summary: Smoking is GOOD for you!
  23. 53 . 1 THE DATA 2 Note: all this purely

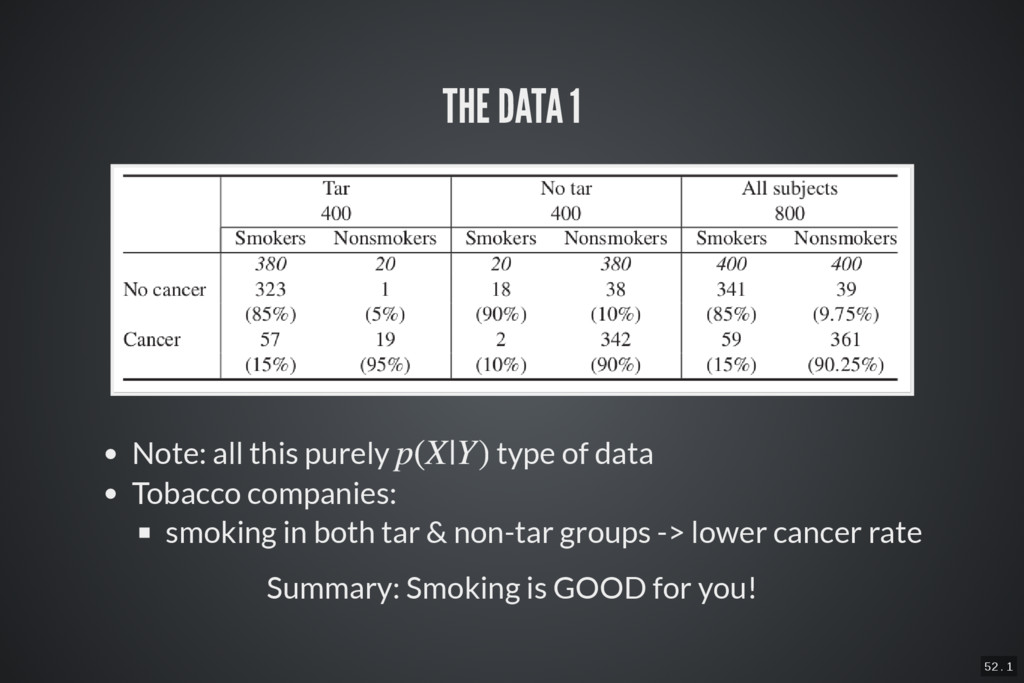
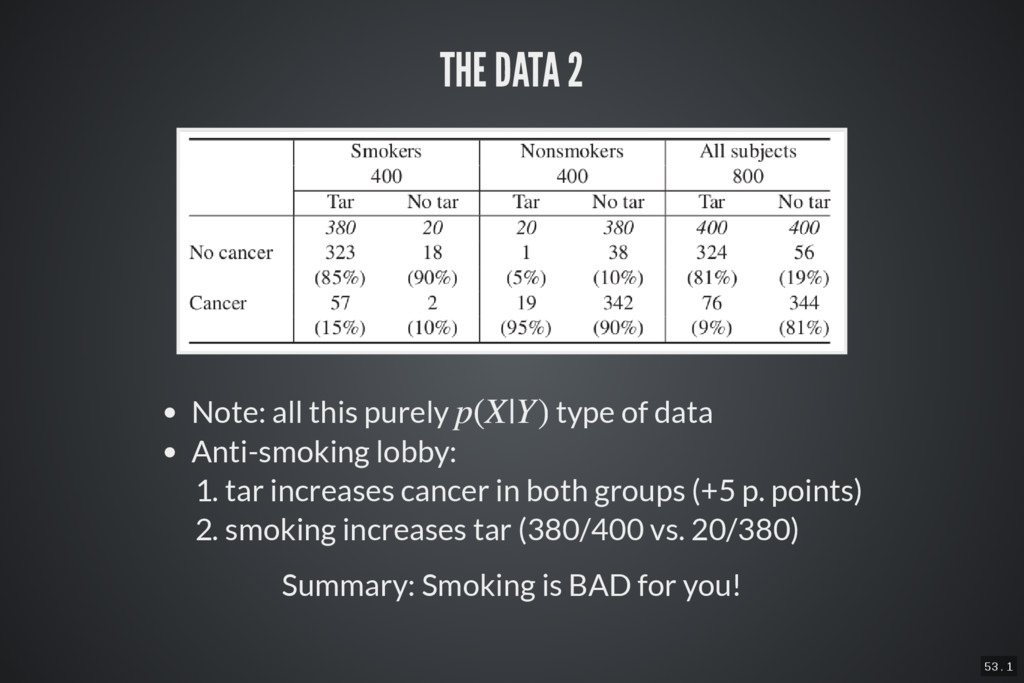
    type of data Anti-smoking lobby: 1. tar increases cancer in both groups (+5 p. points) 2. smoking increases tar (380/400 vs. 20/380) p(X|Y) Summary: Smoking is BAD for you!
  24. 55 . 1 RESULT < < I n s e

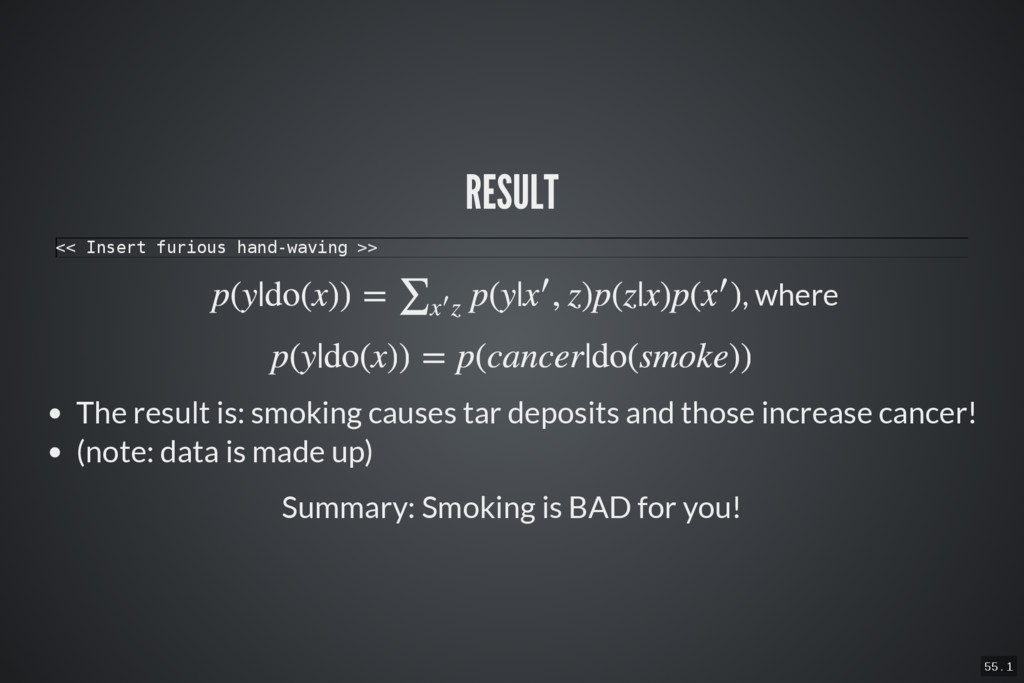
    r t f u r i o u s h a n d - w a v i n g > > , where p(y|do(x)) = p(y| , z)p(z|x)p( ) ∑ z x ′ x′ x′ p(y|do(x)) = p(cancer|do(smoke)) The result is: smoking causes tar deposits and those increase cancer! (note: data is made up) Summary: Smoking is BAD for you!
  25. 57 . 1 WHERE DID THE GRAPH COME FROM Makes

    assumption explicit Domain expert illication Graph structure learning No causes in, no causes out! – Nancy Cartwright
  26. 61 . 1 DNN AND CAUSALITY Object-Context Segmentation & observational

    causal signals See also Athley's work with Random Forests. Discovering Causal Signals in Images, arxiv.org/pdf/1605.08179v1.pdf
  27. 63 . 1 TAKE-AWAY: OBJECT-LEVEL It is possible to constrain

    certain causal relationships from observational data. The tool for that is Causal Calculus.
  28. 64 . 1 TAKE-AWAY: META-LEVEL I beseech you, in the

    bowels of Christ, think it possible that you may be mistaken. – Oliver Cromvell
  29. 65 . 1 QUESTIONS? Judea Pearl Further reading: Michael Nielsen:

    Eliezer Yudkowsky: If correlation doesn’t imply causation, then what does? Causal Diagrams and Causal Models
  30. 67 . 1 ALTERNATIVES There are many ways about how

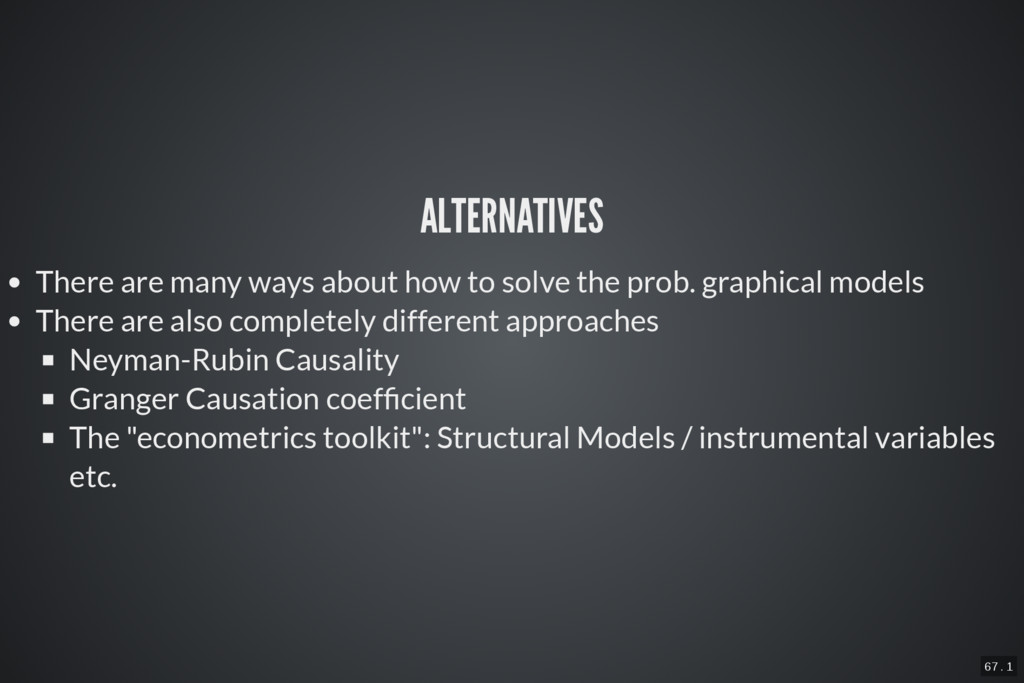
    to solve the prob. graphical models There are also completely different approaches Neyman-Rubin Causality Granger Causation coef cient The "econometrics toolkit": Structural Models / instrumental variables etc.