Upgrade to Pro
— share decks privately, control downloads, hide ads and more …
Speaker Deck
Sign up for free
Menu
Search
Features
All features
Private URLs
Password Protection
Custom URLS
Scheduled publishing
Remove Branding
Restrict embedding
Deck Collections
Notes
Features
All features
Private URLs
Password Protection
Custom URLS
Scheduled publishing
Remove Branding
Restrict embedding
Deck Collections
Notes
Explore
Featured decks
Featured speakers
Programming
Technology
Storyboards
Explore
Featured decks
Featured speakers
Programming
Technology
Storyboards
Pricing
Search
Sign in
Sign up for free
R Based tools for open and collaborative science
Search
Scott Chamberlain
July 26, 2013
Science
1.4k
0
Share
Embed
Copy iframe code
Copy JS code
Copy link
Start on current slide
R Based tools for open and collaborative science
Ignite talk at ESA on R-based tools for open and collaborative science
Scott Chamberlain
July 26, 2013
More Decks by Scott Chamberlain
See All by Scott Chamberlain
Contribution of traits, phenology, & phylogenetic history to plant-pollinator network structure
myrmecocystus
0
86
Programmatic access for Altmetrics
myrmecocystus
1
110
Contribution of traits and phylogenetic history to plant-pollinator network
myrmecocystus
0
120
Other Decks in Science
See All in Science
AI(人工知能)の過去・現在・未来 ~AIは人類を越えるのか~
tagtag
PRO
0
170
共生概念の整理と AIアライメントの構想
hiroakihamada
0
350
[Webinaire InnOvin] Coup de Chaud : Comment préserver la santé des animaux
institutdelelevage
PRO
0
220
明治薬科大学講義_ビッグデータ解析を支えるデータベース技術とクラウドコンピューティング
ktatsuya
1
200
データベース03: 関係データモデル
trycycle
PRO
1
890
プロジェクト「Azayaka」のSARの数式とジオメトリ
syuchimu
0
480
Kritische evaluatie van GenAI-output voor literatuuronderzoek
voginip
0
240
科学で迫る勝敗の法則-スポーツデータ分析の最前線 (刈谷市連携講座.2026年7月) / The principle of victory discovered by science. at Kariya City, 2027.07
konakalab
0
200
データベース11: 正規化(1/2) - 望ましくない関係スキーマ
trycycle
PRO
0
1.8k
コーヒー豆様核 (Coffee-bean nuclei) における形態学的サブタイピングと精選・焙煎特性の同定
jagupath
PRO
0
190
[NLP2026 参加報告会] AI for Science まとめ / NLP2026
lychee1223
0
2k
知能とはなにか -ヒトとAIのあいだ-
tagtag
PRO
0
230
Featured
See All Featured
Building Flexible Design Systems
yeseniaperezcruz
330
41k
AI in Enterprises - Java and Open Source to the Rescue
ivargrimstad
0
1.5k
Future Trends and Review - Lecture 12 - Web Technologies (1019888BNR)
signer
PRO
0
3.8k
Marketing Yourself as an Engineer | Alaka | Gurzu
gurzu
0
320
Build your cross-platform service in a week with App Engine
jlugia
234
19k
The innovator’s Mindset - Leading Through an Era of Exponential Change - McGill University 2025
jdejongh
PRO
1
370
Become a Pro
speakerdeck
PRO
31
6.3k
Darren the Foodie - Storyboard
khoart
PRO
4
4k
The AI Revolution Will Not Be Monopolized: How open-source beats economies of scale, even for LLMs
inesmontani
PRO
3
3.8k
The Curse of the Amulet
leimatthew05
3
15k
Stop Working from a Prison Cell
hatefulcrawdad
274
21k
The Illustrated Children's Guide to Kubernetes
chrisshort
51
53k
Transcript
R-based tools for open and collaborative science @recology_ Scott Chamberlain
Science needs to be more open
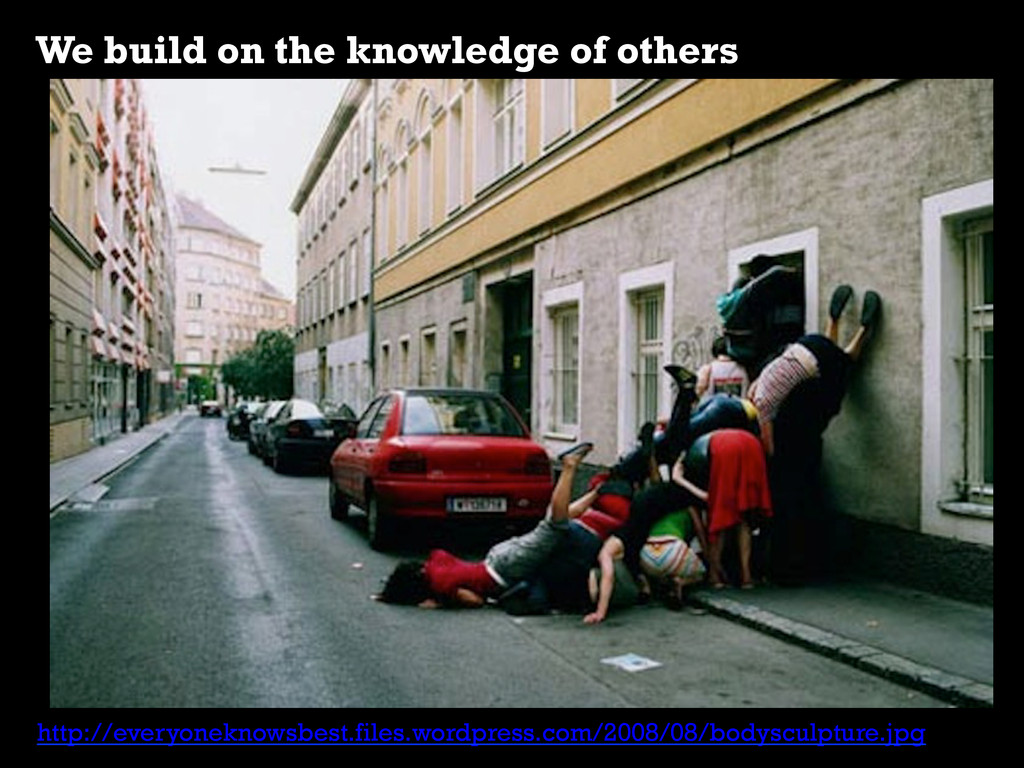
http://everyoneknowsbest.files.wordpress.com/2008/08/bodysculpture.jpg We build on the knowledge of others http://everyoneknowsbest.files.wordpress.com/2008/08/bodysculpture.jpg
Less mistakes More things can happen b/c data is open
http://everyoneknowsbest.files.wordpress.com/2008/08/bodysculpture.jpg The public paid for it!
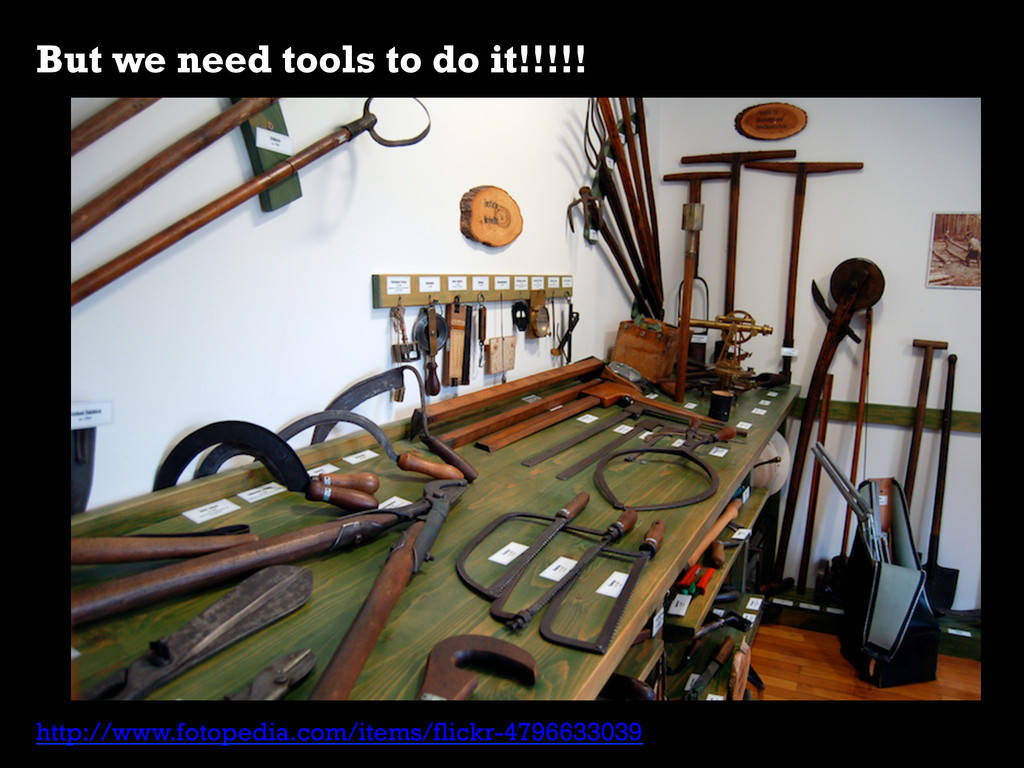
http://www.fotopedia.com/items/flickr-4796633039 But we need tools to do it!!!!!
What kinds of tools? Not these
These!!!!!!
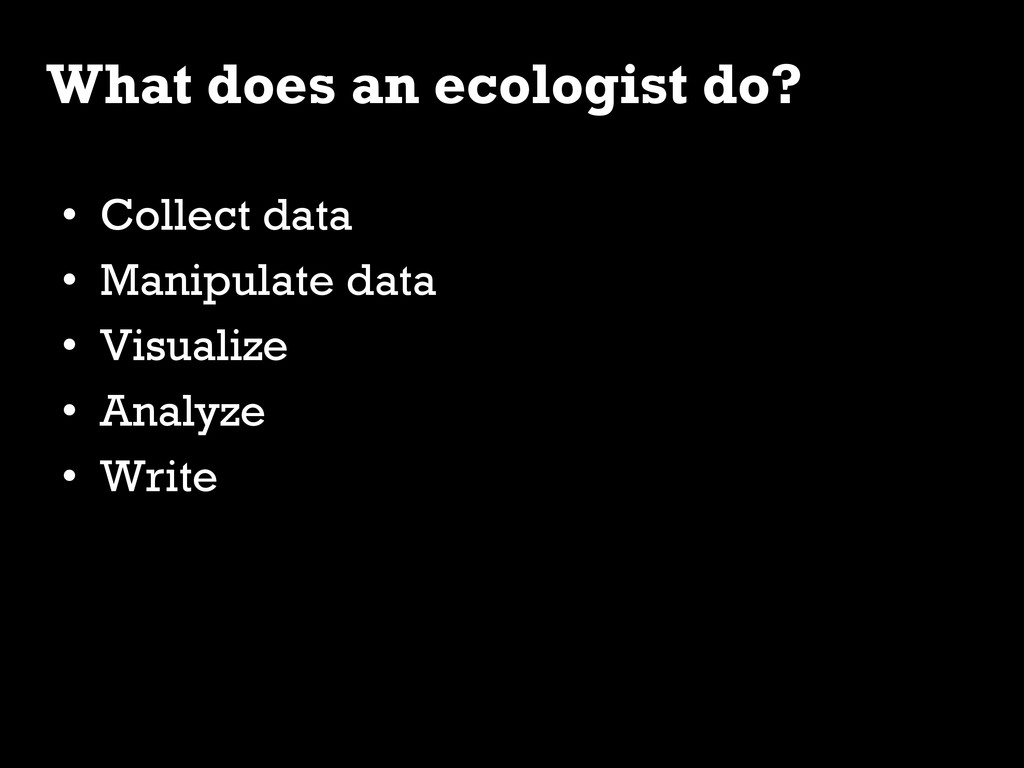
• Collect data • Manipulate data • Visualize • Analyze
• Write What does an ecologist do?
R is a good solution
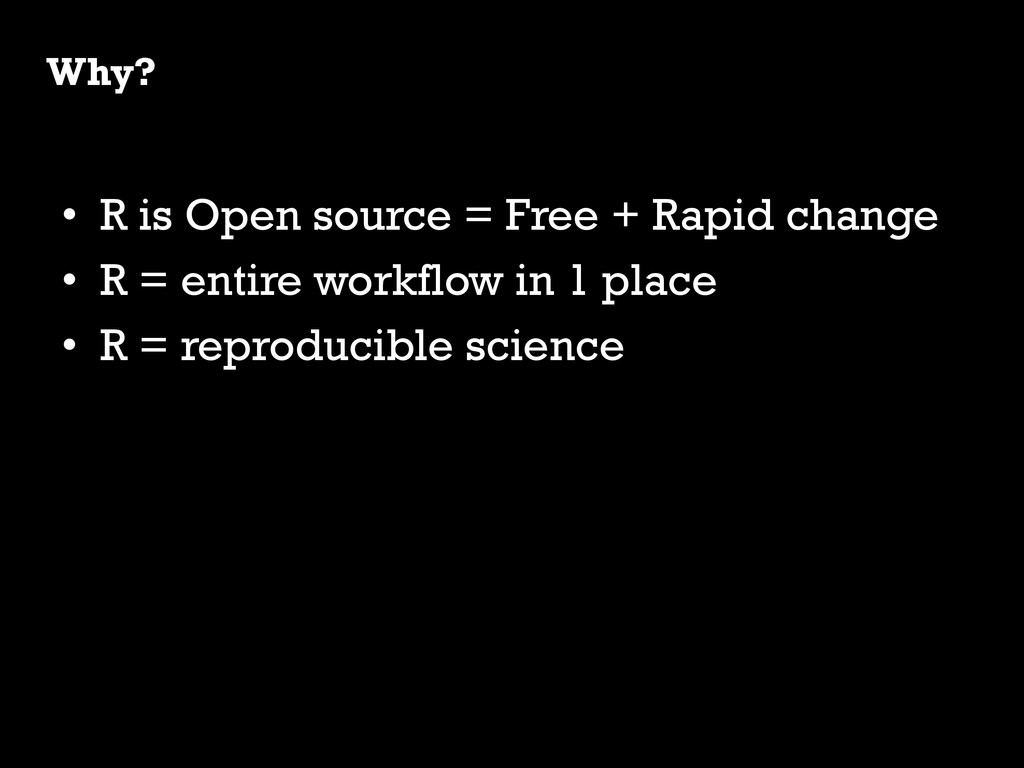
• R is Open source = Free + Rapid change
• R = entire workflow in 1 place • R = reproducible science Why?
Get some data from the web library(RCurl); library(RJSONIO) dat <-
fromJSON(getURL("https://api.github.com/users/hadley/repos")) Manipulate the data library(plyr); library(reshape2) dat_melt <- melt(ldply(dat, function(x) data.frame(x[names(x) %in% c("name","watchers_count","forks")]))) Run some statistical model lm(value ~ variable, data = dat_melt) Visualize results library(ggplot2) ggplot(dat_melt, aes(name, value, colour = variable)) + geom_point() + coord_flip() Write the paper # Introduction...
Data increasingly on the web
The toolbelt
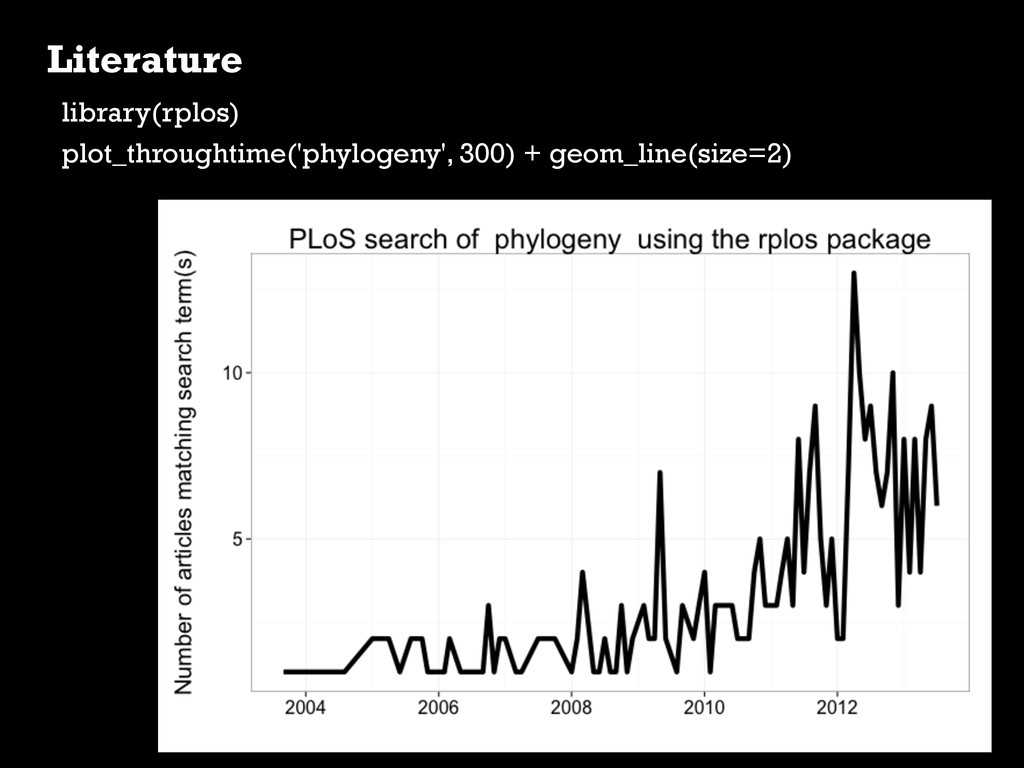
Literature library(rplos) plot_throughtime('phylogeny', 300) + geom_line(size=2)
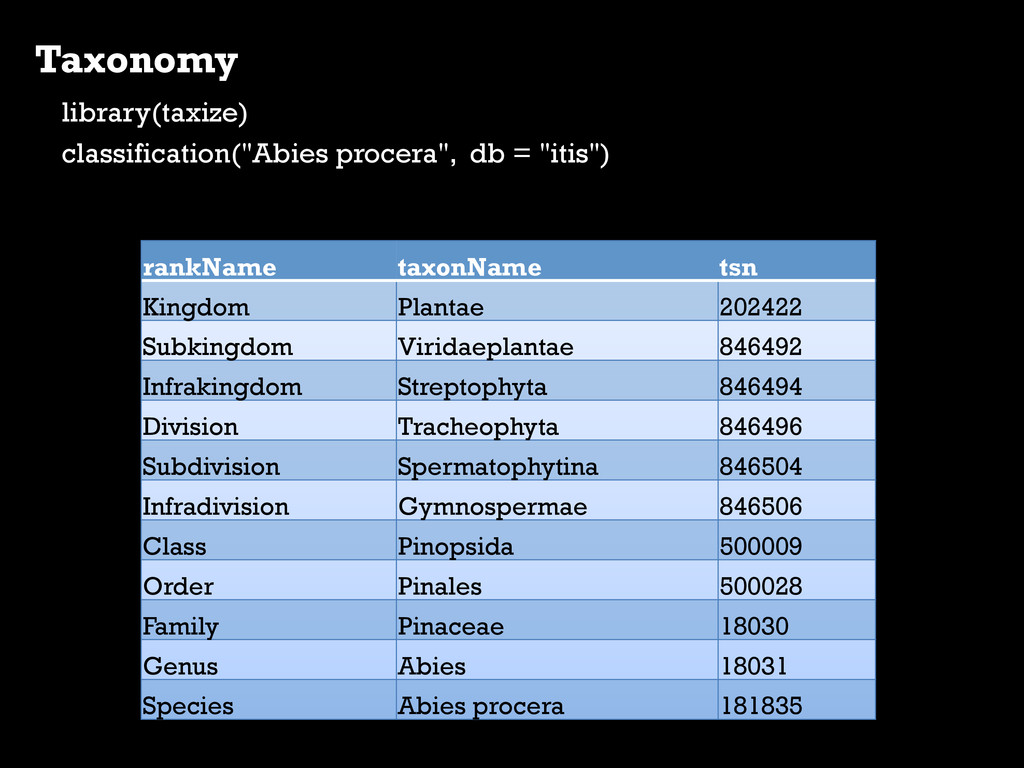
Taxonomy library(taxize) classification("Abies procera", db = "itis") rankName taxonName
tsn Kingdom Plantae 202422 Subkingdom Viridaeplantae 846492 Infrakingdom Streptophyta 846494 Division Tracheophyta 846496 Subdivision Spermatophytina 846504 Infradivision Gymnospermae 846506 Class Pinopsida 500009 Order Pinales 500028 Family Pinaceae 18030 Genus Abies 18031 Species Abies procera 181835
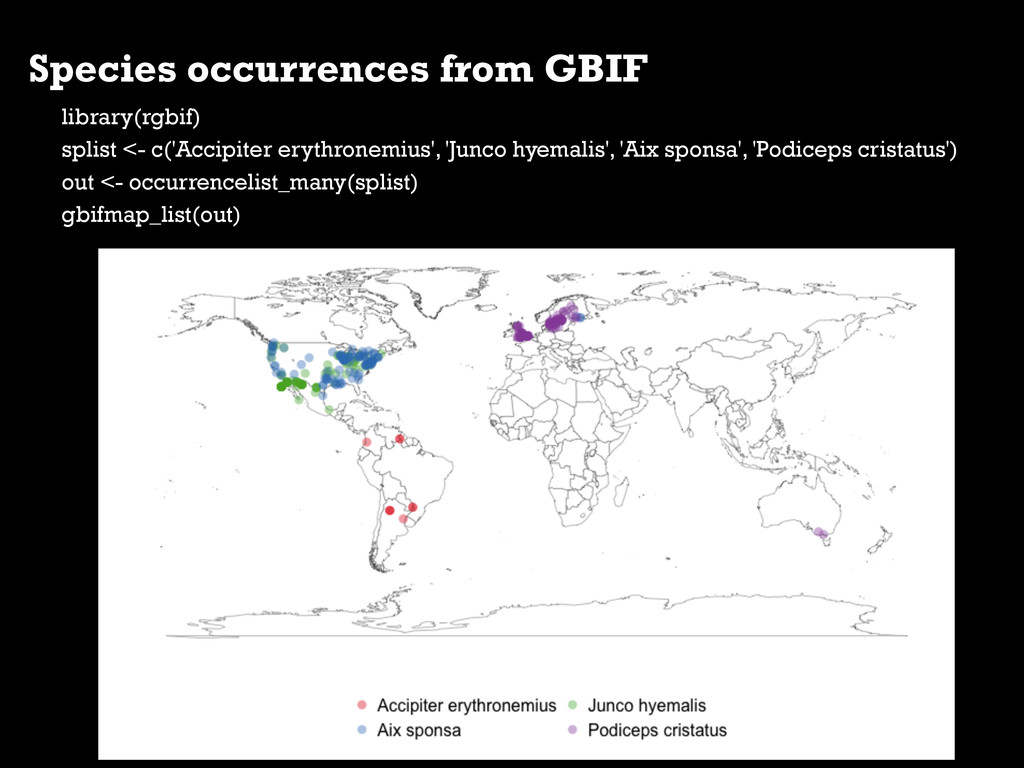
Species occurrences from GBIF library(rgbif) splist <- c('Accipiter erythronemius', 'Junco
hyemalis', 'Aix sponsa', 'Podiceps cristatus') out <- occurrencelist_many(splist) gbifmap_list(out)
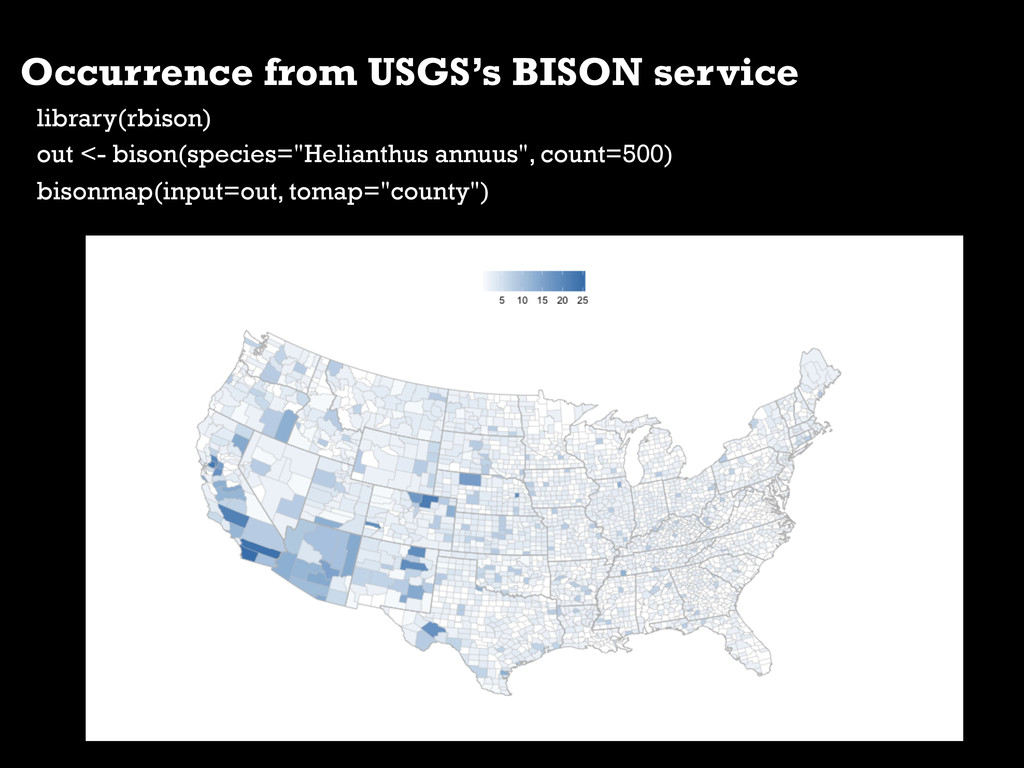
Occurrence from USGS’s BISON service library(rbison) out <- bison(species="Helianthus annuus",
count=500) bisonmap(input=out, tomap="county")
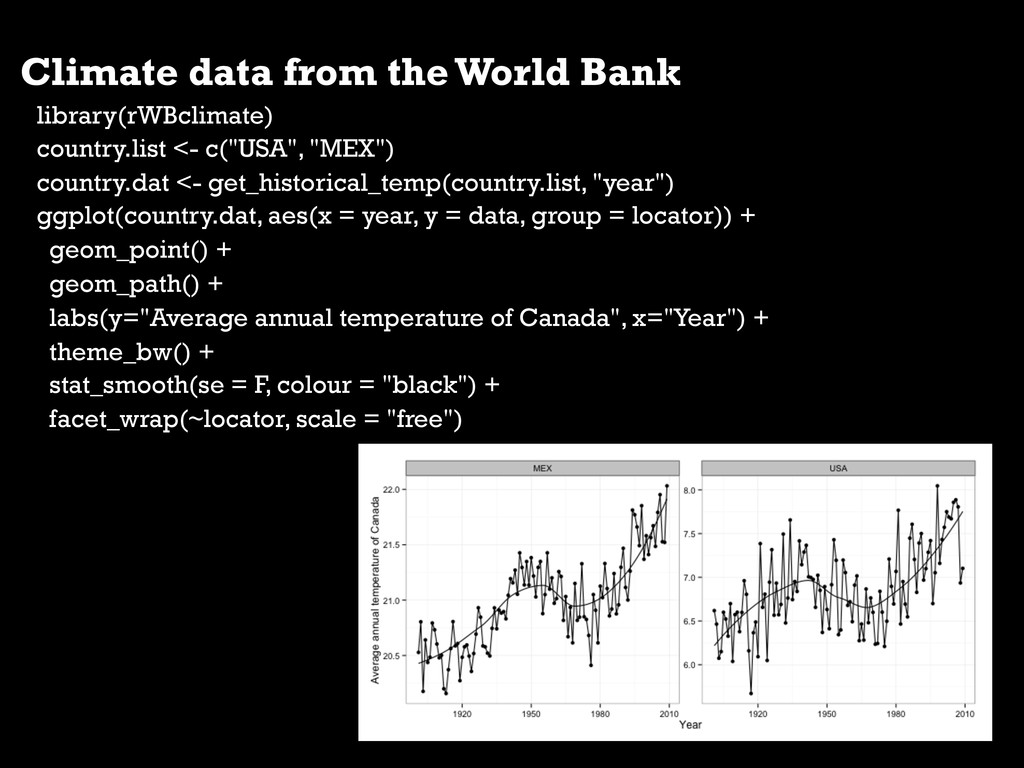
Climate data from the World Bank library(rWBclimate) country.list <- c("USA",
"MEX") country.dat <- get_historical_temp(country.list, "year") ggplot(country.dat, aes(x = year, y = data, group = locator)) + geom_point() + geom_path() + labs(y="Average annual temperature of Canada", x="Year") + theme_bw() + stat_smooth(se = F, colour = "black") + facet_wrap(~locator, scale = "free")
Take action! FontAwesome http://fortawesome.github.io/Font-Awesome/ fontawesome 2 png https://github.com/odyniec/font-awesome-to-png Presentation available
here: http://bit.ly/16tuVbu


 myrmecocystus
 tagtag
 hiroakihamada
 institutdelelevage
.jpg) ktatsuya
ktatsuya
 trycycle
 syuchimu
 voginip
 konakalab
 jagupath
.jpg) lychee1223
lychee1223
 yeseniaperezcruz
 ivargrimstad
 signer
 gurzu
gurzu
 jlugia
 jdejongh
 speakerdeck
 khoart
 inesmontani
 leimatthew05
 hatefulcrawdad
 chrisshort