Upgrade to Pro
— share decks privately, control downloads, hide ads and more …
Speaker Deck
Features
Speaker Deck
PRO
Sign in
Sign up for free
Search
Search
SVG Graph Animation
Search
namikuguri
July 11, 2016
Technology
290
0
Share
Embed
Copy iframe code
Copy JS code
Copy link
Start on current slide
SVG Graph Animation
グラフアニメーションが作れるライブラリの紹介
namikuguri
July 11, 2016
More Decks by namikuguri
See All by namikuguri
実例から学ぶ CSSアニメーション
namikuguri
1
1.5k
かるくCalc()
namikuguri
0
210
SVG Basic
namikuguri
0
260
石
namikuguri
0
99
僕はあの日夕暮れ時に書いたスタイルガイドを忘れない
namikuguri
0
870
誰と作るデザイン?
namikuguri
0
640
CSS の構造化、その目的
namikuguri
0
110
fitme
namikuguri
0
90
About color
namikuguri
0
110
Other Decks in Technology
See All in Technology
AIコード生成×サプライチェーン攻撃 — PHPが直面する“二重の信頼問題
shinyasaita
0
450
Alphaモジュール使っていいのかい!?いけないのかい!?どっちなんだいっ!?
watany
1
320
CDKで書くECSのベストプラクティス、 改めて考え直す2026 #cdkconf2026
makies
3
930
どこまでAIに任せるか 〜確率論と決定論の境界決定〜
shukob
0
440
SoccerMaster: A Vision Foundation Model for Soccer Understanding
kzykmyzw
0
160
データと地図で読む 大井町の「かわるもの、かわらないもの」
yoshiyama_hana
0
110
「休む」重要さ
smt7174
6
1.6k
変更し続けられるシステムをどう保つか — AI時代のSSoTという設計原則
kawauso
1
1k
[Droidcon Orlando '26] The Android Lens: Applying Mobile Forensics to AI Performance
amanda_hinchman
1
110
文字起こし基盤の信頼性
abnoumaru
0
120
OpenTelemetryにおけるGoのゼロコード・コンパイル時計装について #fukuokago
quiver
0
200
キャリアLT会#3
beli68
2
230
Featured
See All Featured
We Analyzed 250 Million AI Search Results: Here's What I Found
joshbly
1
1.6k
How To Speak Unicorn (iThemes Webinar)
marktimemedia
1
510
AI Search: Where Are We & What Can We Do About It?
aleyda
0
7.7k
Done Done
chrislema
186
16k
Amusing Abliteration
ianozsvald
1
240
Highjacked: Video Game Concept Design
rkendrick25
PRO
1
410
Art, The Web, and Tiny UX
lynnandtonic
304
22k
It's Worth the Effort
3n
188
29k
Crafting Experiences
bethany
1
230
How to build a perfect <img>
jonoalderson
1
5.8k
The Power of CSS Pseudo Elements
geoffreycrofte
82
6.5k
The Illustrated Children's Guide to Kubernetes
chrisshort
51
53k
Transcript
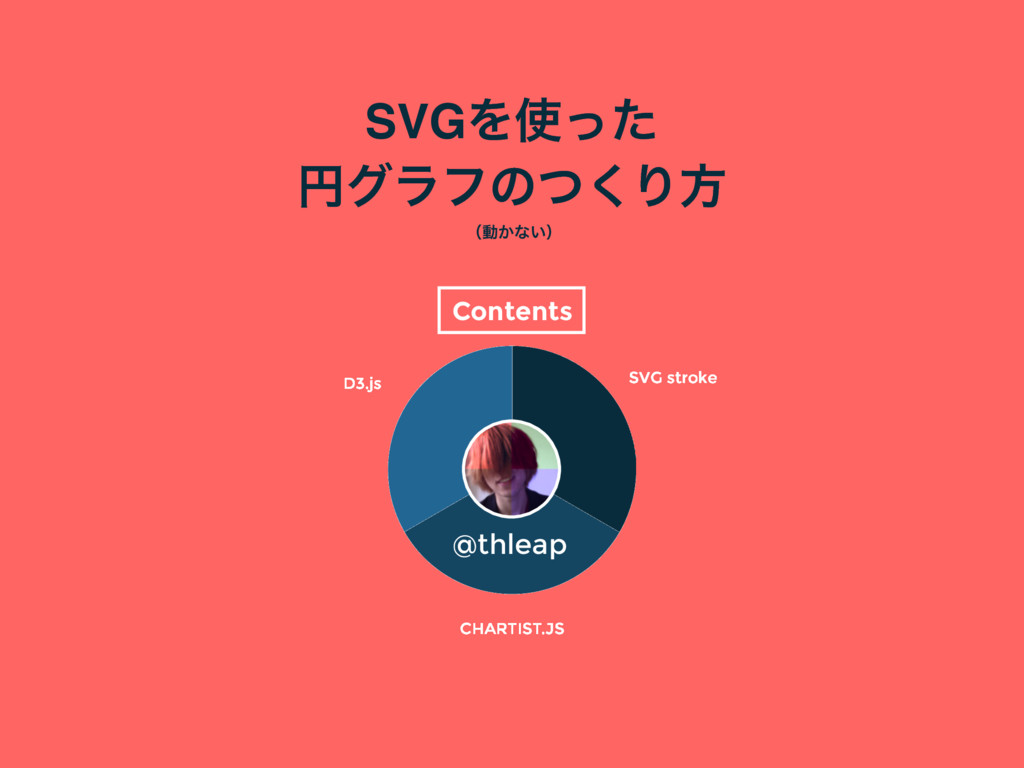
SVGΛͬͨ ԁάϥϑͷͭ͘Γํ ʢಈ͔ͳ͍ʣ Contents D3.js CHARTIST.JS SVG stroke @thleap
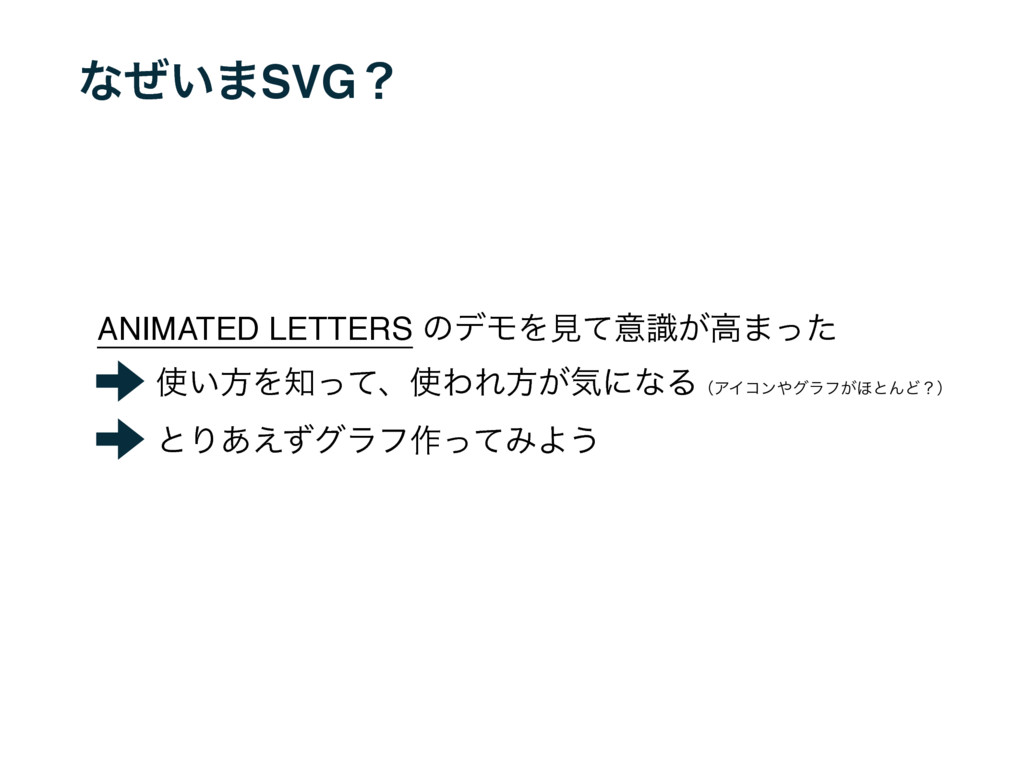
ͳ͍ͥ·SVGʁ ANIMATED LETTERS ͷσϞΛݟͯҙ͕ࣝߴ·ͬͨ ͍ํΛͬͯɺΘΕํ͕ؾʹͳΔʢΞΠίϯάϥϑ͕΄ͱΜͲʁʣ ͱΓ͋͑ͣάϥϑ࡞ͬͯΈΑ͏
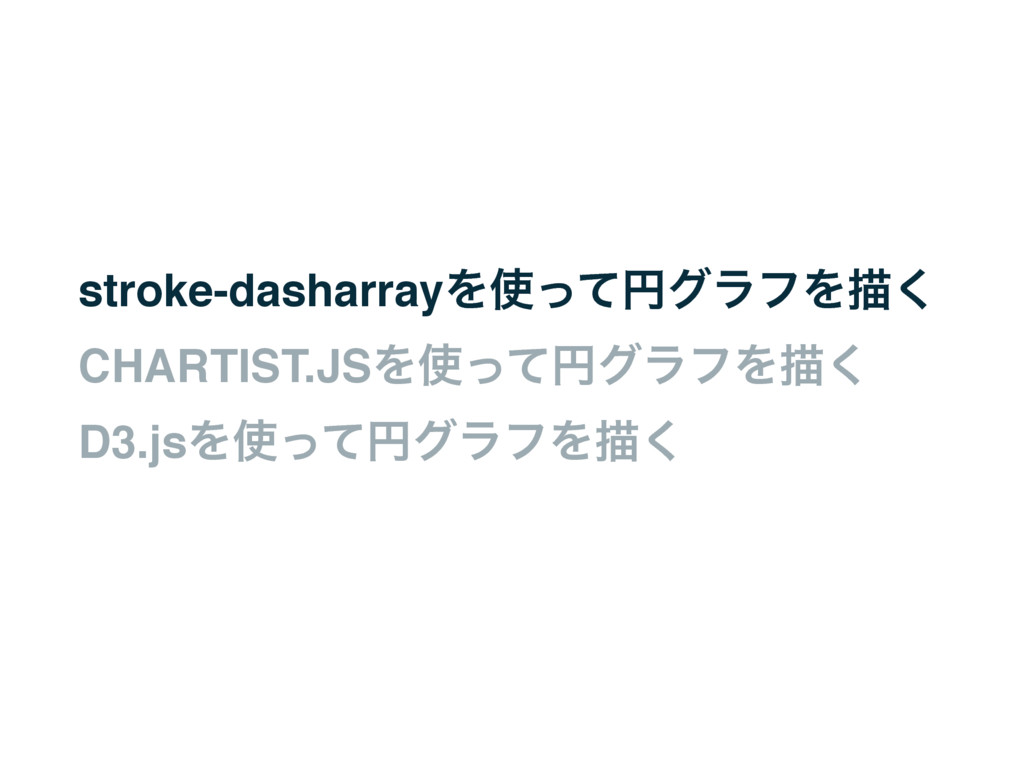
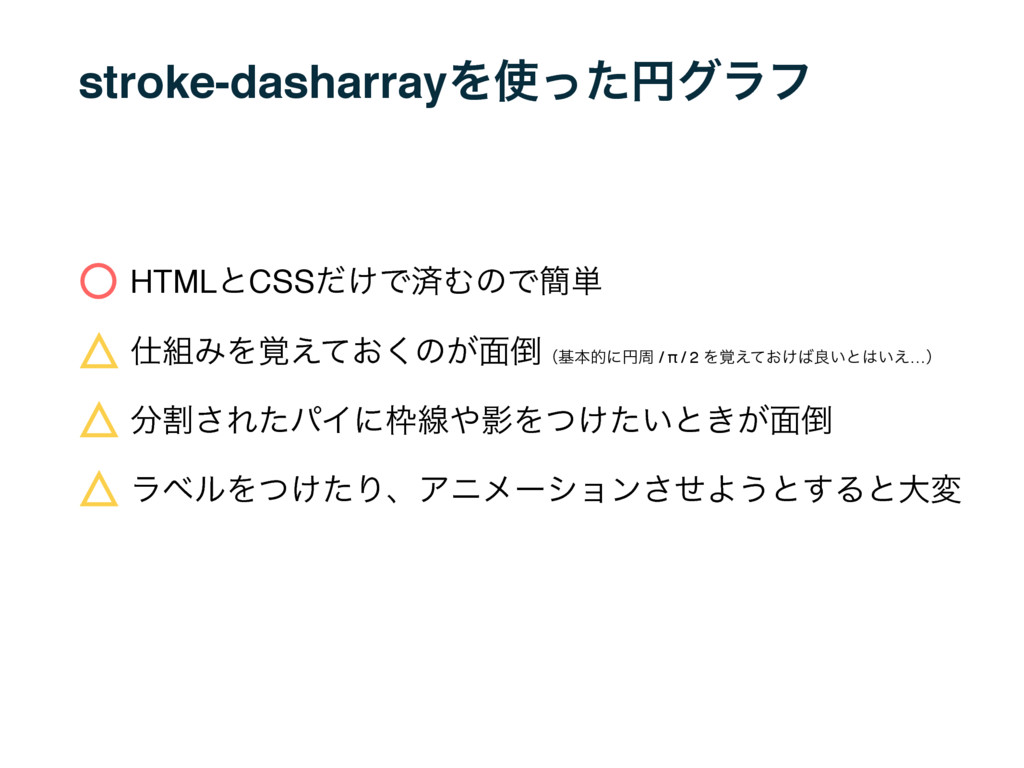
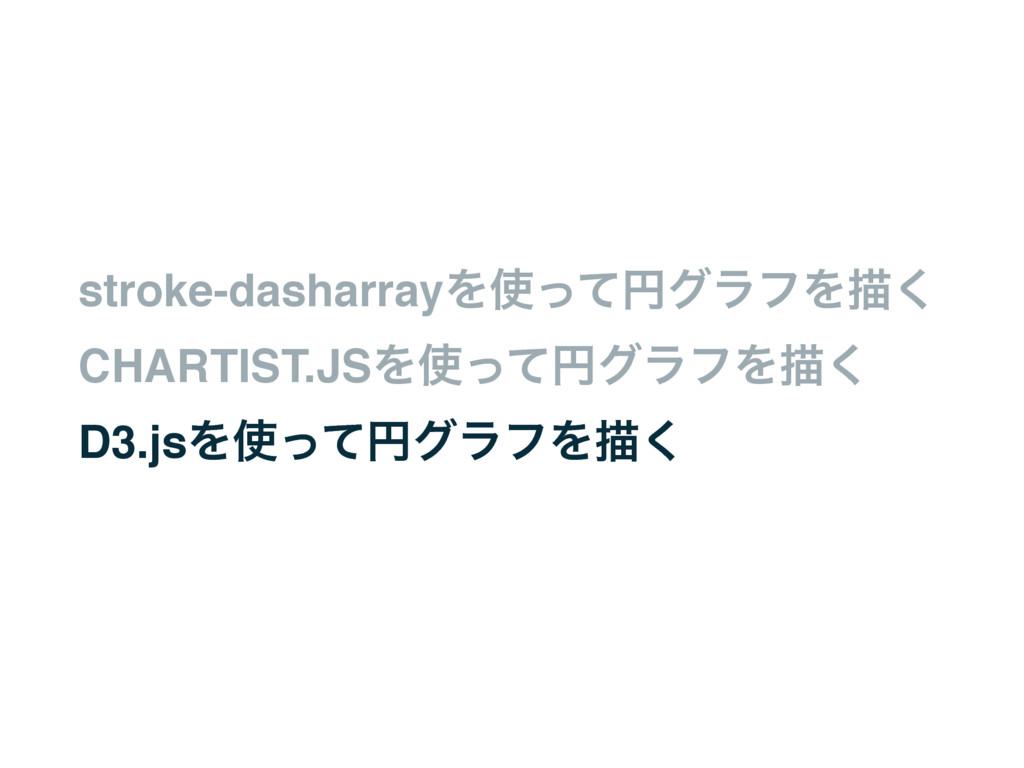
stroke-dasharrayΛͬͯԁάϥϑΛඳ͘ CHARTIST.JSΛͬͯԁάϥϑΛඳ͘ D3.jsΛͬͯԁάϥϑΛඳ͘
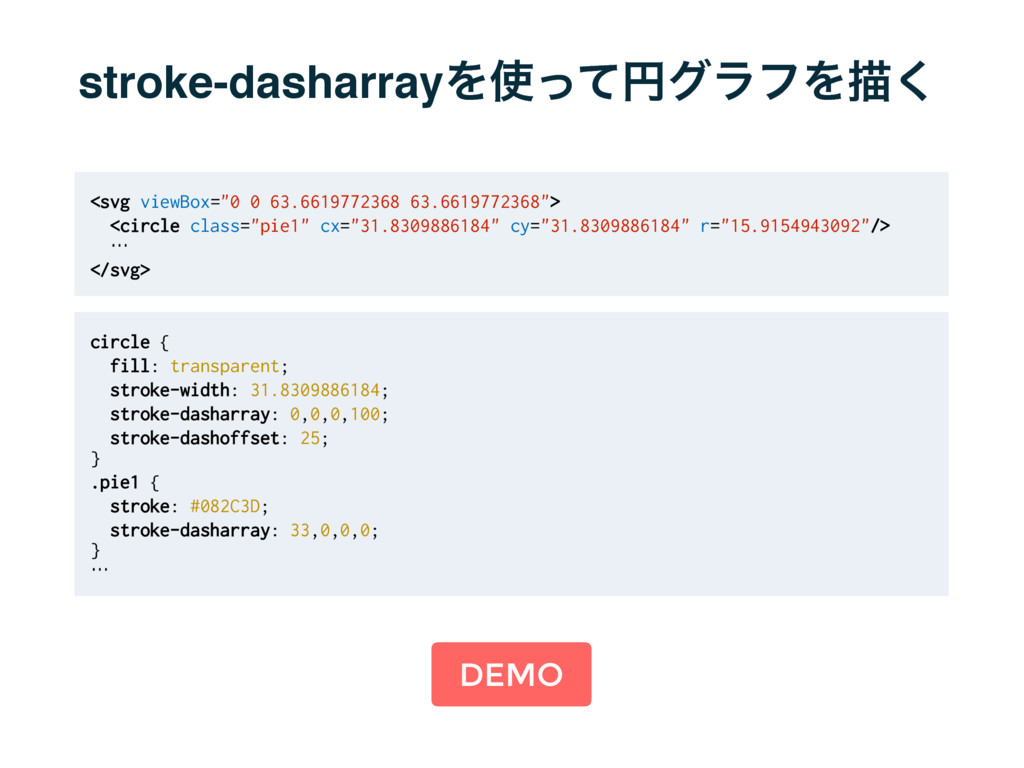
stroke-dasharrayΛͬͯԁάϥϑΛඳ͘ <svg viewBox="0 0 63.6619772368 63.6619772368"> <circle class="pie1" cx="31.8309886184" cy="31.8309886184"
r="15.9154943092"/> … </svg> circle { fill: transparent; stroke-width: 31.8309886184; stroke-dasharray: 0,0,0,100; stroke-dashoffset: 25; } .pie1 { stroke: #082C3D; stroke-dasharray: 33,0,0,0; } … DEMO
stroke-dasharrayΛͬͨԁάϥϑ ΈΛ͓֮͑ͯ͘ͷ͕໘ʢجຊతʹԁप / π / 2 Λ͓͚֮͑ͯྑ͍ͱ͍͑…ʣ HTMLͱCSS͚ͩͰࡁΉͷͰ؆୯ ׂ͞ΕͨύΠʹઢӨΛ͚͍ͭͨͱ͖͕໘ ϥϕϧΛ͚ͭͨΓɺΞχϝʔγϣϯͤ͞Α͏ͱ͢Δͱେม
stroke-dasharrayΛͬͯԁάϥϑΛඳ͘ CHARTIST.JSΛͬͯԁάϥϑΛඳ͘ D3.jsΛͬͯԁάϥϑΛඳ͘
None
None
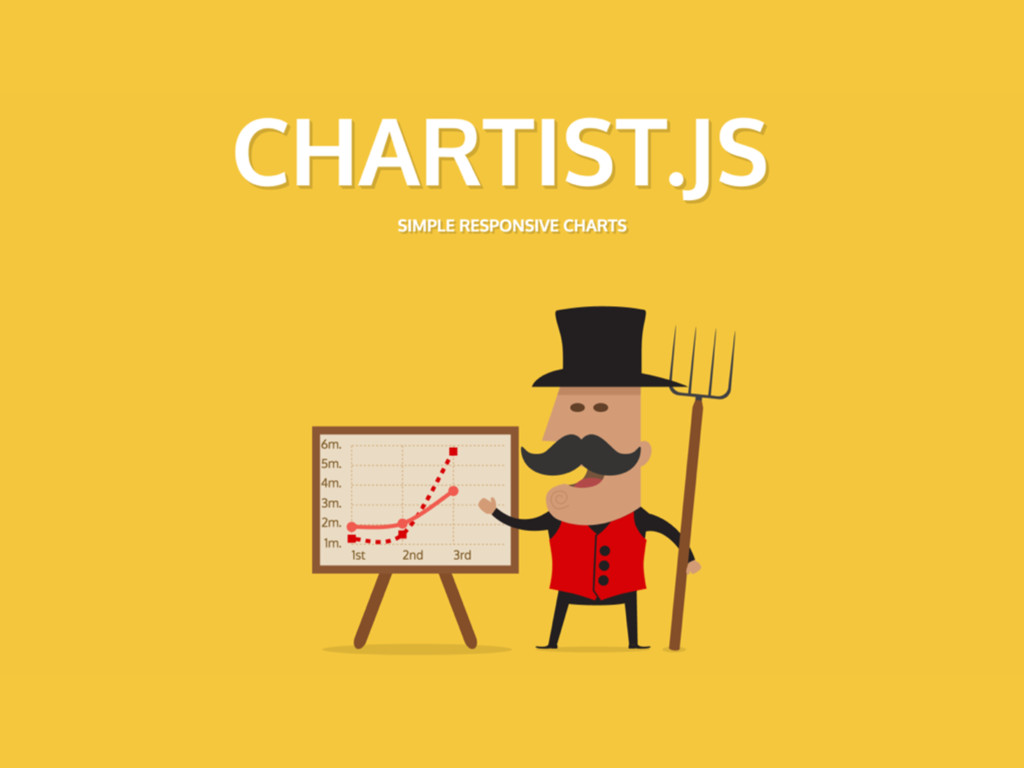
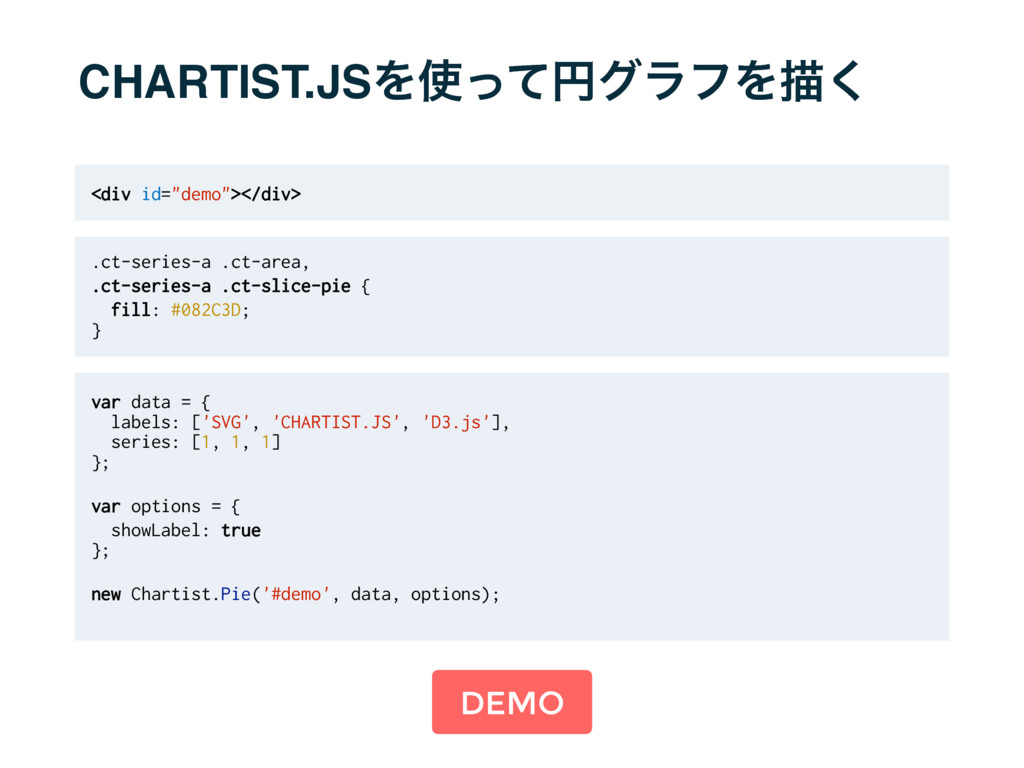
CHARTIST.JSΛͬͯԁάϥϑΛඳ͘ DEMO <div id="demo"></div> .ct-series-a .ct-area, .ct-series-a .ct-slice-pie { fill:
#082C3D; } var data = { labels: ['SVG', 'CHARTIST.JS', 'D3.js'], series: [1, 1, 1] }; var options = { showLabel: true }; new Chartist.Pie('#demo', data, options);
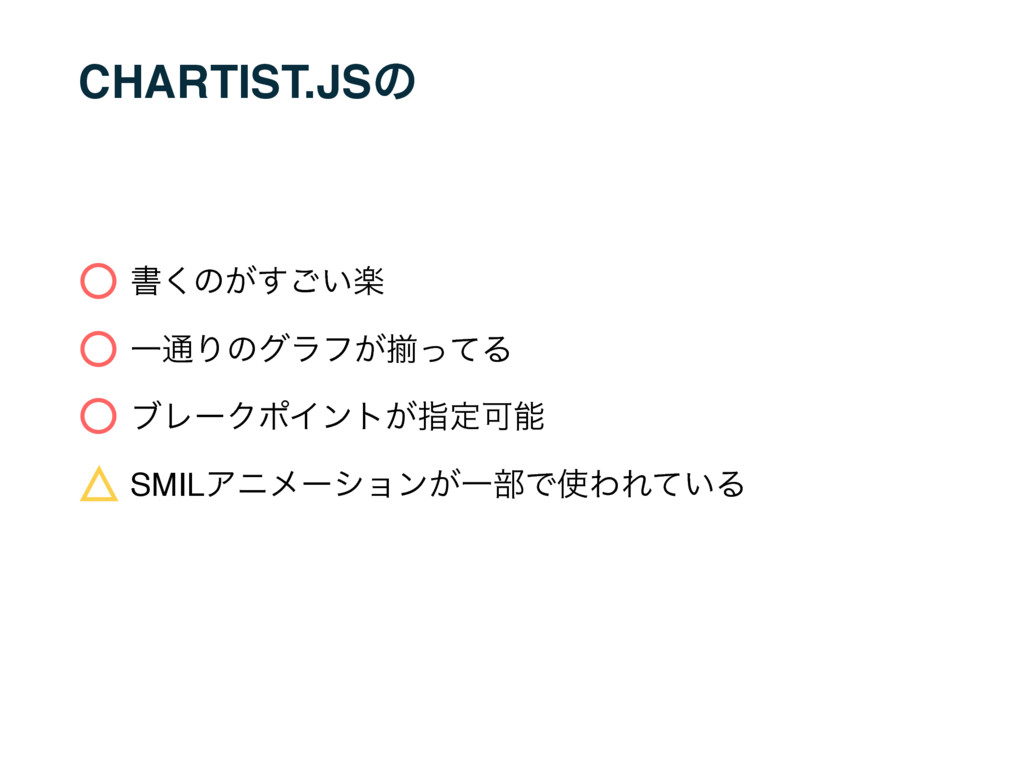
CHARTIST.JSͷ Ұ௨Γͷάϥϑ͕ἧͬͯΔ ϒϨʔΫϙΠϯτ͕ࢦఆՄೳ SMILΞχϝʔγϣϯ͕Ұ෦ͰΘΕ͍ͯΔ ॻ͘ͷָ͕͍͢͝
stroke-dasharrayΛͬͯԁάϥϑΛඳ͘ CHARTIST.JSΛͬͯԁάϥϑΛඳ͘ D3.jsΛͬͯԁάϥϑΛඳ͘
None
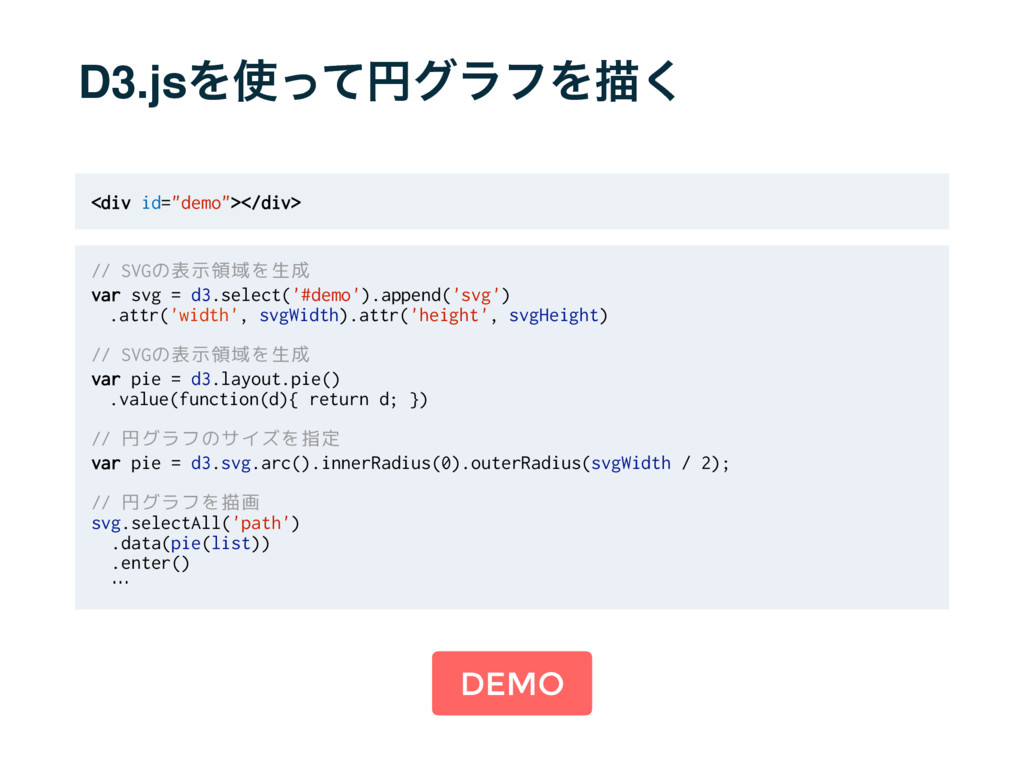
D3.jsΛͬͯԁάϥϑΛඳ͘ DEMO <div id="demo"></div> // SVGの表示領域を生成 var svg = d3.select('#demo').append('svg')
.attr('width', svgWidth).attr('height', svgHeight) // SVGの表示領域を生成 var pie = d3.layout.pie() .value(function(d){ return d; }) // 円グラフのサイズを指定 var pie = d3.svg.arc().innerRadius(0).outerRadius(svgWidth / 2); // 円グラフを描画 svg.selectAll('path') .data(pie(list)) .enter() …
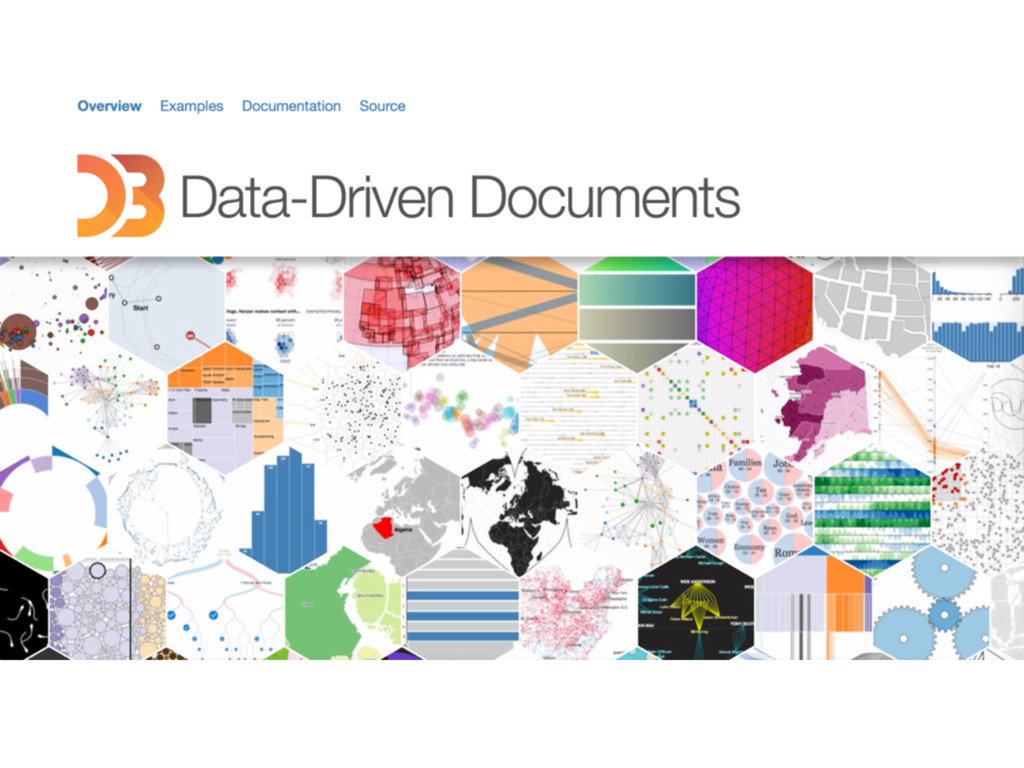
D3.jsͷ ར༻ऀ͕ଟ͘ɺυΩϡϝϯτ๛ ଟ࠼ͳදݱ͕Մೳ
ֶͿͱਂΈʹ·Γͦ͏ͳ D3.js ͕ྑͦ͞͏ ·ͱΊ