Upgrade to Pro — share decks privately, control downloads, hide ads and more …

Advanced EONIA Curve Calibration

Ferdinando M. Ametrano
December 07, 2016
1.2k

Advanced EONIA Curve Calibration

https://ssrn.com/abstract=2881445

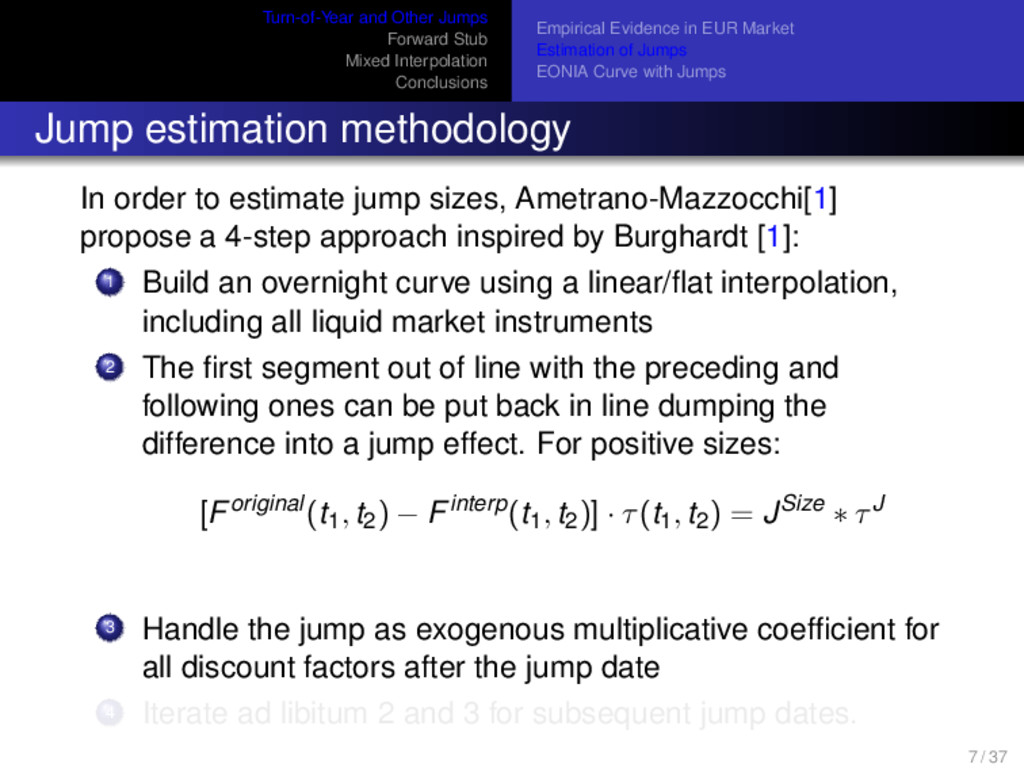
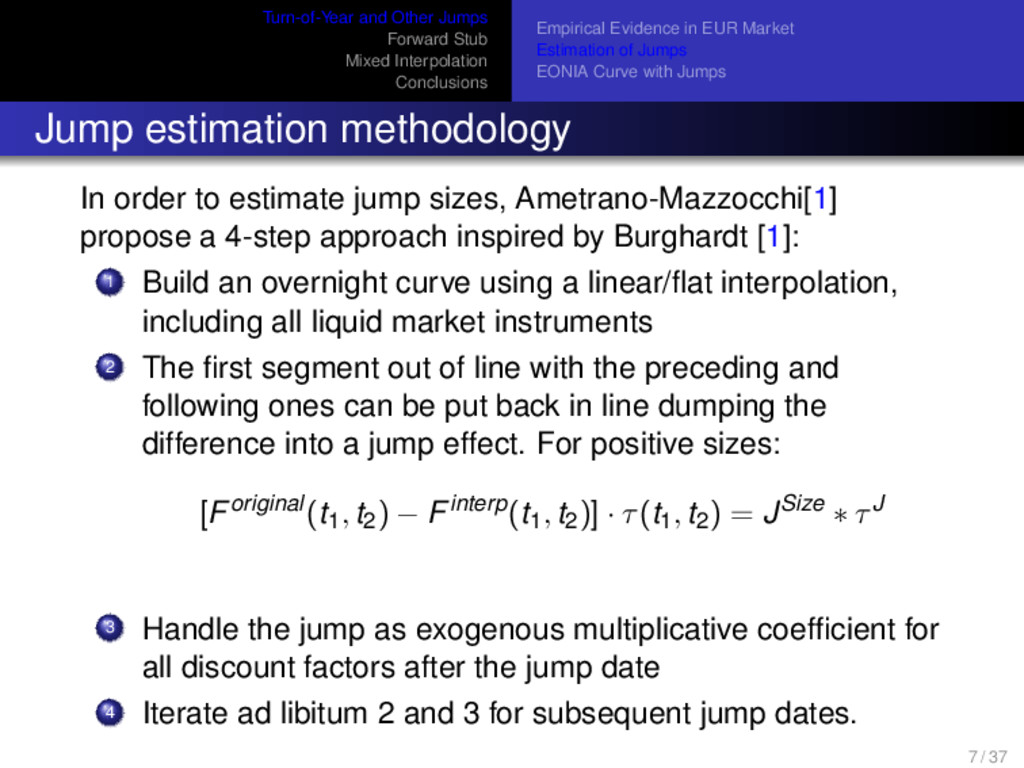
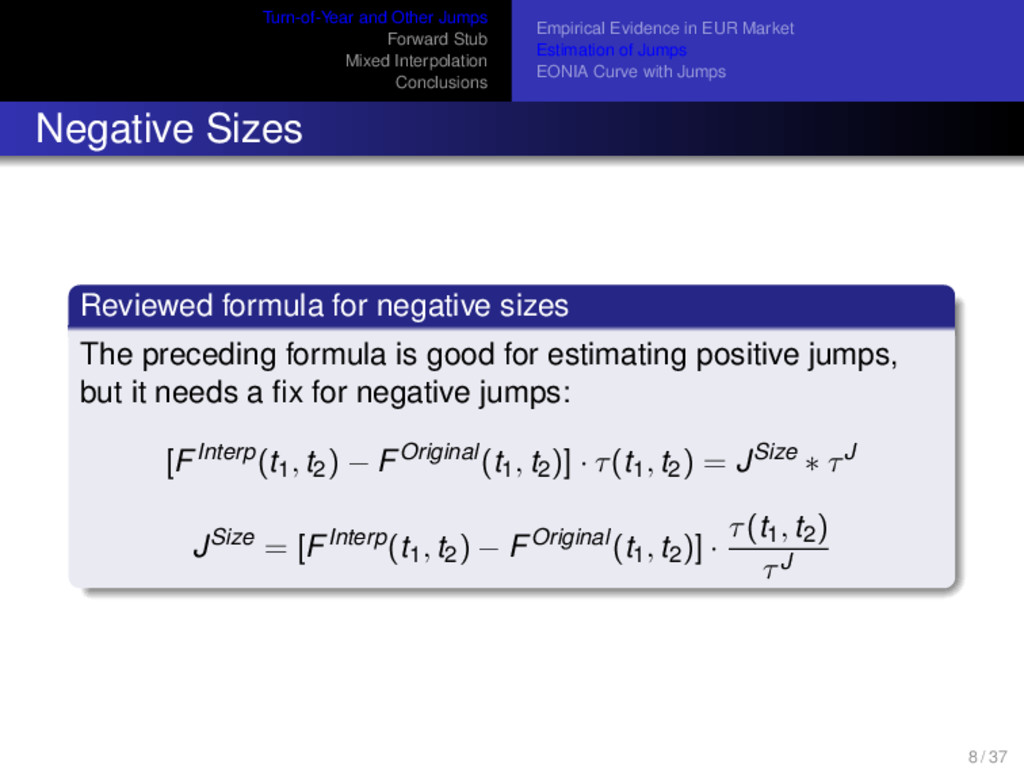
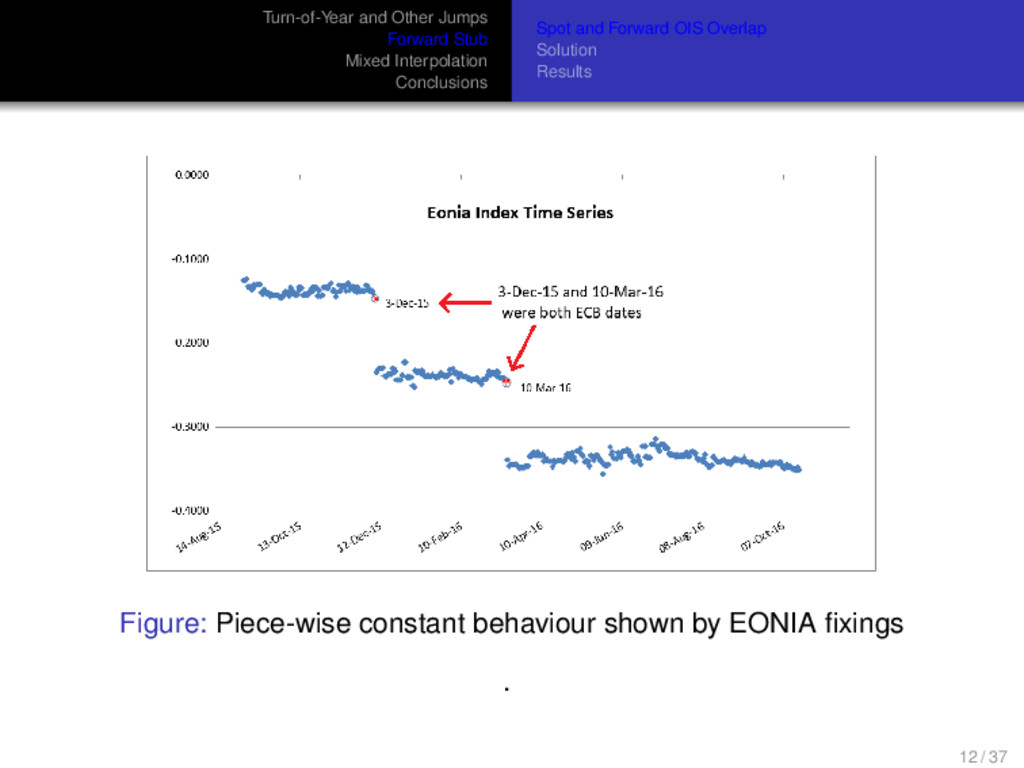
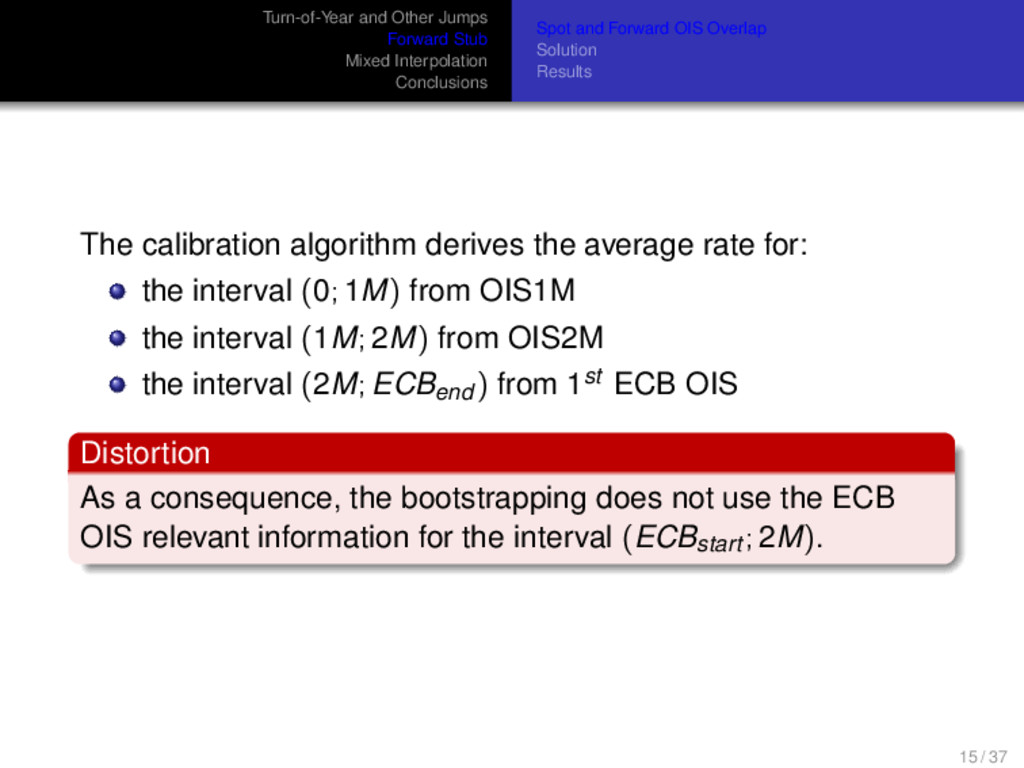
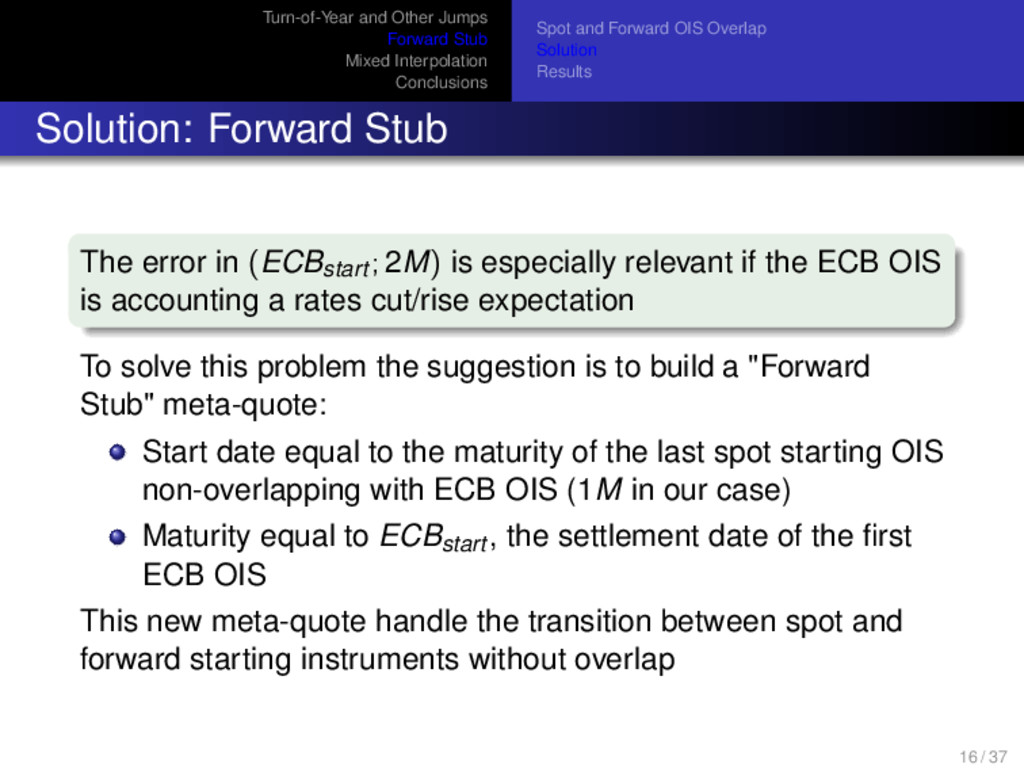
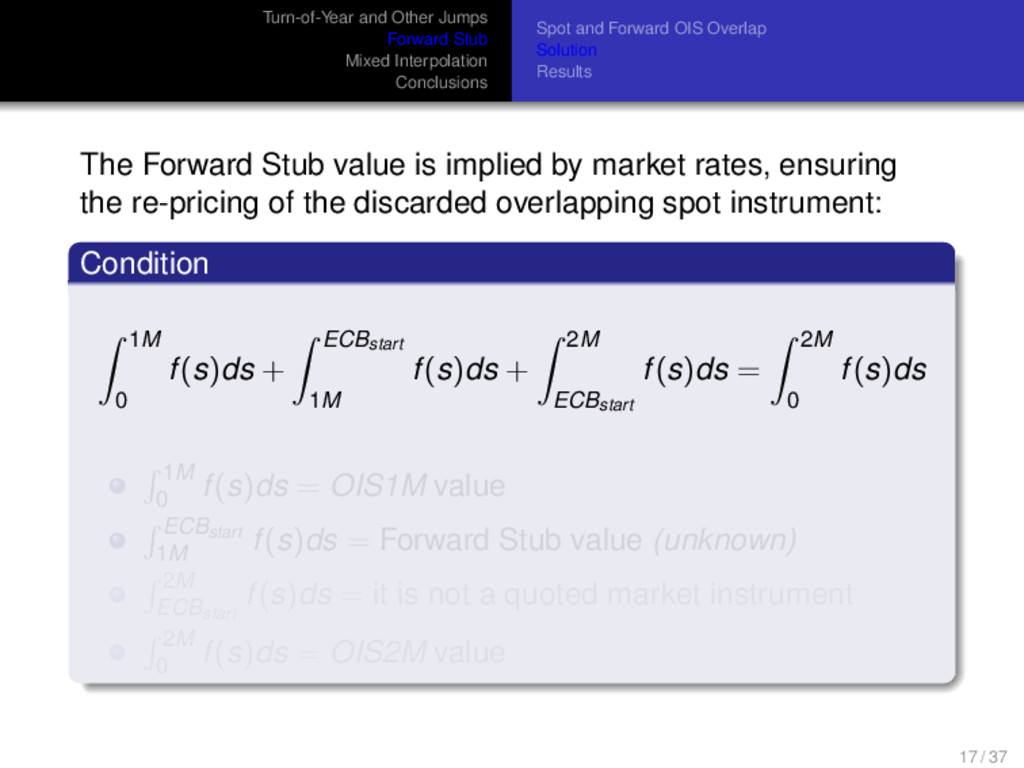
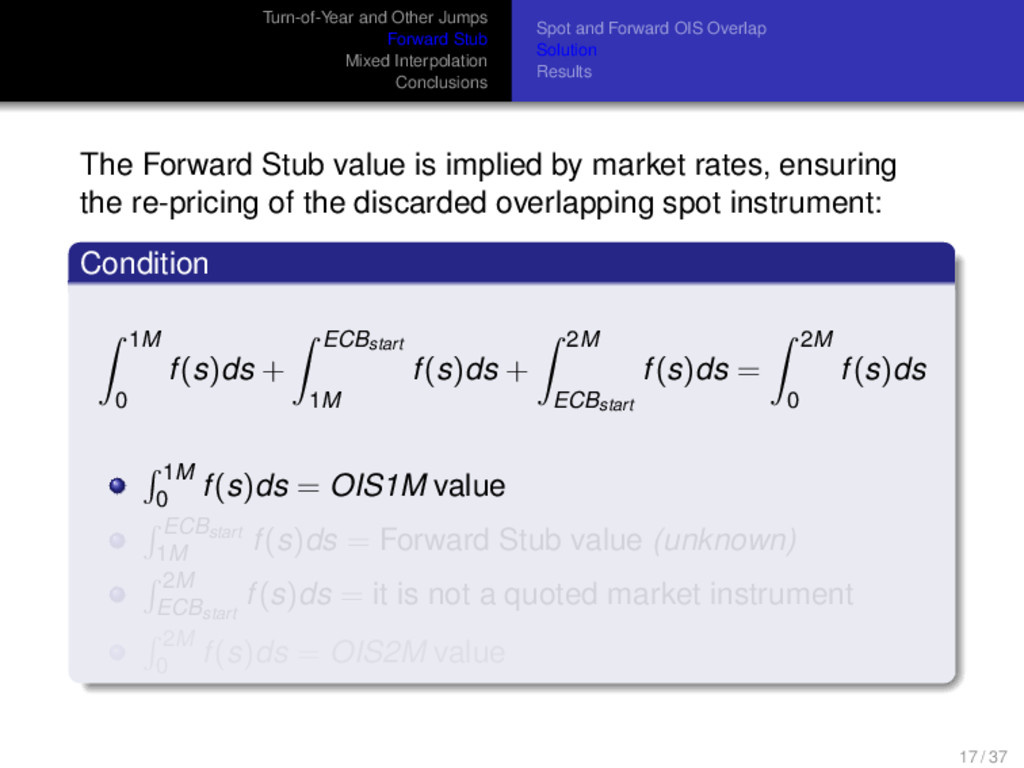
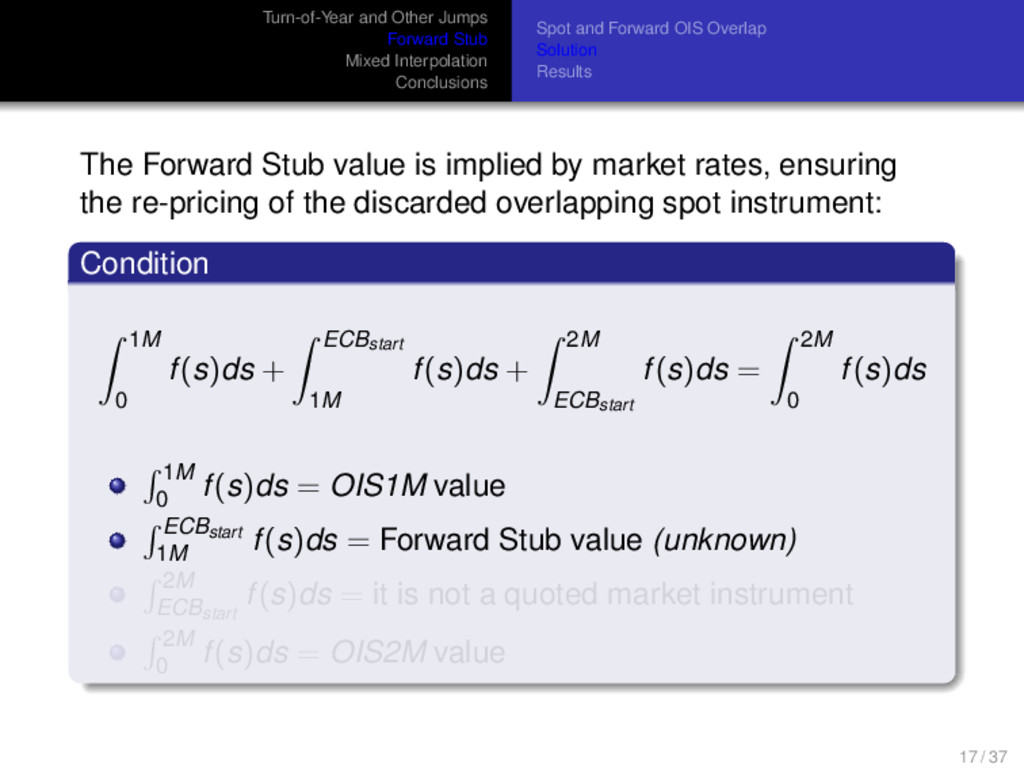
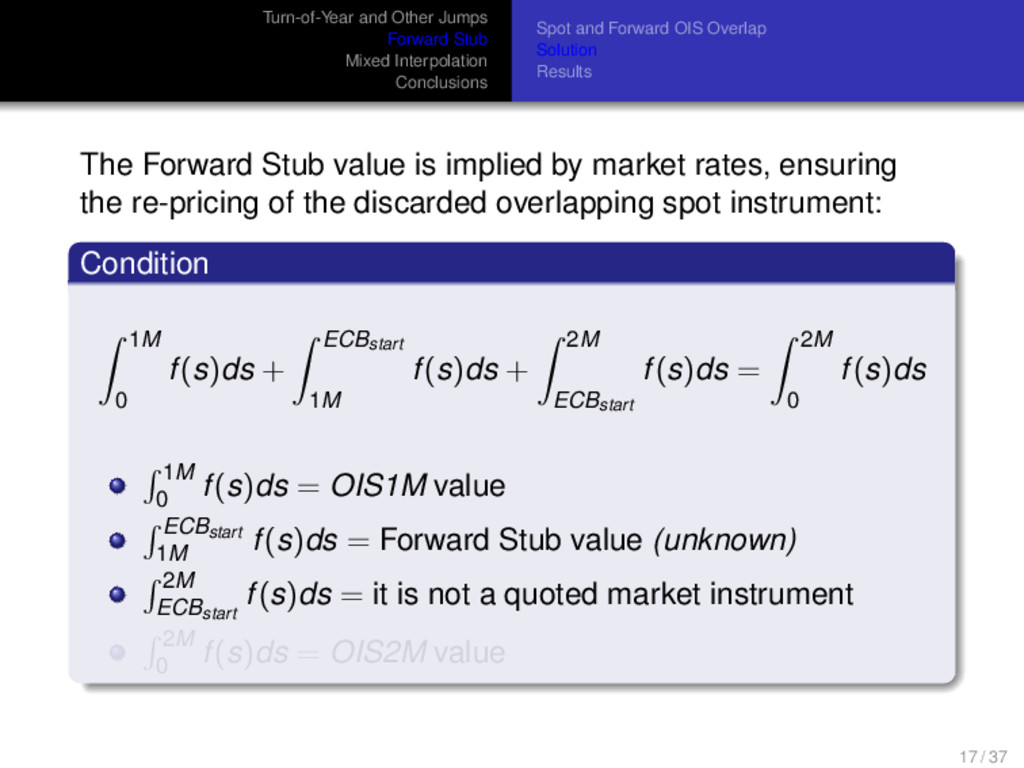
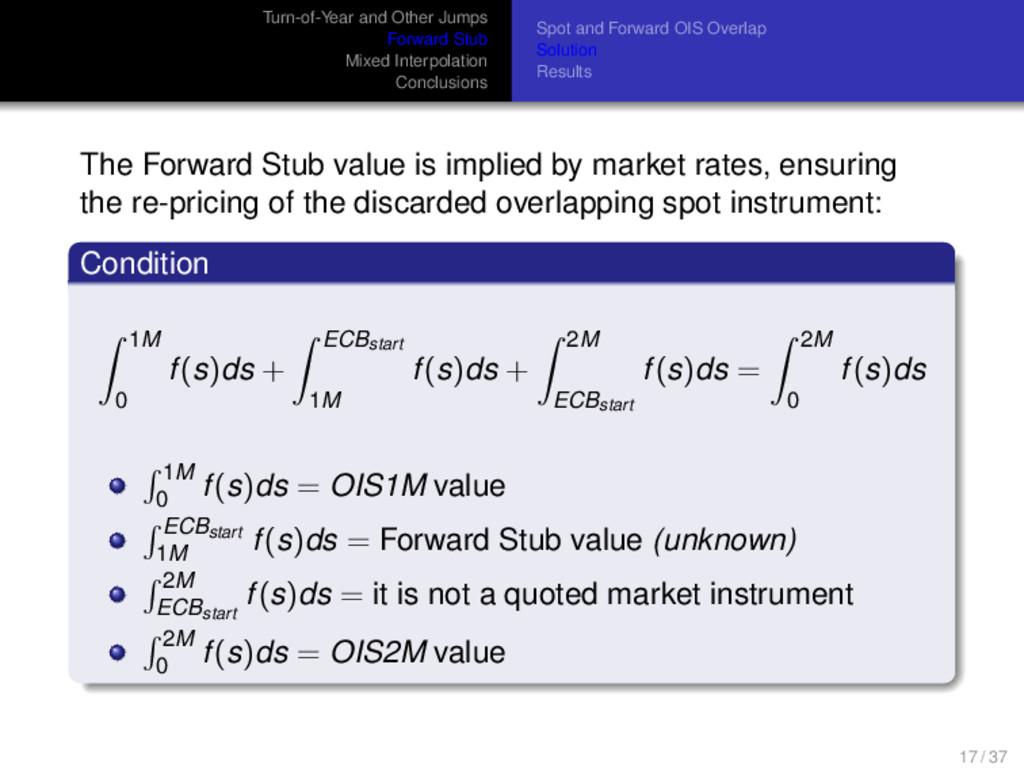
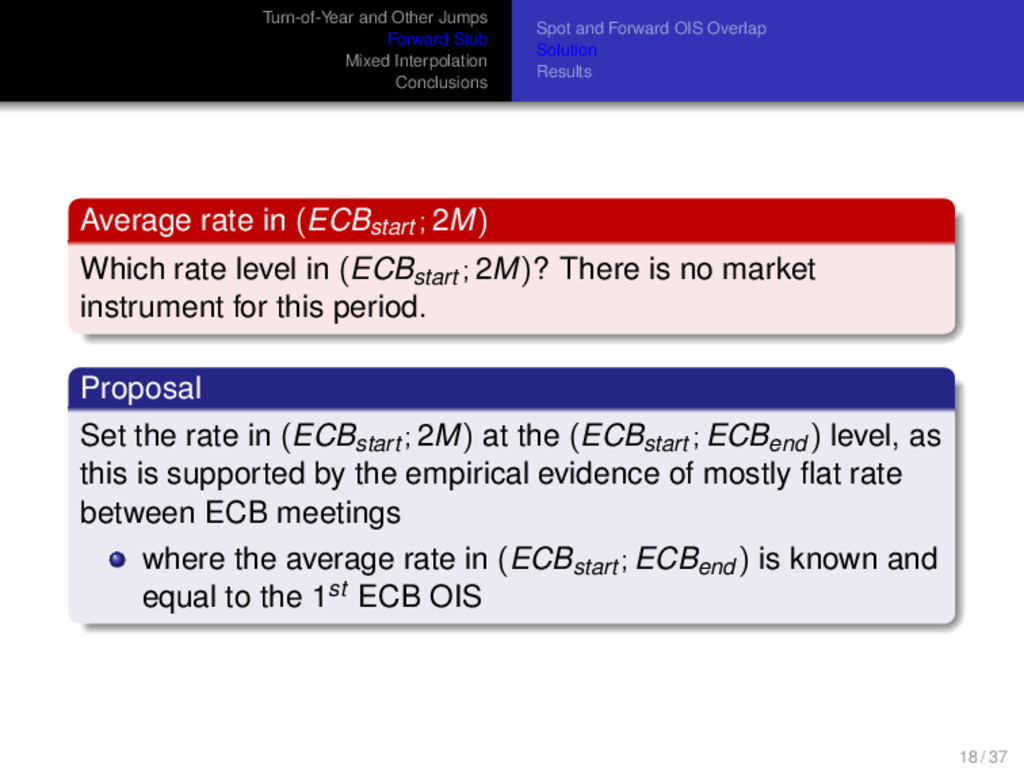
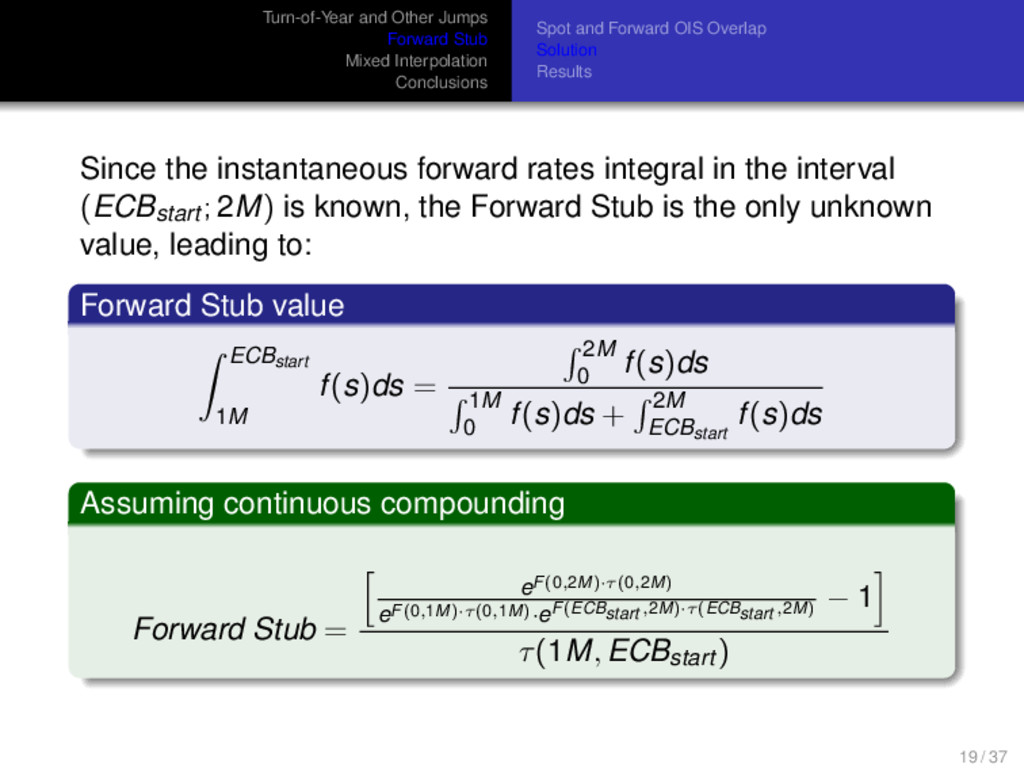
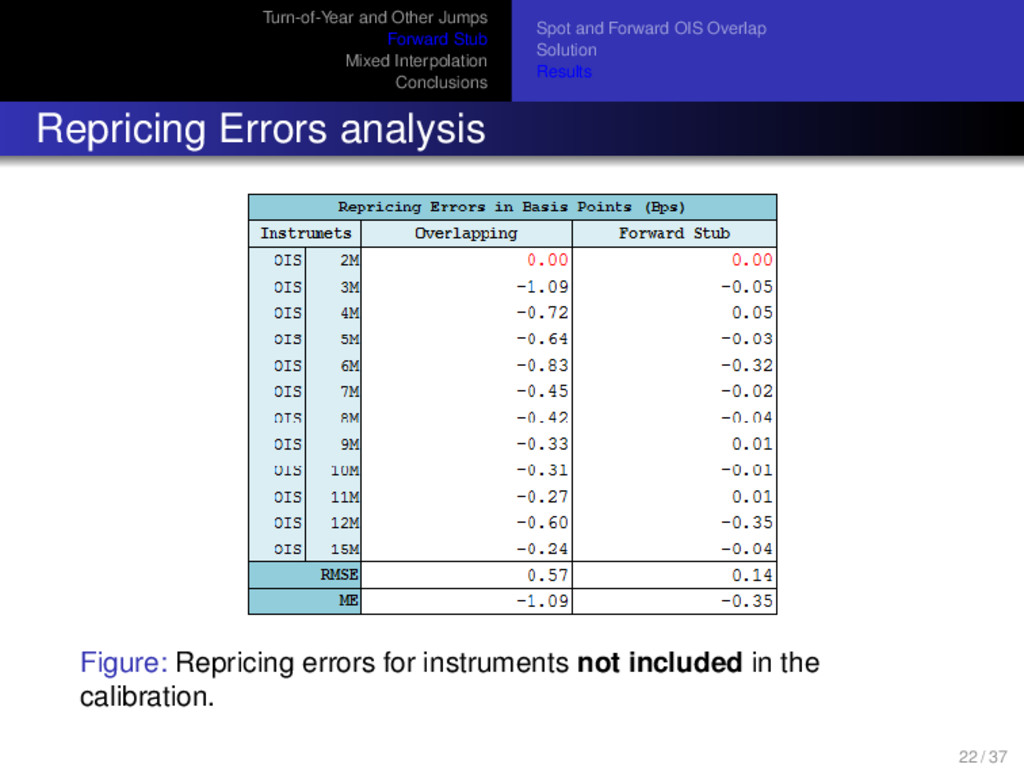
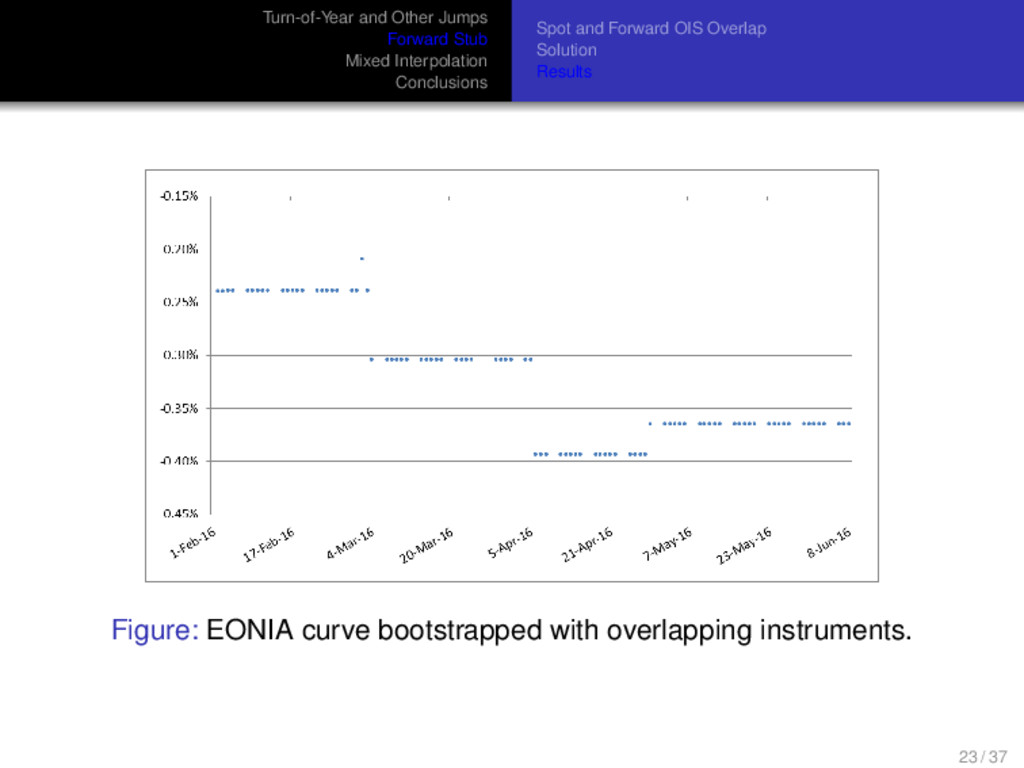
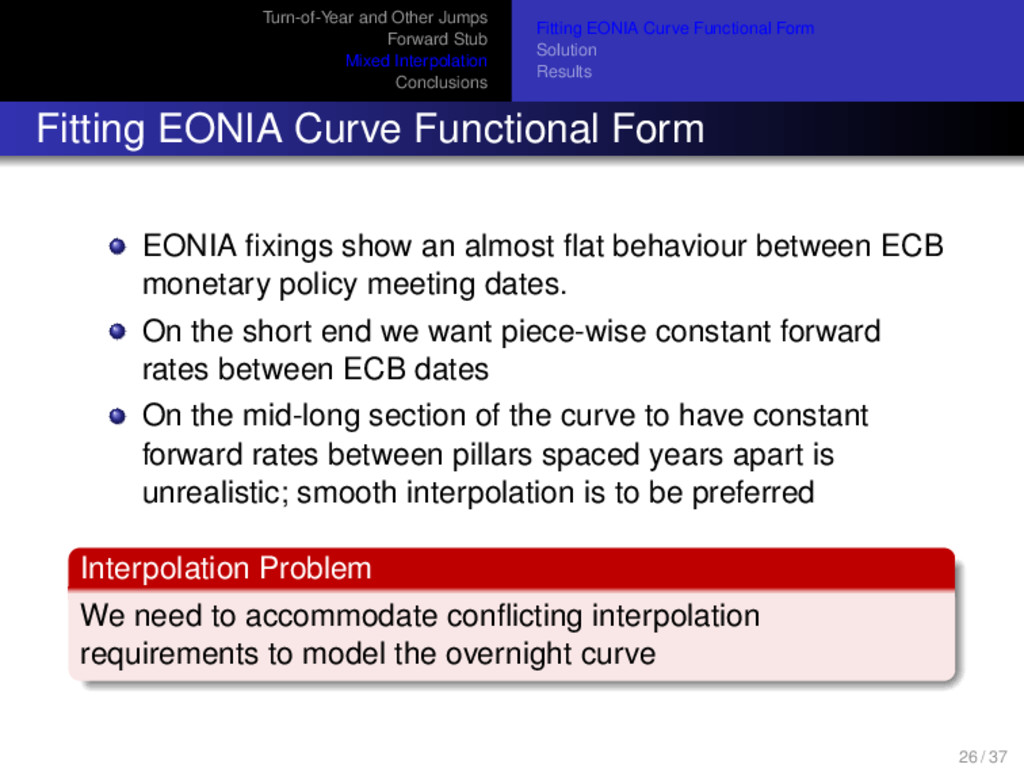
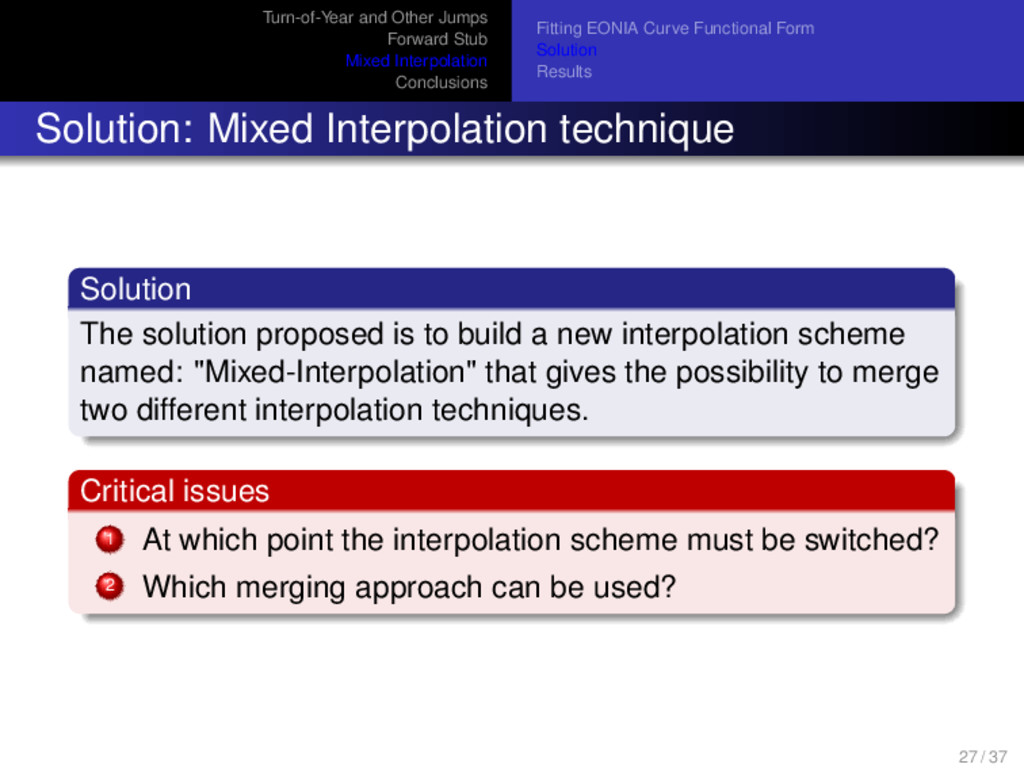
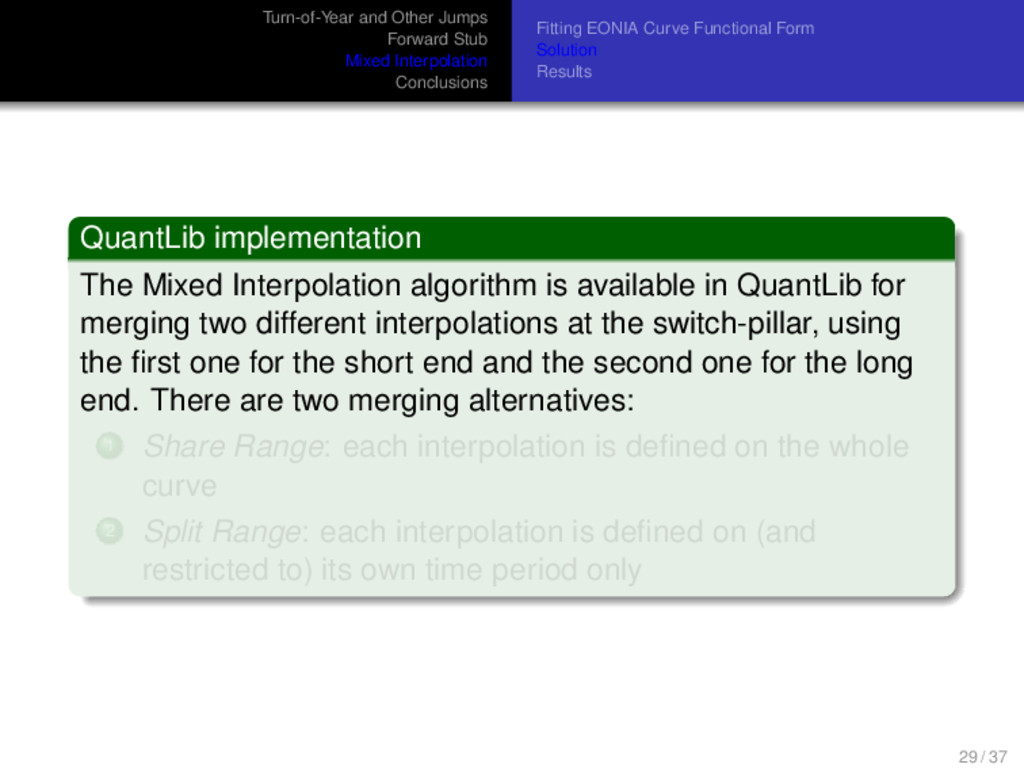
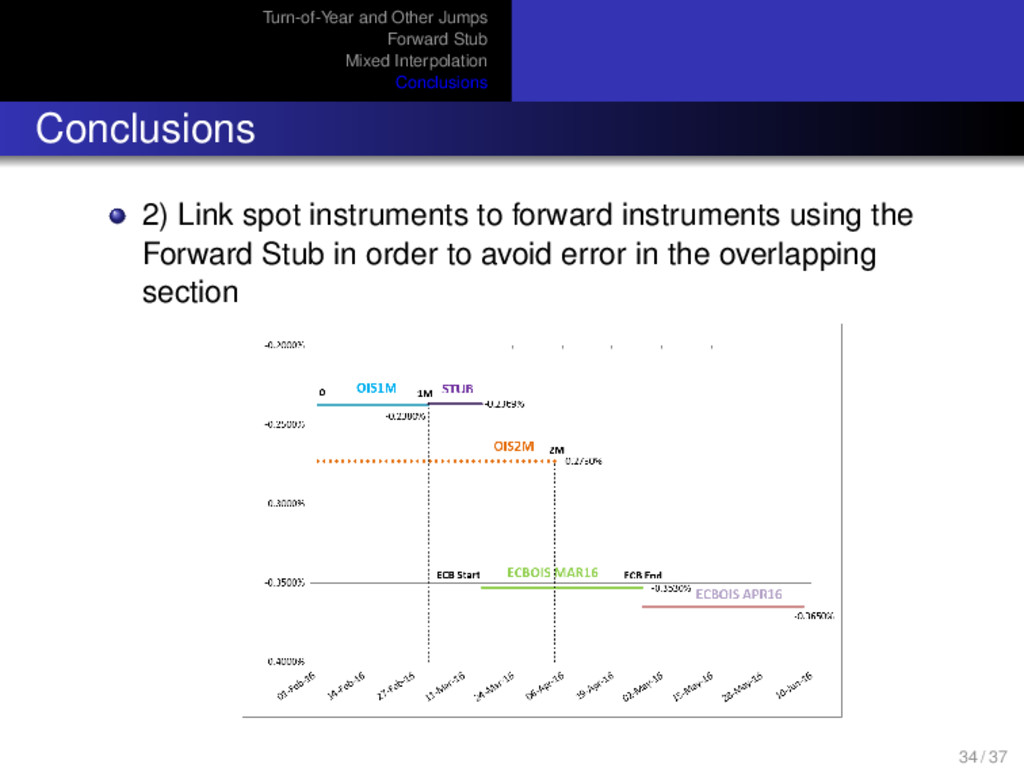
This work analyzes and proposes solutions for subtle, but relevant, problems related to the EONIA curve calibration. The first issue examined is how to deal with jumps and turn-of-year effects. The second point is related to the problem caused by imperfect concatenation between spot starting OIS and forward starting ECB dated OIS: in order to avoid distortion, a meta-instrument called "Forward Stub" shoud cover the section between the maturity of the last spot starting OIS and the settlement of the first ECB OIS. Its implied value can be derived assuming a no-arbitrage conditions. The final issue is the empirical evidence that the forward overnight rates are generally constant between ECB monetary policy board meeting dates: because of this, a log-linear discount interpolation is a good fit. Anyway, flat forward rates are hardly realistic on the long end. This is the rationale to suggest the use of a "Mixed Interpolation" which merges two different interpolation regimes. All the algorithms used to perform the analysis are implemented in the open-source QuantLib project.

Ferdinando M. Ametrano

December 07, 2016
Tweet

Transcript

  1. Advanced EONIA Curve Calibration Avoiding unwanted shape oscillation in EUR

    overnight curve Ferdinando M. Ametrano1, Nicholas Bertocchi2, Paolo Mazzocchi3 [email protected], Banca IMI [email protected], Banca IMI [email protected], Deloitte QuantLib User Meeting, Düsseldorf, 7 December 2016 https://ssrn.com/abstract=2881445
  2. Turn-of-Year and Other Jumps Forward Stub Mixed Interpolation Conclusions Table

    of Contents 1 Turn-of-Year and Other Jumps Empirical Evidence in EUR Market Estimation of Jumps EONIA Curve with Jumps 2 Forward Stub Spot and Forward OIS Overlap Solution Results 3 Mixed Interpolation Fitting EONIA Curve Functional Form Solution Results 4 Conclusions 2 / 37
  3. Turn-of-Year and Other Jumps Forward Stub Mixed Interpolation Conclusions Empirical

    Evidence in EUR Market Estimation of Jumps EONIA Curve with Jumps Table of Contents 1 Turn-of-Year and Other Jumps Empirical Evidence in EUR Market Estimation of Jumps EONIA Curve with Jumps 2 Forward Stub Spot and Forward OIS Overlap Solution Results 3 Mixed Interpolation Fitting EONIA Curve Functional Form Solution Results 4 Conclusions 3 / 37
  4. Turn-of-Year and Other Jumps Forward Stub Mixed Interpolation Conclusions Empirical

    Evidence in EUR Market Estimation of Jumps EONIA Curve with Jumps Empirical Evidence in EUR Market Bootstrapping quality is usually measured by the smoothness of forward rates For even the best interpolation scheme to be effective, market jumps must be removed before calibration, then added back at the end of the process The most relevant rate jump is related to the Turn-Of-Year (TOY) A rate jump is usually related to increased liquidity demand because of end-of-month or end-of-year requirements. 4 / 37
  5. Turn-of-Year and Other Jumps Forward Stub Mixed Interpolation Conclusions Empirical

    Evidence in EUR Market Estimation of Jumps EONIA Curve with Jumps Figure: December 2014 EONIA Index turn-of-year 5 / 37
  6. Turn-of-Year and Other Jumps Forward Stub Mixed Interpolation Conclusions Empirical

    Evidence in EUR Market Estimation of Jumps EONIA Curve with Jumps The U.S. market case However, previous definition does not work for the negative jumps observed for the USD Fed Funds rate Figure: Fed Funds fixing, source: Bloomberg Terminal. 6 / 37
  7. Turn-of-Year and Other Jumps Forward Stub Mixed Interpolation Conclusions Empirical

    Evidence in EUR Market Estimation of Jumps EONIA Curve with Jumps Jump estimation methodology In order to estimate jump sizes, Ametrano-Mazzocchi[1] propose a 4-step approach inspired by Burghardt [1]: 1 Build an overnight curve using a linear/flat interpolation, including all liquid market instruments 2 The first segment out of line with the preceding and following ones can be put back in line dumping the difference into a jump effect. For positive sizes: [Foriginal(t1, t2) − Finterp(t1, t2)] · τ(t1, t2) = JSize ∗ τJ 3 Handle the jump as exogenous multiplicative coefficient for all discount factors after the jump date 4 Iterate ad libitum 2 and 3 for subsequent jump dates. 7 / 37
  8. Turn-of-Year and Other Jumps Forward Stub Mixed Interpolation Conclusions Empirical

    Evidence in EUR Market Estimation of Jumps EONIA Curve with Jumps Jump estimation methodology In order to estimate jump sizes, Ametrano-Mazzocchi[1] propose a 4-step approach inspired by Burghardt [1]: 1 Build an overnight curve using a linear/flat interpolation, including all liquid market instruments 2 The first segment out of line with the preceding and following ones can be put back in line dumping the difference into a jump effect. For positive sizes: [Foriginal(t1, t2) − Finterp(t1, t2)] · τ(t1, t2) = JSize ∗ τJ 3 Handle the jump as exogenous multiplicative coefficient for all discount factors after the jump date 4 Iterate ad libitum 2 and 3 for subsequent jump dates. 7 / 37
  9. Turn-of-Year and Other Jumps Forward Stub Mixed Interpolation Conclusions Empirical

    Evidence in EUR Market Estimation of Jumps EONIA Curve with Jumps Jump estimation methodology In order to estimate jump sizes, Ametrano-Mazzocchi[1] propose a 4-step approach inspired by Burghardt [1]: 1 Build an overnight curve using a linear/flat interpolation, including all liquid market instruments 2 The first segment out of line with the preceding and following ones can be put back in line dumping the difference into a jump effect. For positive sizes: [Foriginal(t1, t2) − Finterp(t1, t2)] · τ(t1, t2) = JSize ∗ τJ 3 Handle the jump as exogenous multiplicative coefficient for all discount factors after the jump date 4 Iterate ad libitum 2 and 3 for subsequent jump dates. 7 / 37
  10. Turn-of-Year and Other Jumps Forward Stub Mixed Interpolation Conclusions Empirical

    Evidence in EUR Market Estimation of Jumps EONIA Curve with Jumps Jump estimation methodology In order to estimate jump sizes, Ametrano-Mazzocchi[1] propose a 4-step approach inspired by Burghardt [1]: 1 Build an overnight curve using a linear/flat interpolation, including all liquid market instruments 2 The first segment out of line with the preceding and following ones can be put back in line dumping the difference into a jump effect. For positive sizes: [Foriginal(t1, t2) − Finterp(t1, t2)] · τ(t1, t2) = JSize ∗ τJ 3 Handle the jump as exogenous multiplicative coefficient for all discount factors after the jump date 4 Iterate ad libitum 2 and 3 for subsequent jump dates. 7 / 37
  11. Turn-of-Year and Other Jumps Forward Stub Mixed Interpolation Conclusions Empirical

    Evidence in EUR Market Estimation of Jumps EONIA Curve with Jumps Jump estimation methodology In order to estimate jump sizes, Ametrano-Mazzocchi[1] propose a 4-step approach inspired by Burghardt [1]: 1 Build an overnight curve using a linear/flat interpolation, including all liquid market instruments 2 The first segment out of line with the preceding and following ones can be put back in line dumping the difference into a jump effect. For positive sizes: [Foriginal(t1, t2) − Finterp(t1, t2)] · τ(t1, t2) = JSize ∗ τJ 3 Handle the jump as exogenous multiplicative coefficient for all discount factors after the jump date 4 Iterate ad libitum 2 and 3 for subsequent jump dates. 7 / 37
  12. Turn-of-Year and Other Jumps Forward Stub Mixed Interpolation Conclusions Empirical

    Evidence in EUR Market Estimation of Jumps EONIA Curve with Jumps Negative Sizes Reviewed formula for negative sizes The preceding formula is good for estimating positive jumps, but it needs a fix for negative jumps: [FInterp(t1, t2) − FOriginal(t1, t2)] · τ(t1, t2) = JSize ∗ τJ JSize = [FInterp(t1, t2) − FOriginal(t1, t2)] · τ(t1, t2) τJ 8 / 37
  13. Turn-of-Year and Other Jumps Forward Stub Mixed Interpolation Conclusions Empirical

    Evidence in EUR Market Estimation of Jumps EONIA Curve with Jumps EONIA and USD Overnight Curves Including Jumps The resulting EONIA and USD overnight curves including jumps estimated through the preceding approach are shown in Figure 3 and 4 Figure: Eonia curve short end with estimated positive jumps. 9 / 37
  14. Turn-of-Year and Other Jumps Forward Stub Mixed Interpolation Conclusions Empirical

    Evidence in EUR Market Estimation of Jumps EONIA Curve with Jumps EONIA and USD Overnight Curves Including Jumps Figure: USDON curve short end with estimated negative jumps. 10 / 37
  15. Turn-of-Year and Other Jumps Forward Stub Mixed Interpolation Conclusions Spot

    and Forward OIS Overlap Solution Results Table of Contents 1 Turn-of-Year and Other Jumps Empirical Evidence in EUR Market Estimation of Jumps EONIA Curve with Jumps 2 Forward Stub Spot and Forward OIS Overlap Solution Results 3 Mixed Interpolation Fitting EONIA Curve Functional Form Solution Results 4 Conclusions 11 / 37
  16. Turn-of-Year and Other Jumps Forward Stub Mixed Interpolation Conclusions Spot

    and Forward OIS Overlap Solution Results Figure: Piece-wise constant behaviour shown by EONIA fixings . 12 / 37
  17. Turn-of-Year and Other Jumps Forward Stub Mixed Interpolation Conclusions Spot

    and Forward OIS Overlap Solution Results Spot and Forward OIS Overlap When mixing spot starting OIS (Overnight Indexed Swaps) and forward starting ECB OIS (European Central Bank OIS), the ECB OIS are preferred because of their greater liquidity. Imperfect Concatenation In the bootstrapping of EONIA curve the sequential inclusion of a spot starting instrument is performed without knowledge of the forthcoming forward starting instrument, whose information content is more relevant for the overlapping section, as visible in Figure 6. 13 / 37
  18. Turn-of-Year and Other Jumps Forward Stub Mixed Interpolation Conclusions Spot

    and Forward OIS Overlap Solution Results Figure: Overlapping EONIA instruments levels; dataset as of January 29, 2016 . 14 / 37
  19. Turn-of-Year and Other Jumps Forward Stub Mixed Interpolation Conclusions Spot

    and Forward OIS Overlap Solution Results The calibration algorithm derives the average rate for: the interval (0; 1M) from OIS1M the interval (1M; 2M) from OIS2M the interval (2M; ECBend ) from 1st ECB OIS Distortion As a consequence, the bootstrapping does not use the ECB OIS relevant information for the interval (ECBstart ; 2M). 15 / 37
  20. Turn-of-Year and Other Jumps Forward Stub Mixed Interpolation Conclusions Spot

    and Forward OIS Overlap Solution Results Solution: Forward Stub The error in (ECBstart ; 2M) is especially relevant if the ECB OIS is accounting a rates cut/rise expectation To solve this problem the suggestion is to build a "Forward Stub" meta-quote: Start date equal to the maturity of the last spot starting OIS non-overlapping with ECB OIS (1M in our case) Maturity equal to ECBstart , the settlement date of the first ECB OIS This new meta-quote handle the transition between spot and forward starting instruments without overlap 16 / 37
  21. Turn-of-Year and Other Jumps Forward Stub Mixed Interpolation Conclusions Spot

    and Forward OIS Overlap Solution Results The Forward Stub value is implied by market rates, ensuring the re-pricing of the discarded overlapping spot instrument: Condition 1M 0 f(s)ds + ECBstart 1M f(s)ds + 2M ECBstart f(s)ds = 2M 0 f(s)ds 1M 0 f(s)ds = OIS1M value ECBstart 1M f(s)ds = Forward Stub value (unknown) 2M ECBstart f(s)ds = it is not a quoted market instrument 2M 0 f(s)ds = OIS2M value 17 / 37
  22. Turn-of-Year and Other Jumps Forward Stub Mixed Interpolation Conclusions Spot

    and Forward OIS Overlap Solution Results The Forward Stub value is implied by market rates, ensuring the re-pricing of the discarded overlapping spot instrument: Condition 1M 0 f(s)ds + ECBstart 1M f(s)ds + 2M ECBstart f(s)ds = 2M 0 f(s)ds 1M 0 f(s)ds = OIS1M value ECBstart 1M f(s)ds = Forward Stub value (unknown) 2M ECBstart f(s)ds = it is not a quoted market instrument 2M 0 f(s)ds = OIS2M value 17 / 37
  23. Turn-of-Year and Other Jumps Forward Stub Mixed Interpolation Conclusions Spot

    and Forward OIS Overlap Solution Results The Forward Stub value is implied by market rates, ensuring the re-pricing of the discarded overlapping spot instrument: Condition 1M 0 f(s)ds + ECBstart 1M f(s)ds + 2M ECBstart f(s)ds = 2M 0 f(s)ds 1M 0 f(s)ds = OIS1M value ECBstart 1M f(s)ds = Forward Stub value (unknown) 2M ECBstart f(s)ds = it is not a quoted market instrument 2M 0 f(s)ds = OIS2M value 17 / 37
  24. Turn-of-Year and Other Jumps Forward Stub Mixed Interpolation Conclusions Spot

    and Forward OIS Overlap Solution Results The Forward Stub value is implied by market rates, ensuring the re-pricing of the discarded overlapping spot instrument: Condition 1M 0 f(s)ds + ECBstart 1M f(s)ds + 2M ECBstart f(s)ds = 2M 0 f(s)ds 1M 0 f(s)ds = OIS1M value ECBstart 1M f(s)ds = Forward Stub value (unknown) 2M ECBstart f(s)ds = it is not a quoted market instrument 2M 0 f(s)ds = OIS2M value 17 / 37
  25. Turn-of-Year and Other Jumps Forward Stub Mixed Interpolation Conclusions Spot

    and Forward OIS Overlap Solution Results The Forward Stub value is implied by market rates, ensuring the re-pricing of the discarded overlapping spot instrument: Condition 1M 0 f(s)ds + ECBstart 1M f(s)ds + 2M ECBstart f(s)ds = 2M 0 f(s)ds 1M 0 f(s)ds = OIS1M value ECBstart 1M f(s)ds = Forward Stub value (unknown) 2M ECBstart f(s)ds = it is not a quoted market instrument 2M 0 f(s)ds = OIS2M value 17 / 37
  26. Turn-of-Year and Other Jumps Forward Stub Mixed Interpolation Conclusions Spot

    and Forward OIS Overlap Solution Results Average rate in (ECBstart ; 2M) Which rate level in (ECBstart ; 2M)? There is no market instrument for this period. Proposal Set the rate in (ECBstart ; 2M) at the (ECBstart ; ECBend ) level, as this is supported by the empirical evidence of mostly flat rate between ECB meetings where the average rate in (ECBstart ; ECBend ) is known and equal to the 1st ECB OIS 18 / 37
  27. Turn-of-Year and Other Jumps Forward Stub Mixed Interpolation Conclusions Spot

    and Forward OIS Overlap Solution Results Since the instantaneous forward rates integral in the interval (ECBstart ; 2M) is known, the Forward Stub is the only unknown value, leading to: Forward Stub value ECBstart 1M f(s)ds = 2M 0 f(s)ds 1M 0 f(s)ds + 2M ECBstart f(s)ds Assuming continuous compounding Forward Stub = eF(0,2M)·τ(0,2M) eF(0,1M)·τ(0,1M)·eF(ECBstart ,2M)·τ(ECBstart ,2M) − 1 τ(1M, ECBstart ) 19 / 37
  28. Turn-of-Year and Other Jumps Forward Stub Mixed Interpolation Conclusions Spot

    and Forward OIS Overlap Solution Results Figure: EONIA levels including the Forward Stub. 20 / 37
  29. Turn-of-Year and Other Jumps Forward Stub Mixed Interpolation Conclusions Spot

    and Forward OIS Overlap Solution Results The Forward Stub algorithm is stable also in the limiting case of becoming a Spot Stub. Spot Stub In particular calendar conditions, the discarded spot instrument might be the 1W OIS, making the Forward Stub actually spot starting: τ(0, ECBstart ) (where ECBstart is the 1st ECB OIS fixing date) Spot Stub value The Spot Stub value can be derived using the following formula: Spot Stub = eF(0,ECBend )·τ(0,ECBend ) eF(ECBstart ,ECBend )·τ(ECBstart ,ECBend ) − 1 τ(0, ECBstart ) 21 / 37
  30. Turn-of-Year and Other Jumps Forward Stub Mixed Interpolation Conclusions Spot

    and Forward OIS Overlap Solution Results Repricing Errors analysis Figure: Repricing errors for instruments not included in the calibration. 22 / 37
  31. Turn-of-Year and Other Jumps Forward Stub Mixed Interpolation Conclusions Spot

    and Forward OIS Overlap Solution Results Figure: EONIA curve bootstrapped with overlapping instruments. 23 / 37
  32. Turn-of-Year and Other Jumps Forward Stub Mixed Interpolation Conclusions Spot

    and Forward OIS Overlap Solution Results Figure: EONIA curve bootstrapped including the Forward Stub. 24 / 37
  33. Turn-of-Year and Other Jumps Forward Stub Mixed Interpolation Conclusions Fitting

    EONIA Curve Functional Form Solution Results Table of Contents 1 Turn-of-Year and Other Jumps Empirical Evidence in EUR Market Estimation of Jumps EONIA Curve with Jumps 2 Forward Stub Spot and Forward OIS Overlap Solution Results 3 Mixed Interpolation Fitting EONIA Curve Functional Form Solution Results 4 Conclusions 25 / 37
  34. Turn-of-Year and Other Jumps Forward Stub Mixed Interpolation Conclusions Fitting

    EONIA Curve Functional Form Solution Results Fitting EONIA Curve Functional Form EONIA fixings show an almost flat behaviour between ECB monetary policy meeting dates. On the short end we want piece-wise constant forward rates between ECB dates On the mid-long section of the curve to have constant forward rates between pillars spaced years apart is unrealistic; smooth interpolation is to be preferred Interpolation Problem We need to accommodate conflicting interpolation requirements to model the overnight curve 26 / 37
  35. Turn-of-Year and Other Jumps Forward Stub Mixed Interpolation Conclusions Fitting

    EONIA Curve Functional Form Solution Results Solution: Mixed Interpolation technique Solution The solution proposed is to build a new interpolation scheme named: "Mixed-Interpolation" that gives the possibility to merge two different interpolation techniques. Critical issues 1 At which point the interpolation scheme must be switched? 2 Which merging approach can be used? 27 / 37
  36. Turn-of-Year and Other Jumps Forward Stub Mixed Interpolation Conclusions Fitting

    EONIA Curve Functional Form Solution Results Our suggestion Merge a piecewise constant interpolation on the short end (up to the end of the ECB OIS strip) with a monotone cubic Hymana filtered interpolation on the mid-long end. Set the "Switch Pillar" equal to the maturity of the last quoted ECB OIS afor more information see [2] 28 / 37
  37. Turn-of-Year and Other Jumps Forward Stub Mixed Interpolation Conclusions Fitting

    EONIA Curve Functional Form Solution Results QuantLib implementation The Mixed Interpolation algorithm is available in QuantLib for merging two different interpolations at the switch-pillar, using the first one for the short end and the second one for the long end. There are two merging alternatives: 1 Share Range: each interpolation is defined on the whole curve 2 Split Range: each interpolation is defined on (and restricted to) its own time period only 29 / 37
  38. Turn-of-Year and Other Jumps Forward Stub Mixed Interpolation Conclusions Fitting

    EONIA Curve Functional Form Solution Results QuantLib implementation The Mixed Interpolation algorithm is available in QuantLib for merging two different interpolations at the switch-pillar, using the first one for the short end and the second one for the long end. There are two merging alternatives: 1 Share Range: each interpolation is defined on the whole curve 2 Split Range: each interpolation is defined on (and restricted to) its own time period only 29 / 37
  39. Turn-of-Year and Other Jumps Forward Stub Mixed Interpolation Conclusions Fitting

    EONIA Curve Functional Form Solution Results QuantLib implementation The Mixed Interpolation algorithm is available in QuantLib for merging two different interpolations at the switch-pillar, using the first one for the short end and the second one for the long end. There are two merging alternatives: 1 Share Range: each interpolation is defined on the whole curve 2 Split Range: each interpolation is defined on (and restricted to) its own time period only 29 / 37
  40. Turn-of-Year and Other Jumps Forward Stub Mixed Interpolation Conclusions Fitting

    EONIA Curve Functional Form Solution Results Repricing Errors Analysis Figure: Repricing errors for instruments not included in the calibration. 30 / 37
  41. Turn-of-Year and Other Jumps Forward Stub Mixed Interpolation Conclusions Fitting

    EONIA Curve Functional Form Solution Results Figure: A mixed interpolated EONIA curve linearly interpolating log-discounts up to the last ECB OIS and then switching to a monotone log-cubic Hyman filtered interpolation. 31 / 37
  42. Turn-of-Year and Other Jumps Forward Stub Mixed Interpolation Conclusions Table

    of Contents 1 Turn-of-Year and Other Jumps Empirical Evidence in EUR Market Estimation of Jumps EONIA Curve with Jumps 2 Forward Stub Spot and Forward OIS Overlap Solution Results 3 Mixed Interpolation Fitting EONIA Curve Functional Form Solution Results 4 Conclusions 32 / 37
  43. Turn-of-Year and Other Jumps Forward Stub Mixed Interpolation Conclusions Conclusions

    1) Estimate TOYs and other jumps, account them before calibration 33 / 37
  44. Turn-of-Year and Other Jumps Forward Stub Mixed Interpolation Conclusions Conclusions

    2) Link spot instruments to forward instruments using the Forward Stub in order to avoid error in the overlapping section 34 / 37
  45. Turn-of-Year and Other Jumps Forward Stub Mixed Interpolation Conclusions Conclusions

    3) Use a mixed (log) linear-cubic (discount factor) interpolator to account for different requirements on the short and long end of the curve 35 / 37
  46. Turn-of-Year and Other Jumps Forward Stub Mixed Interpolation Conclusions Bibliography

    G. Burghardt, S. Kirshner One good turn, CME Interest Rate Products Advanced Topics. Chicago: Chicago Mercatile Exchange,2002 F.M. Ametrano, L. Ballabio, P. Mazzocchi the abcd of Interest Rate Basis Spreads, SSRN, November 2015. F.M. Ametrano, M. Bianchetti, Everything you always wanted to know about multiple interest rate curve bootstrapping but were afraid to ask, SSRN, February 2013. F.M. Ametrano, M. Bianchetti, Bootstrapping the illiquidity, multiple yield curves construction for market coherent forward rates estimation, SSRN, March 2009. 36 / 37
  47. Turn-of-Year and Other Jumps Forward Stub Mixed Interpolation Conclusions Bibliography

    F.M. Ametrano, P. Mazzocchi, EONIA Jumps and Proper Euribor Forwarding: The Case of Synthetic Deposits in Legacy Discount-Based Systems, https://speakerdeck.com/nando1970/eonia-jumps-and- proper-euribor-forwarding. J.M. Hyman, Accurate monotonicity preserving cubic interpolation, SIAM Journal on scientific and statistical computing, 4(4):645-654, 1983. QuantLib, the free/open-source object oriented c++ financial library, https//:www.quantlib.org/ Y. Iwashita Piecewise Polynomial Interpolations, Quantitative research, OpenGamma, May 2013. 37 / 37