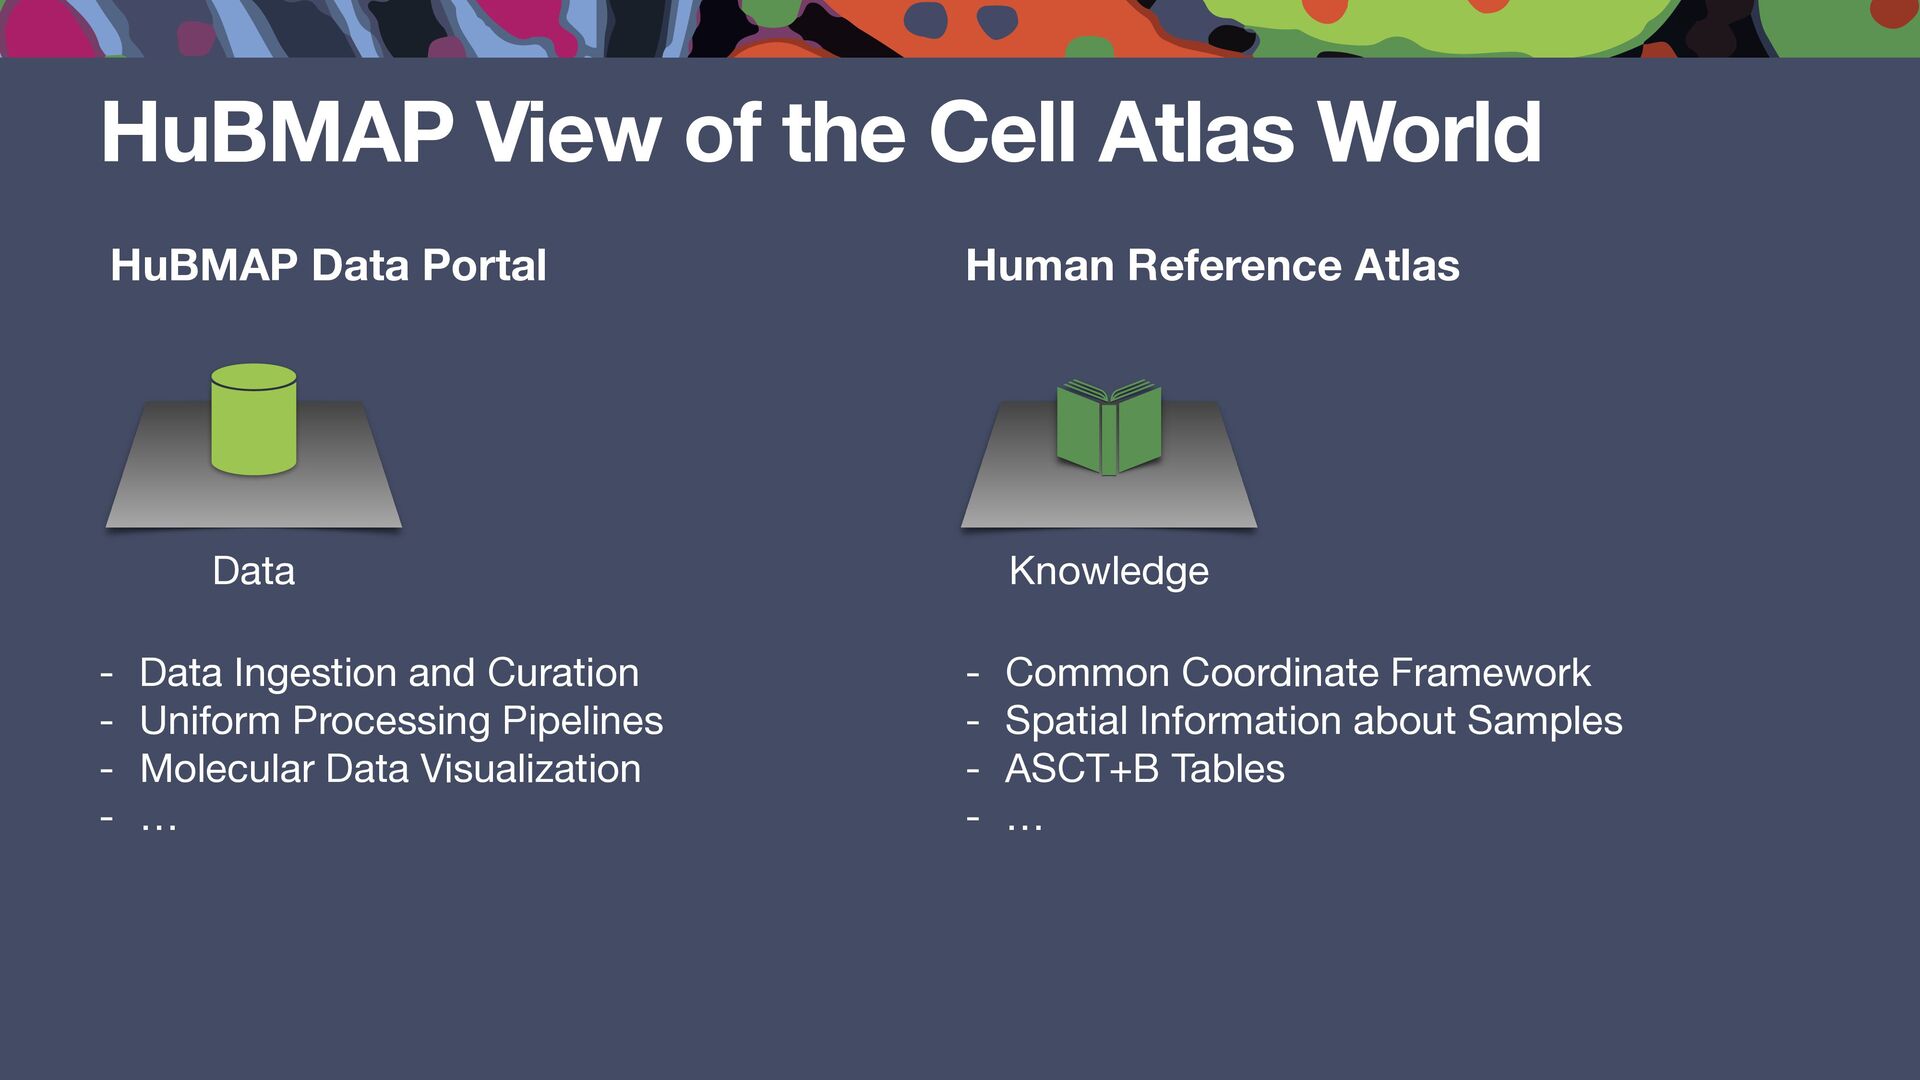
Ingestion and Curation - Uniform Processing Pipelines - Molecular Data Visualization - … - Common Coordinate Framework - Spatial Information about Samples - ASCT+B Tables - … HuBMAP View of the Cell Atlas World
Ingestion and Curation - Uniform Processing Pipelines - Molecular Data Visualization - … - Common Coordinate Framework - Spatial Information about Samples - ASCT+B Tables - … HuBMAP View of the Cell Atlas World
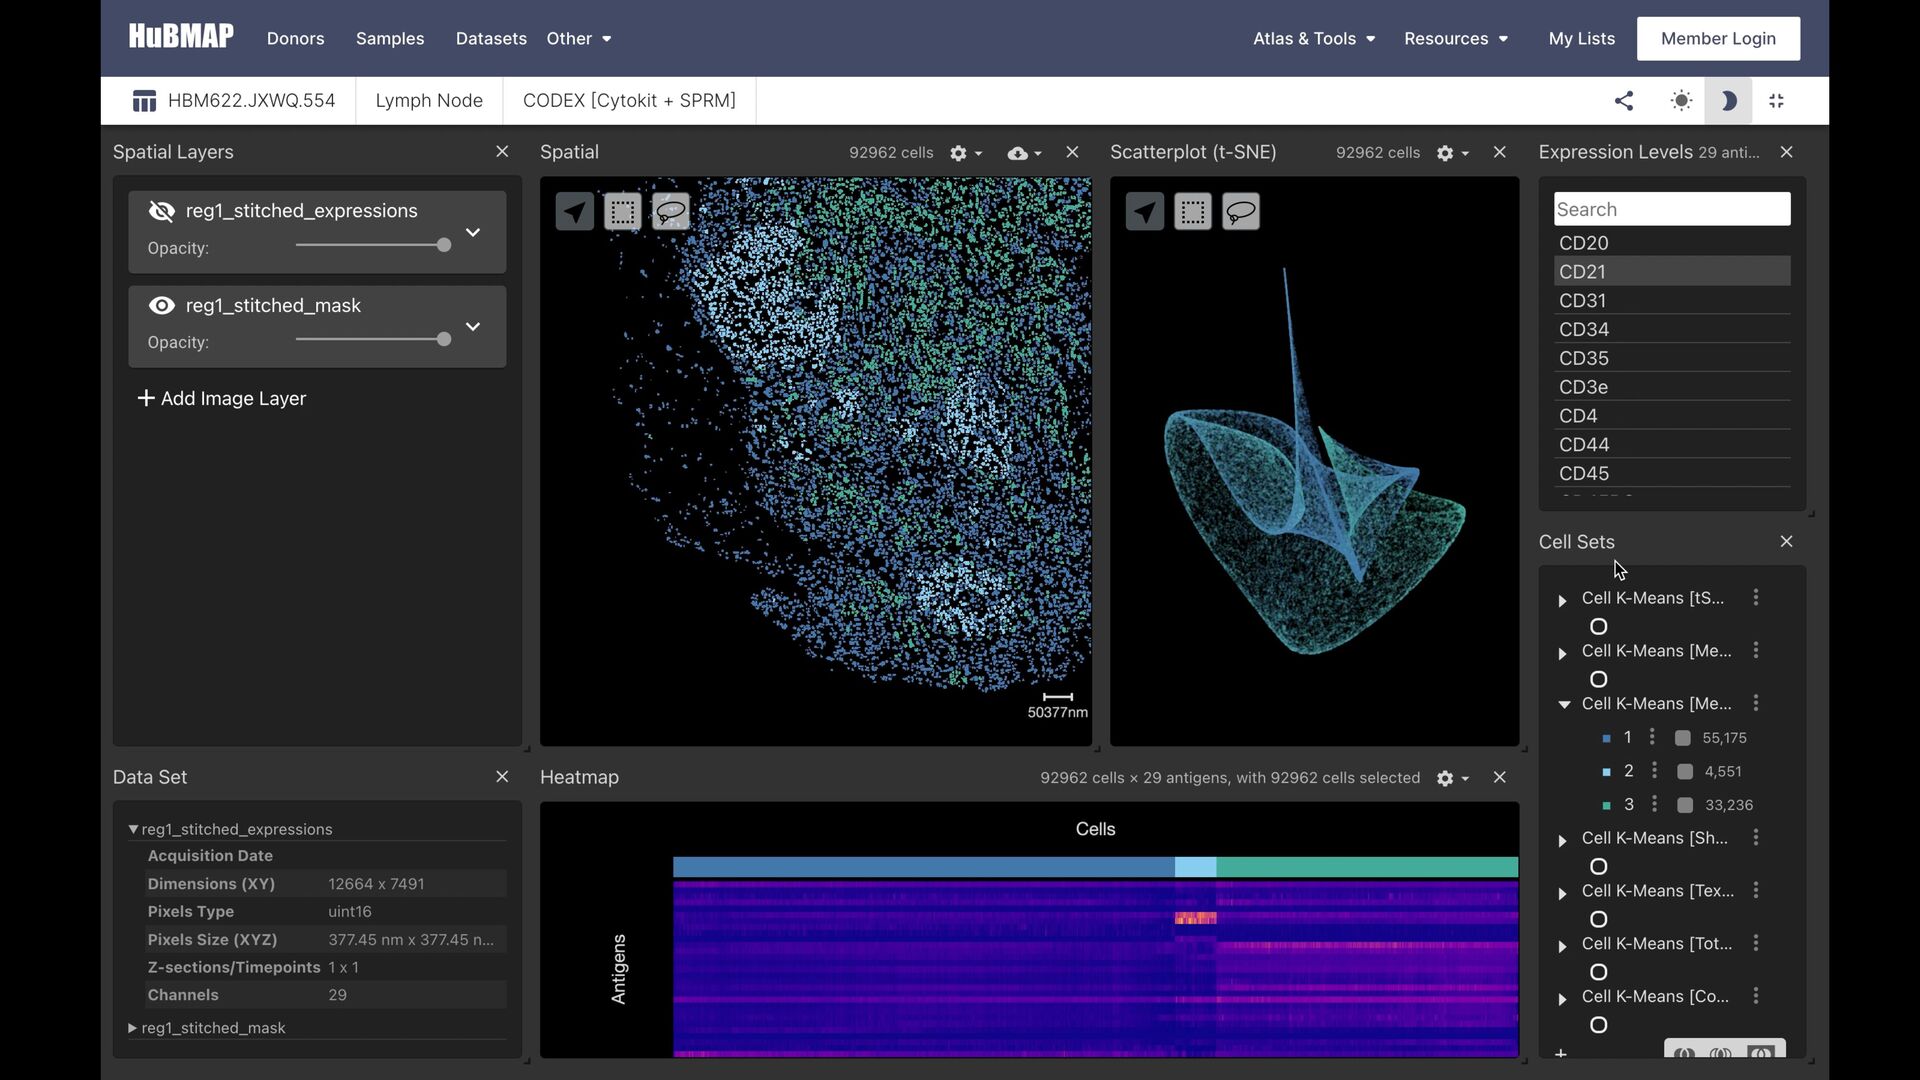
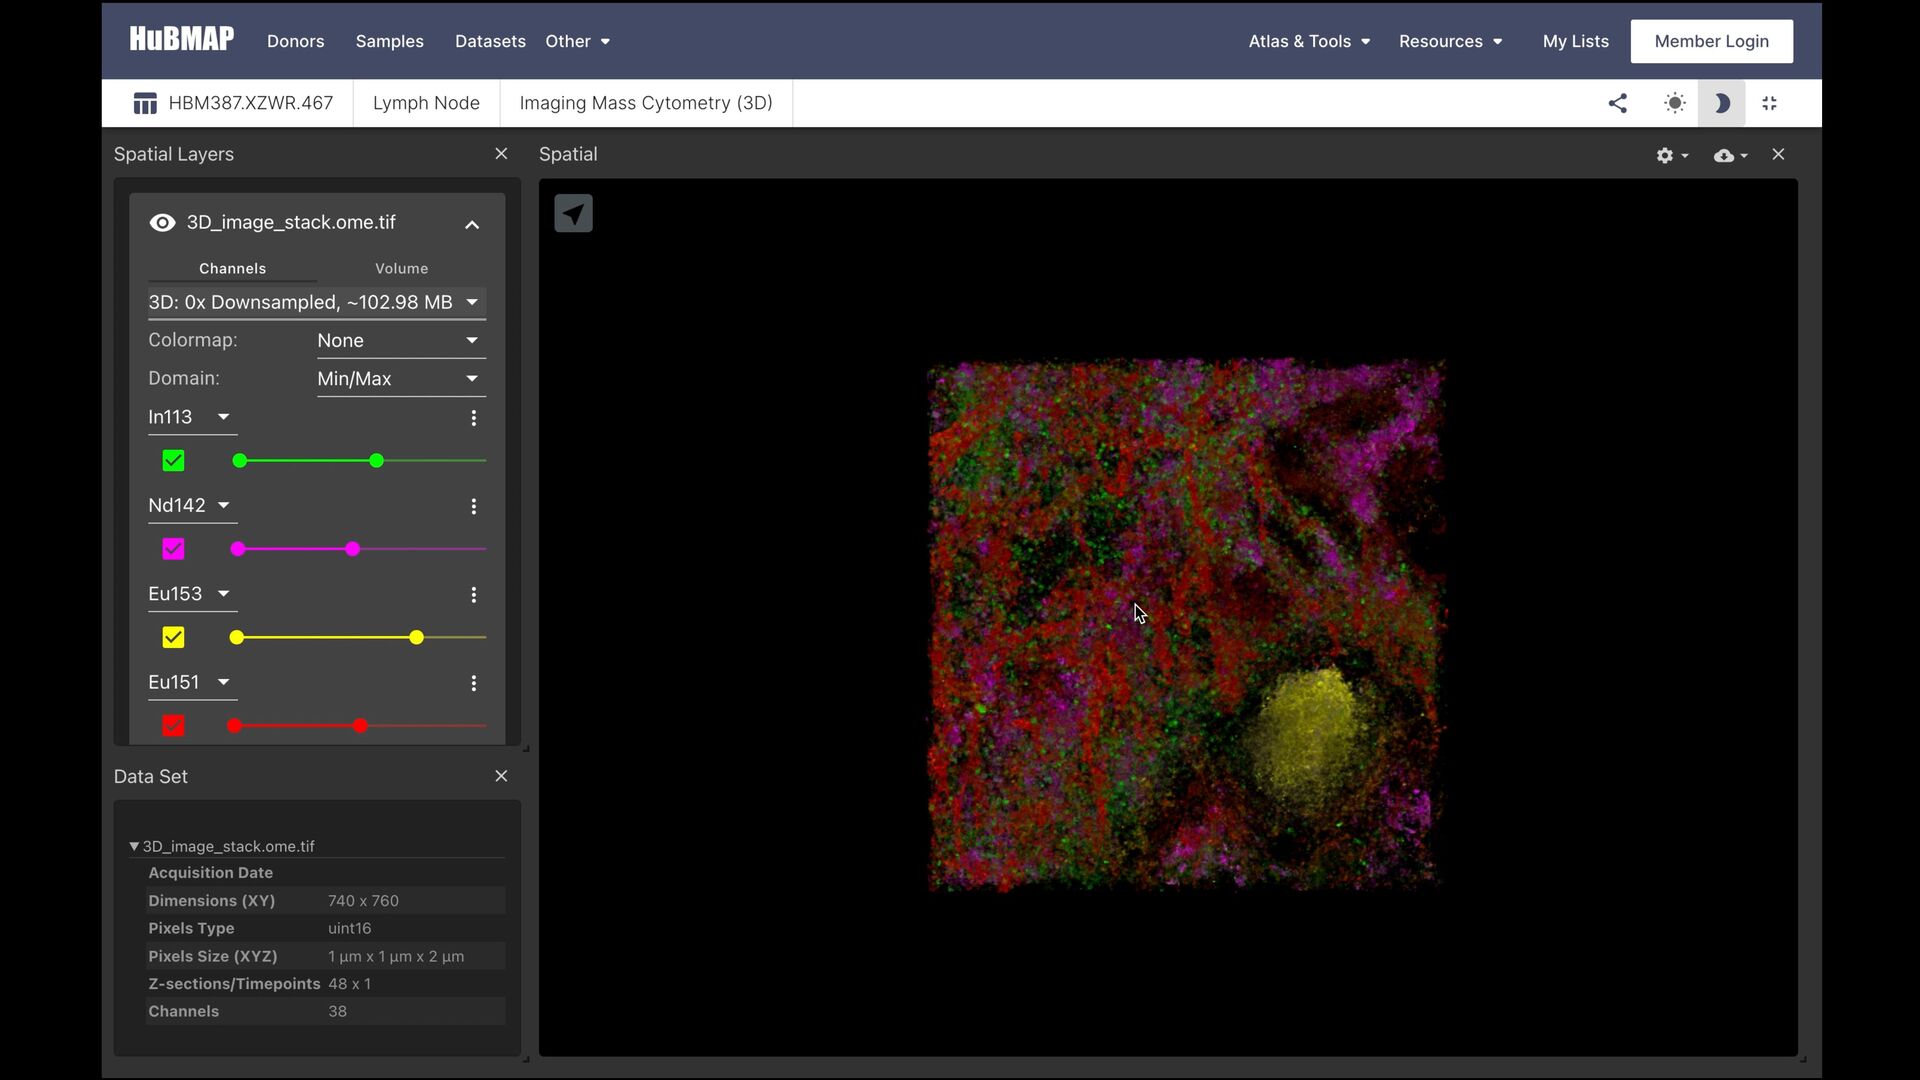
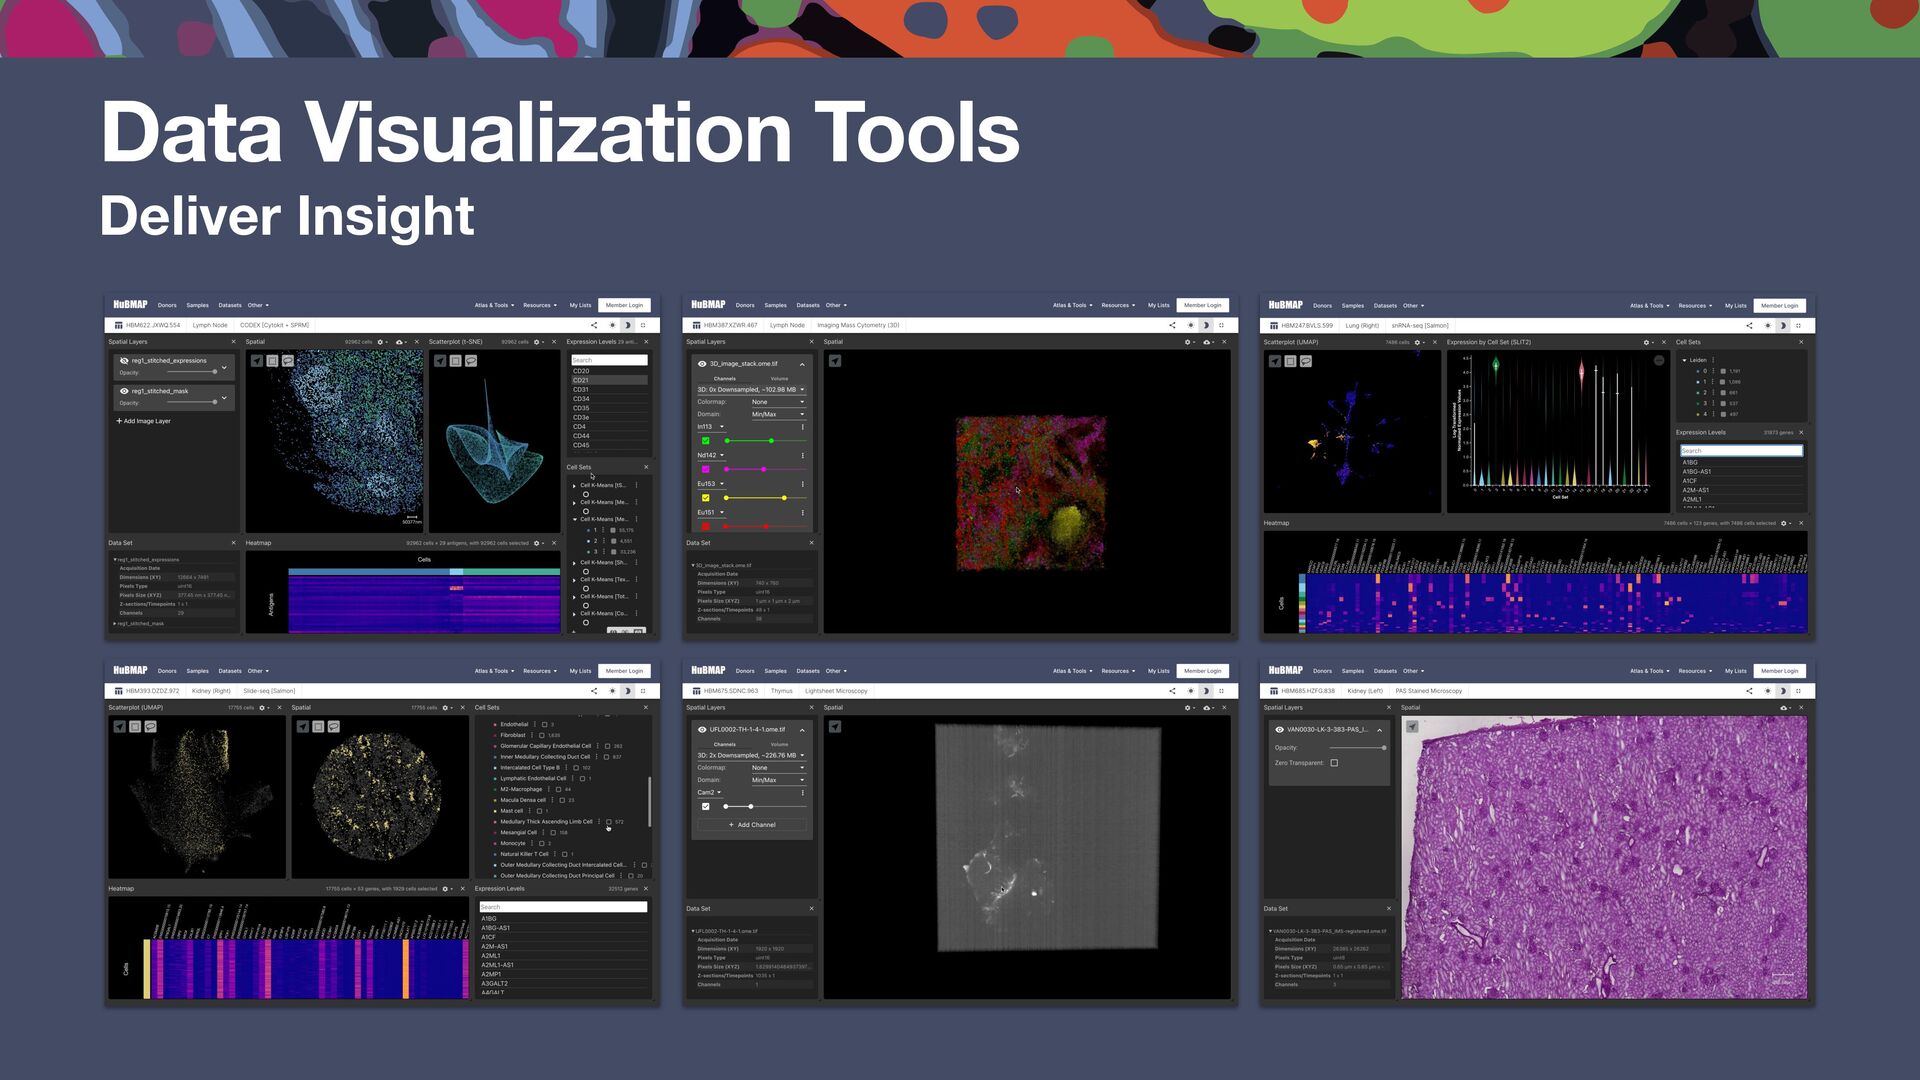
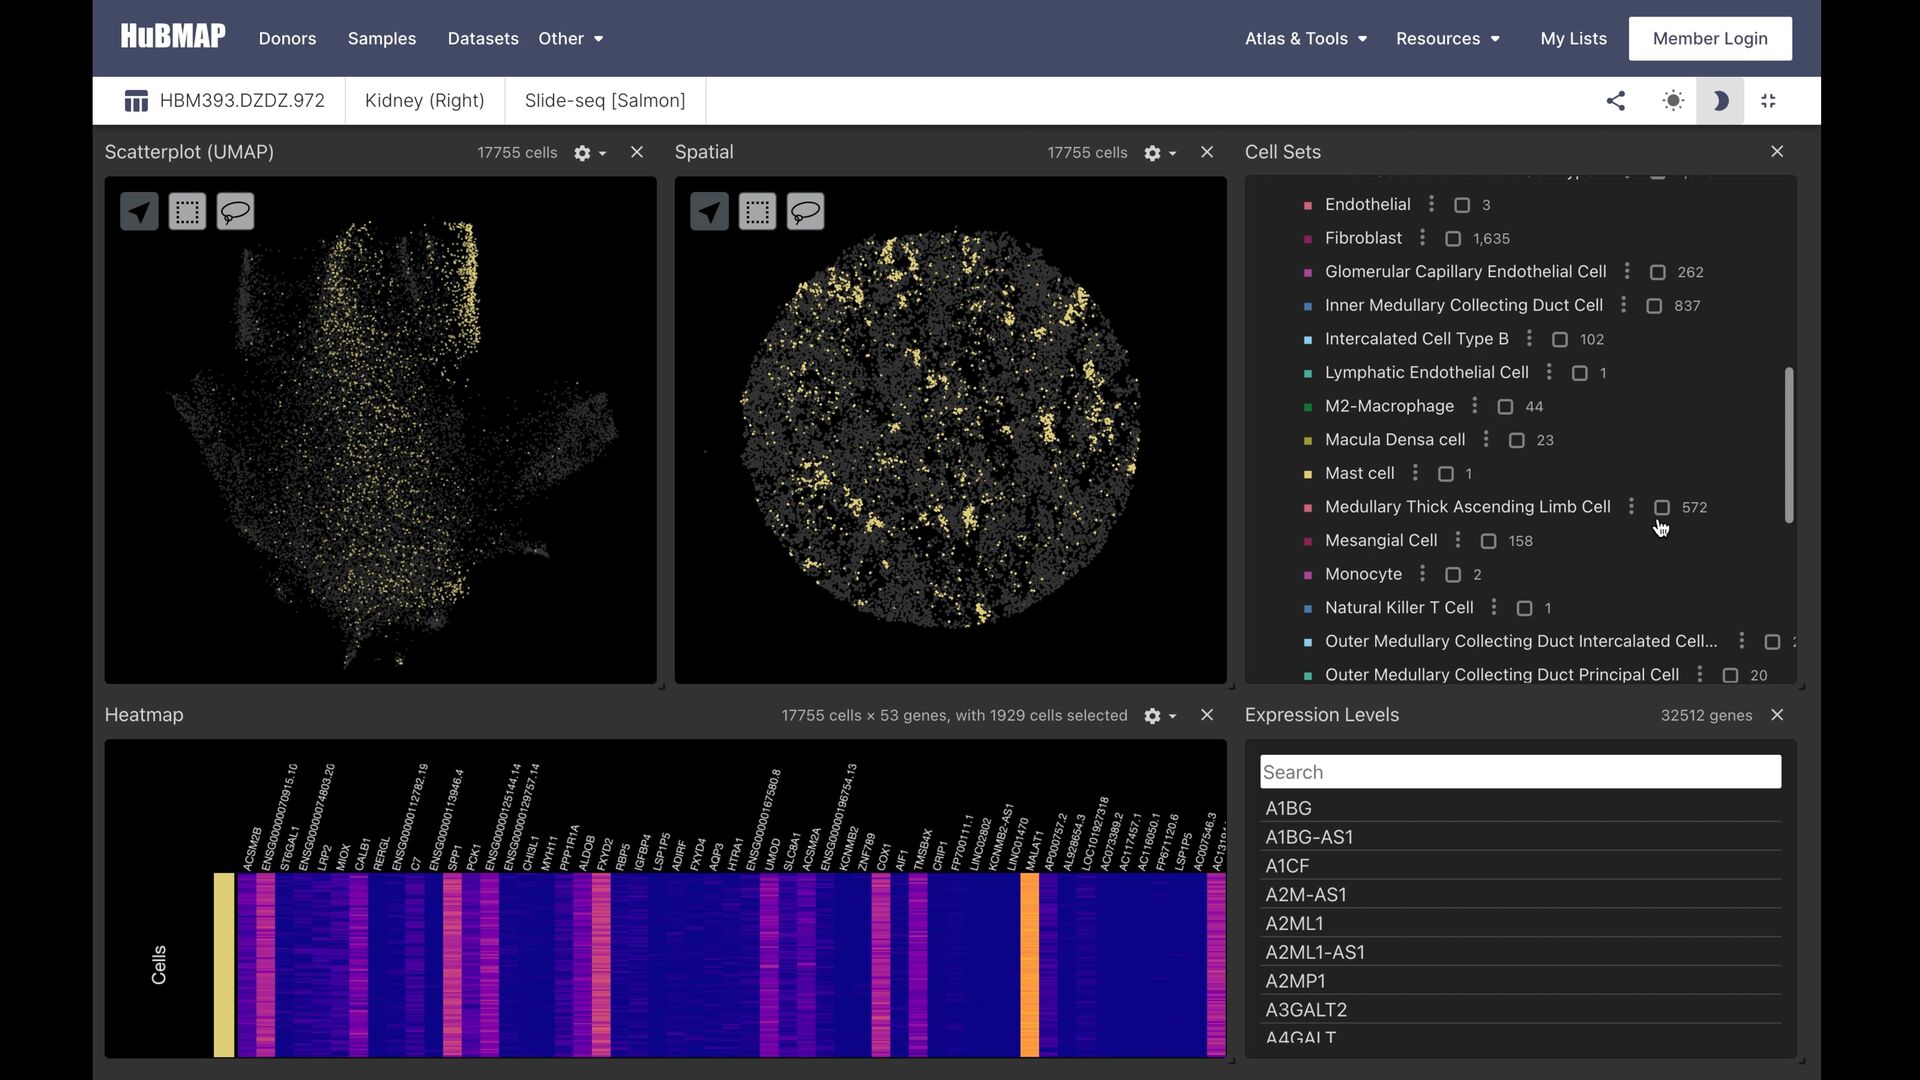
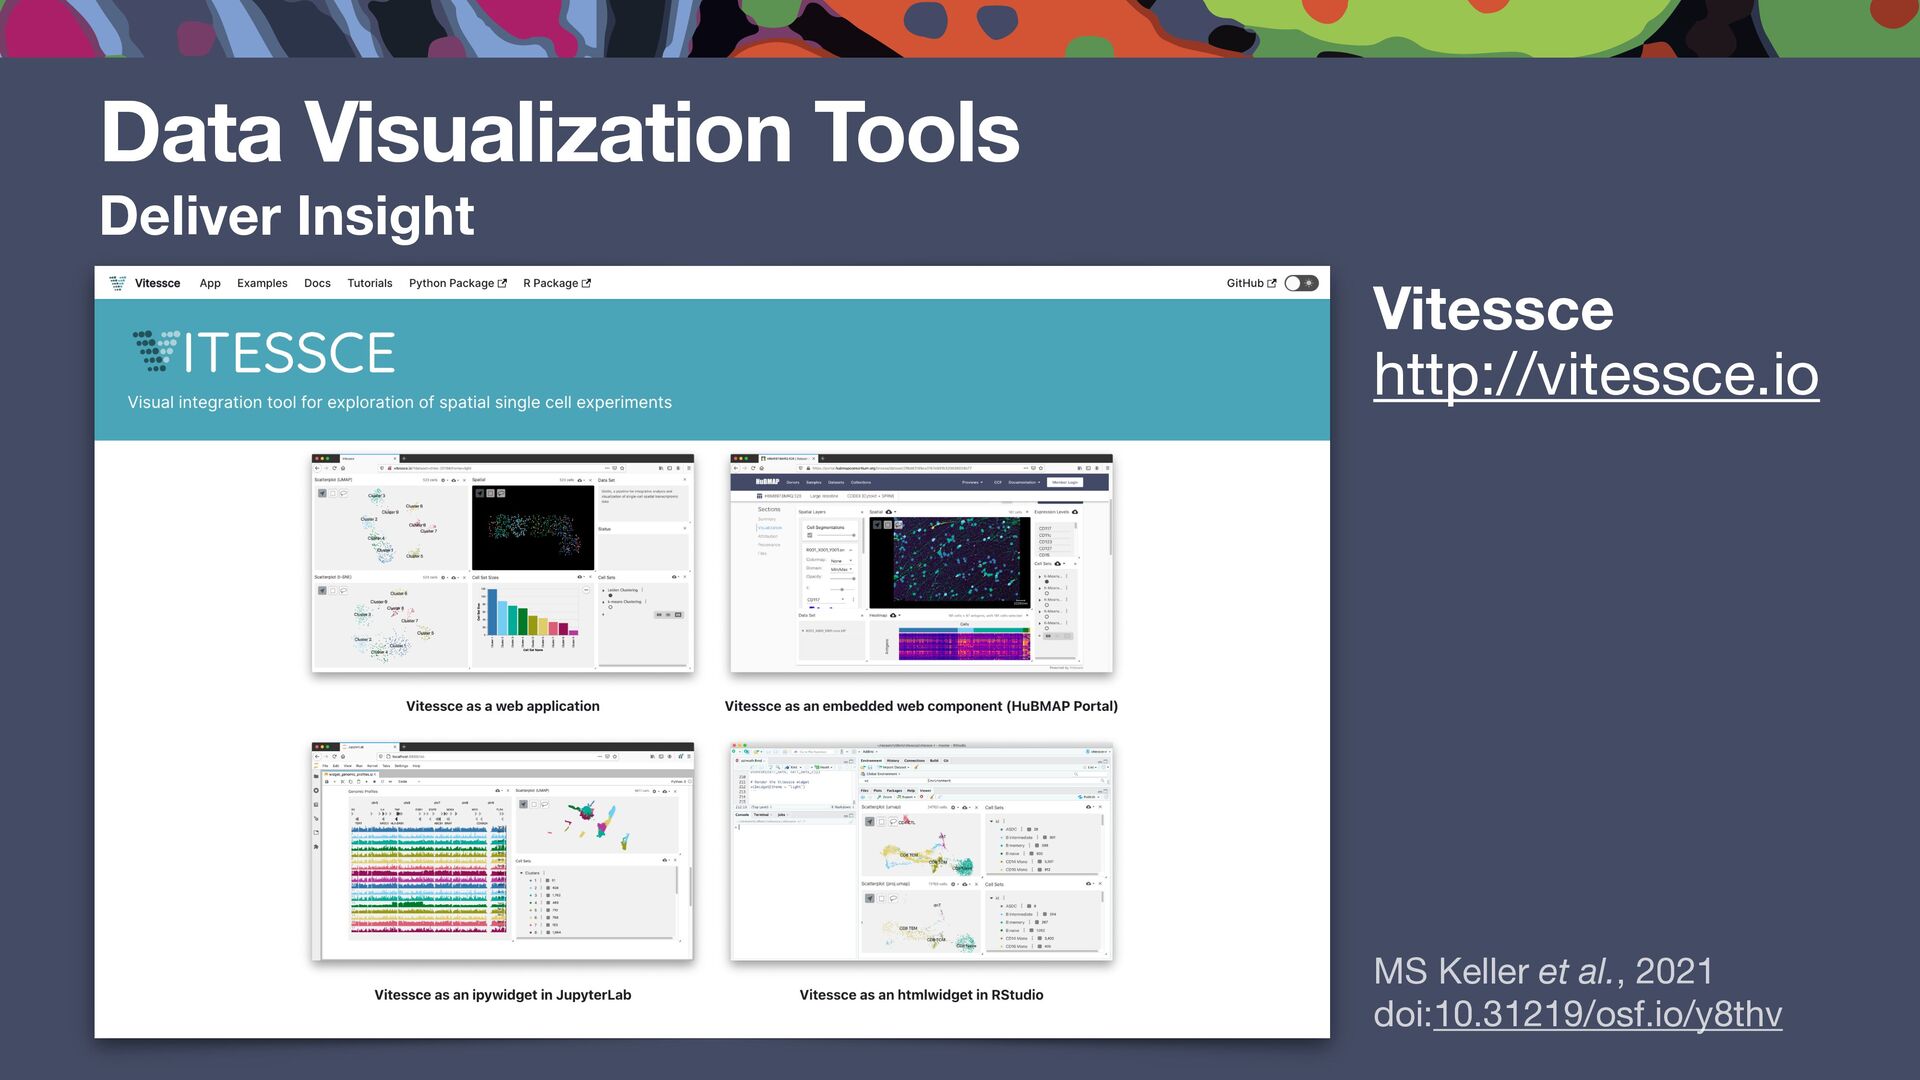
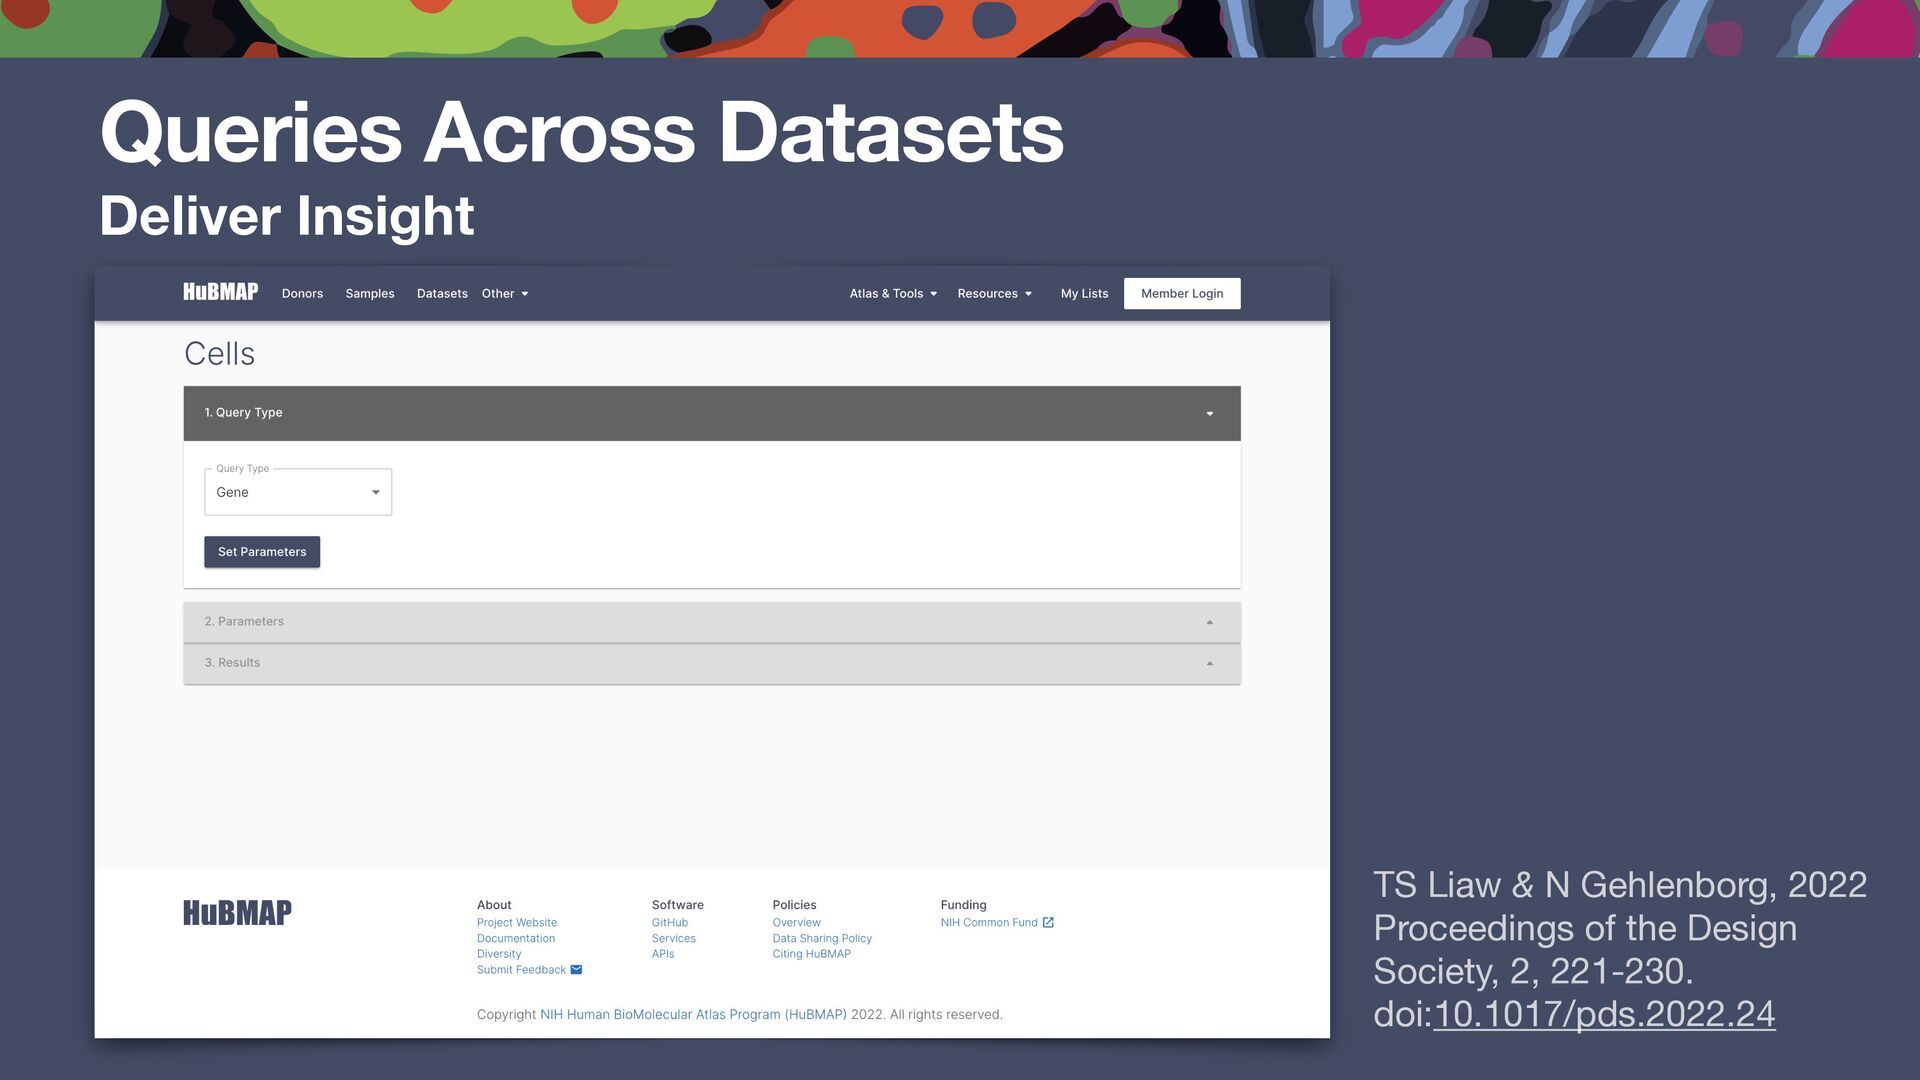
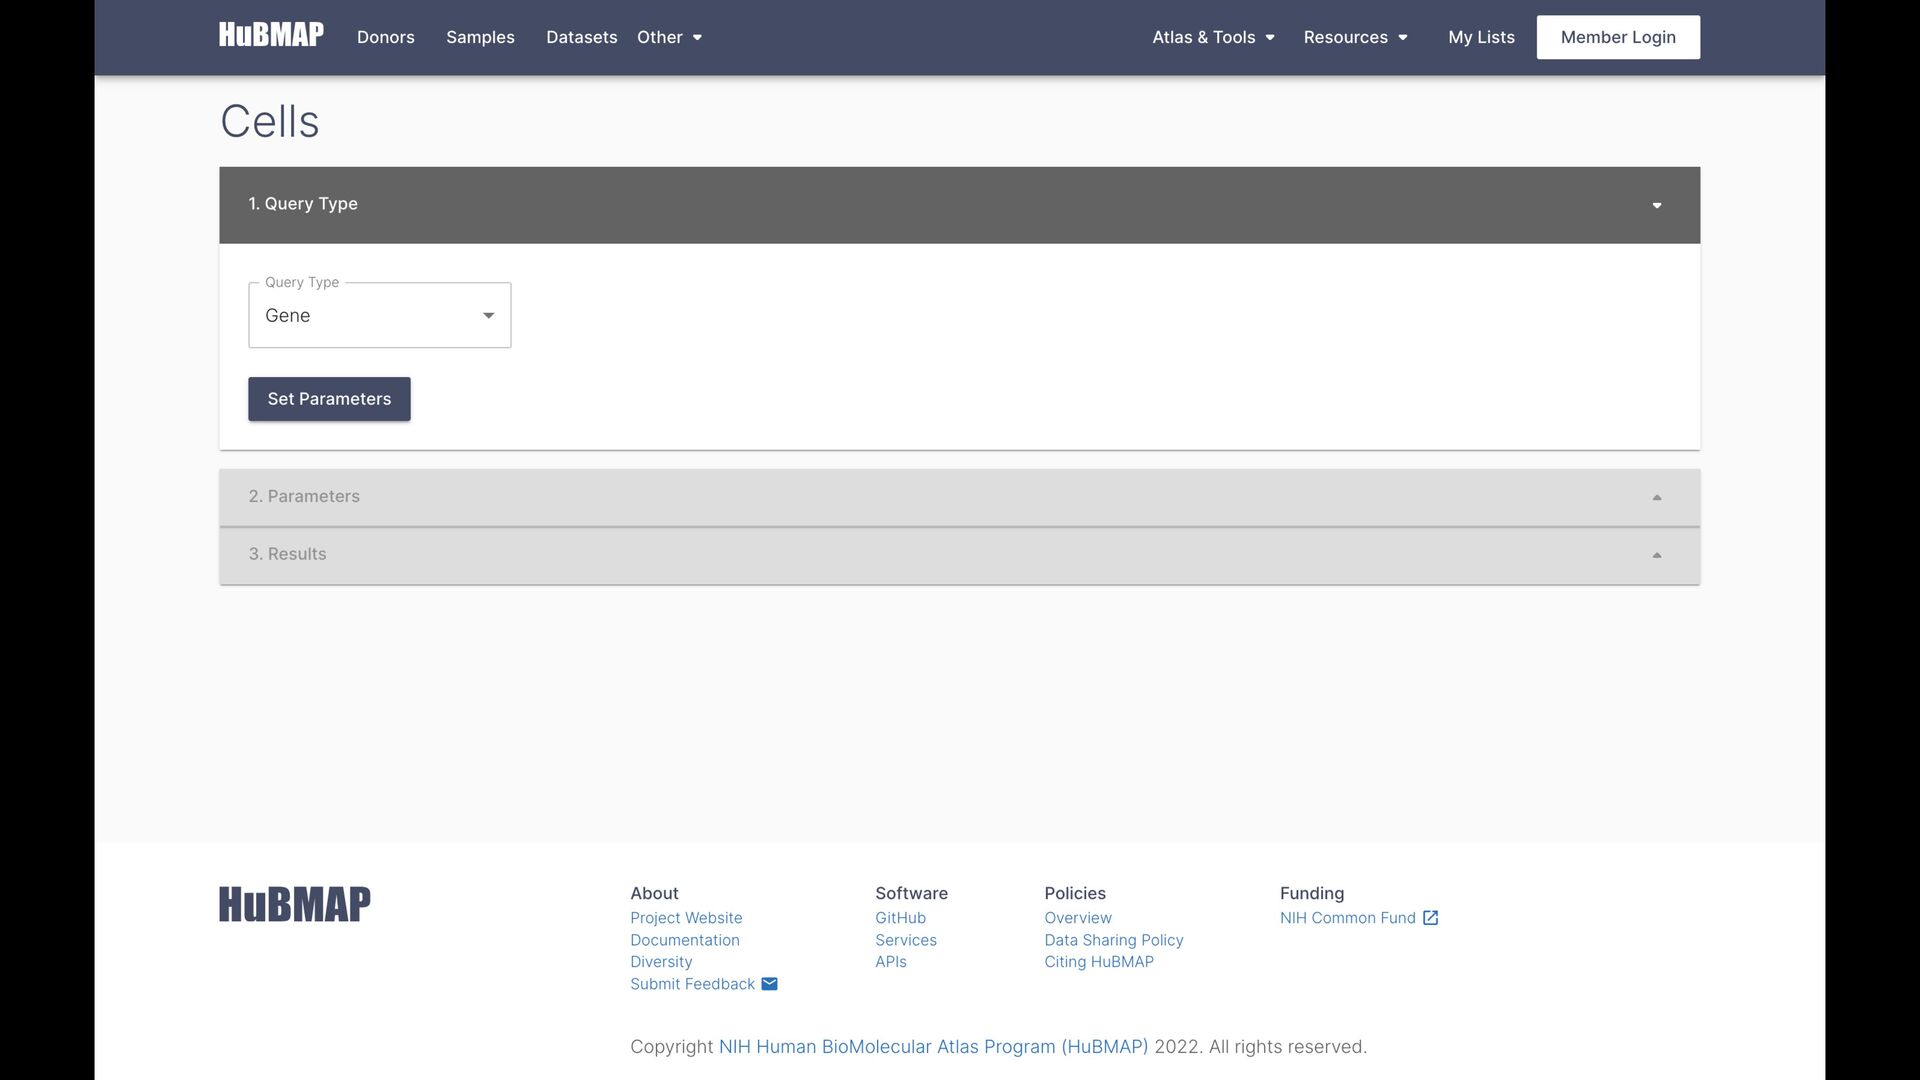
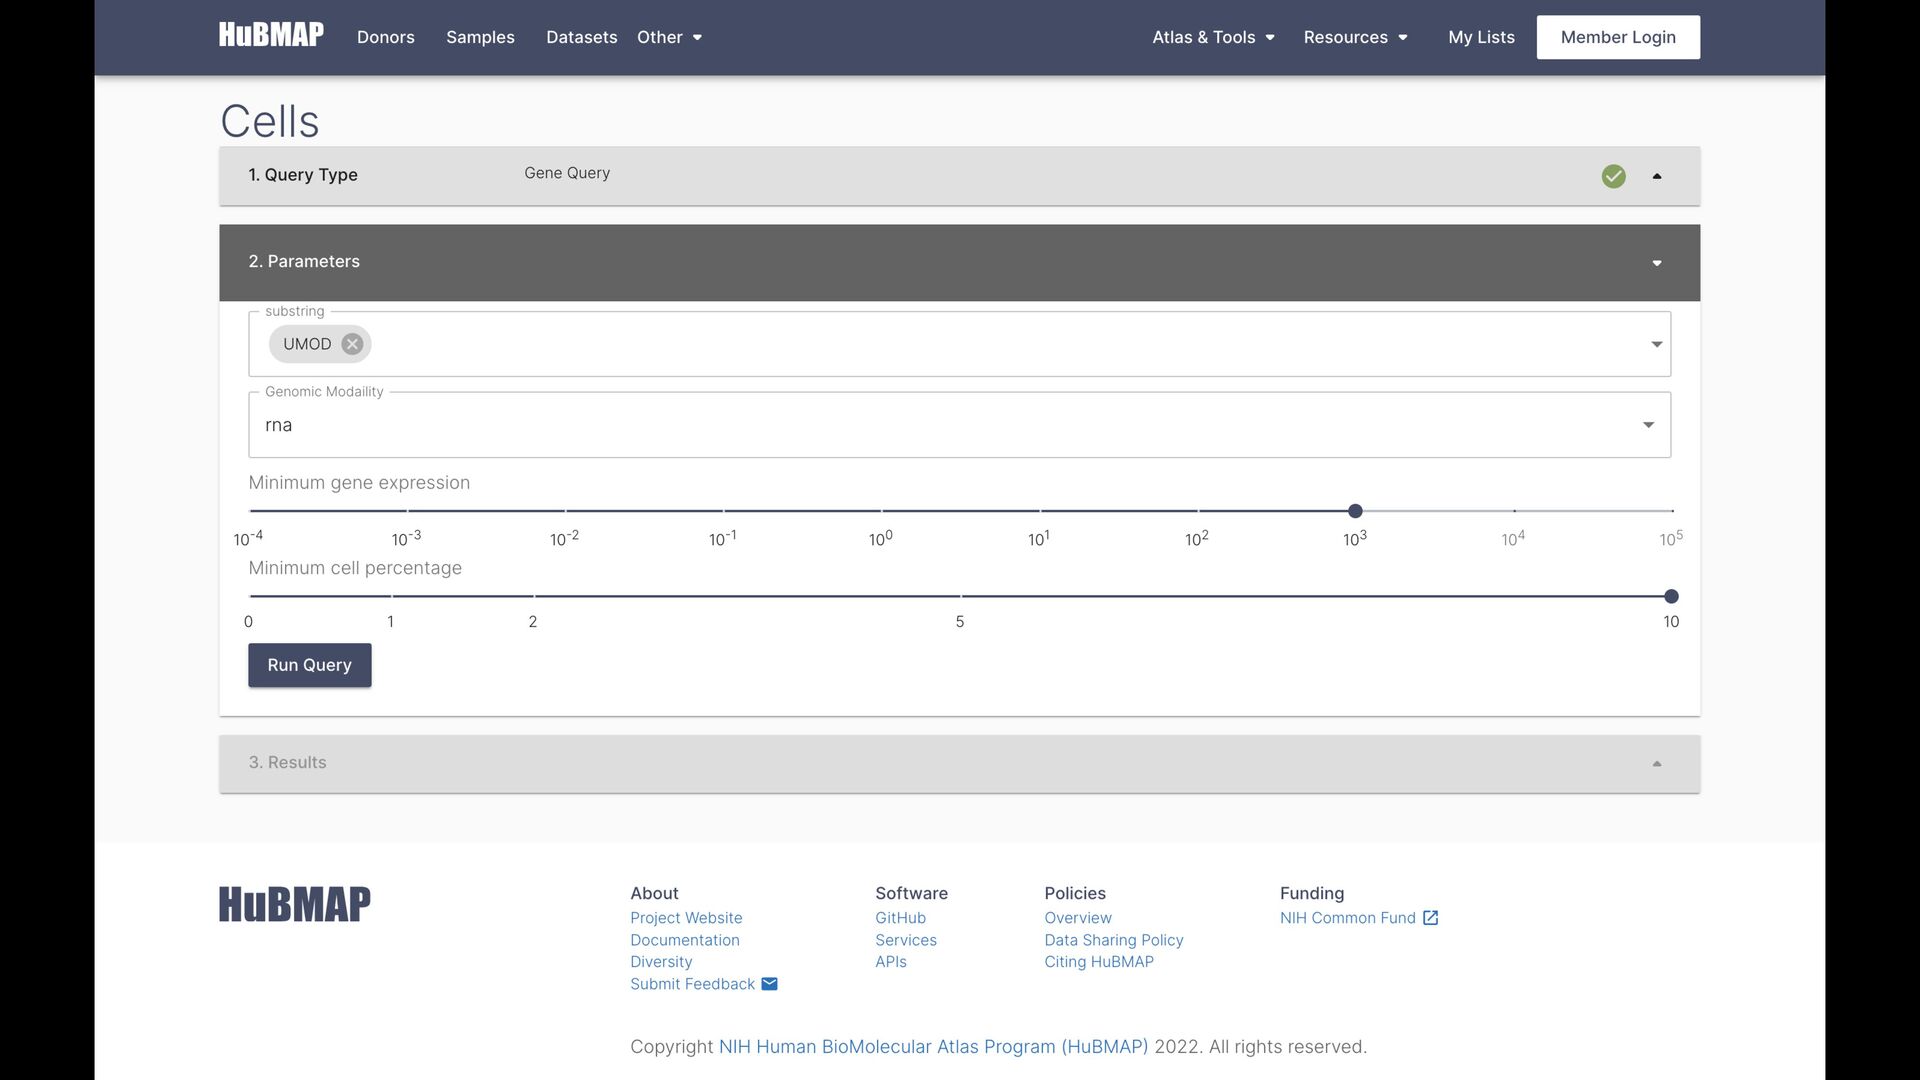
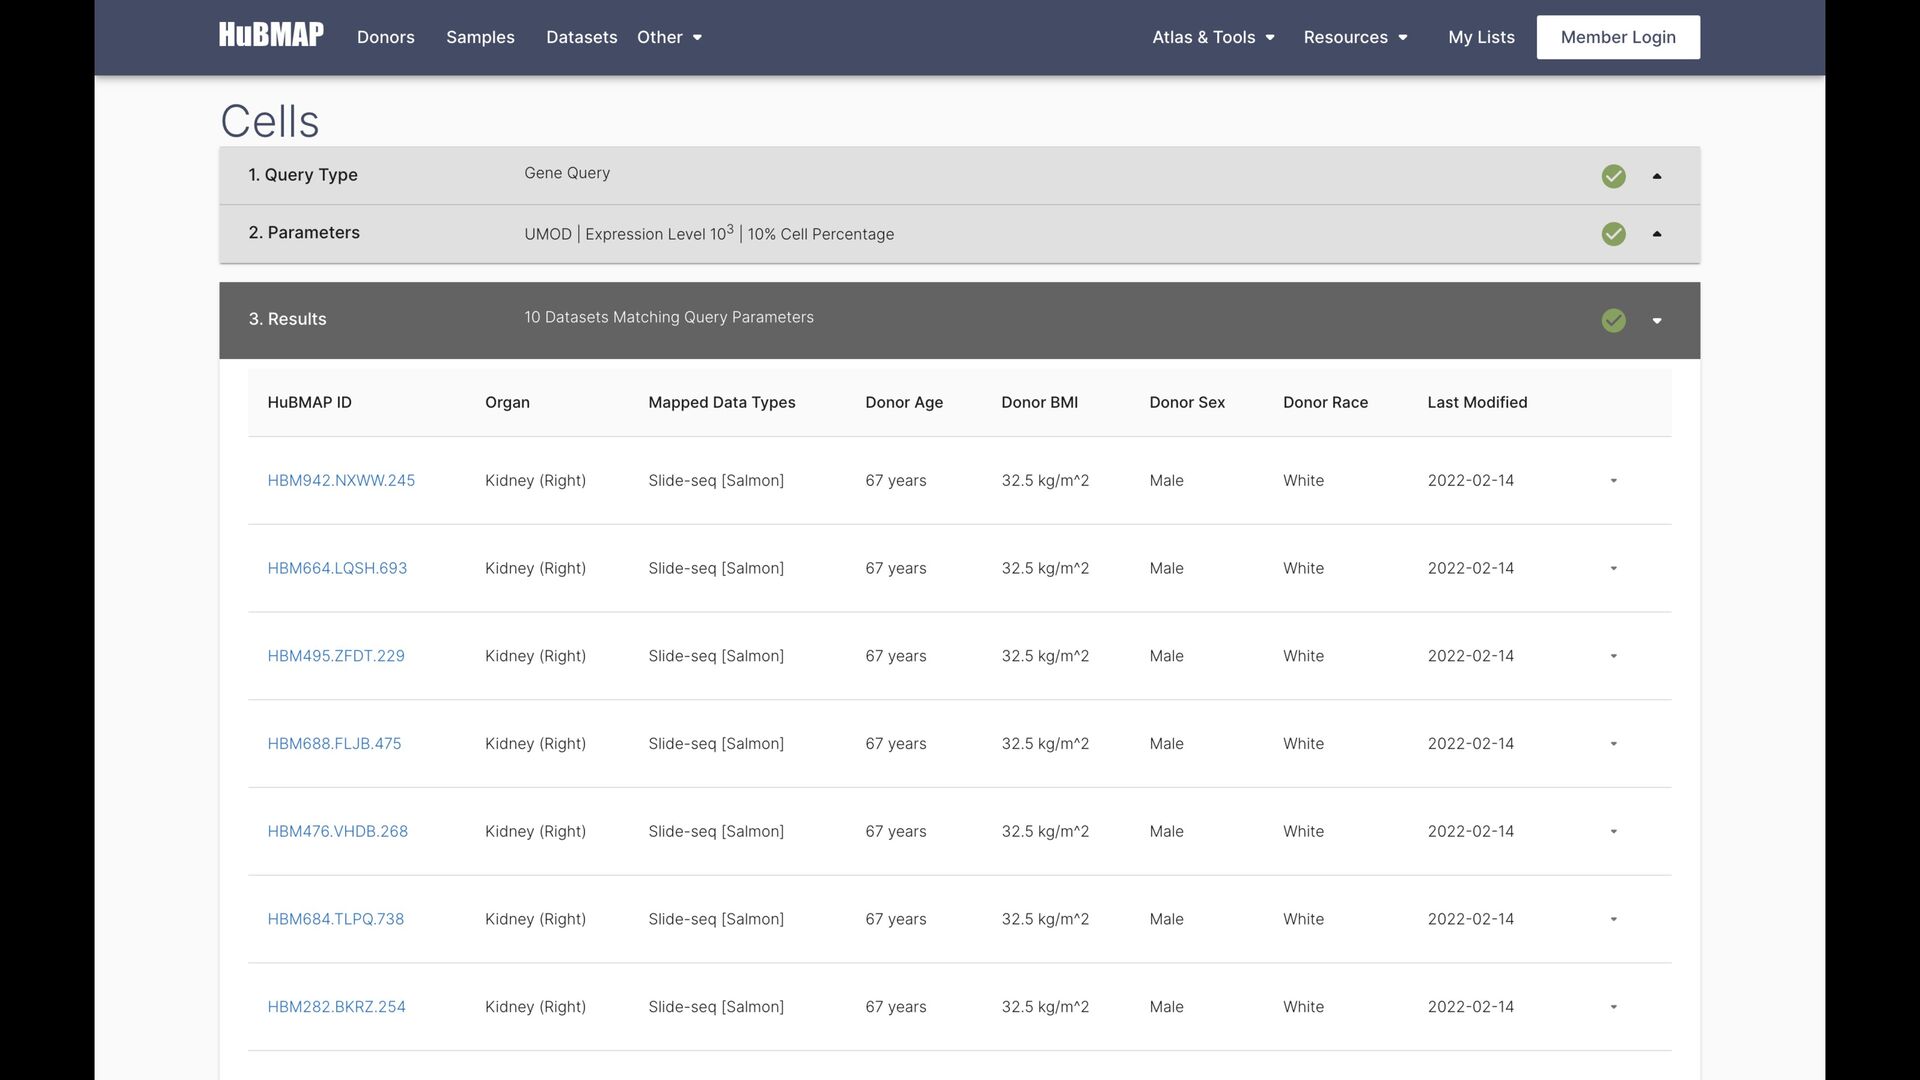
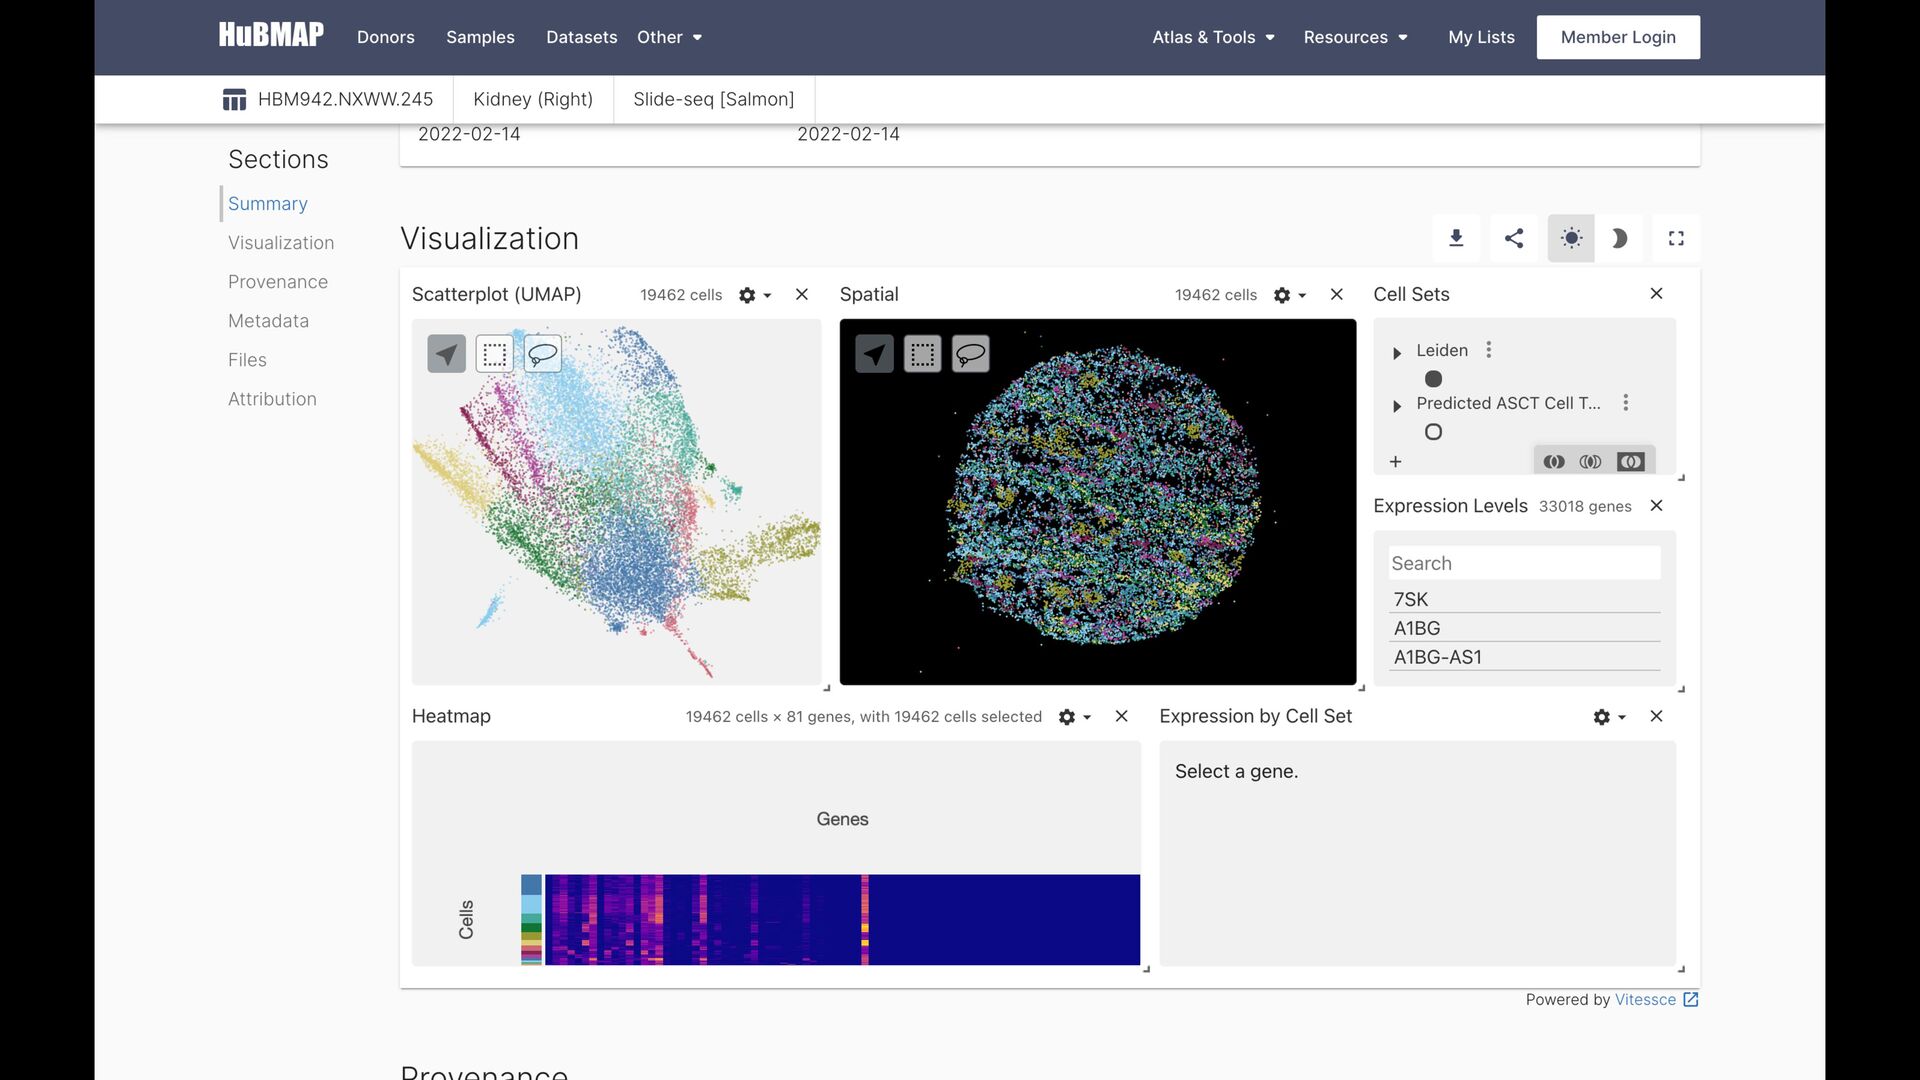
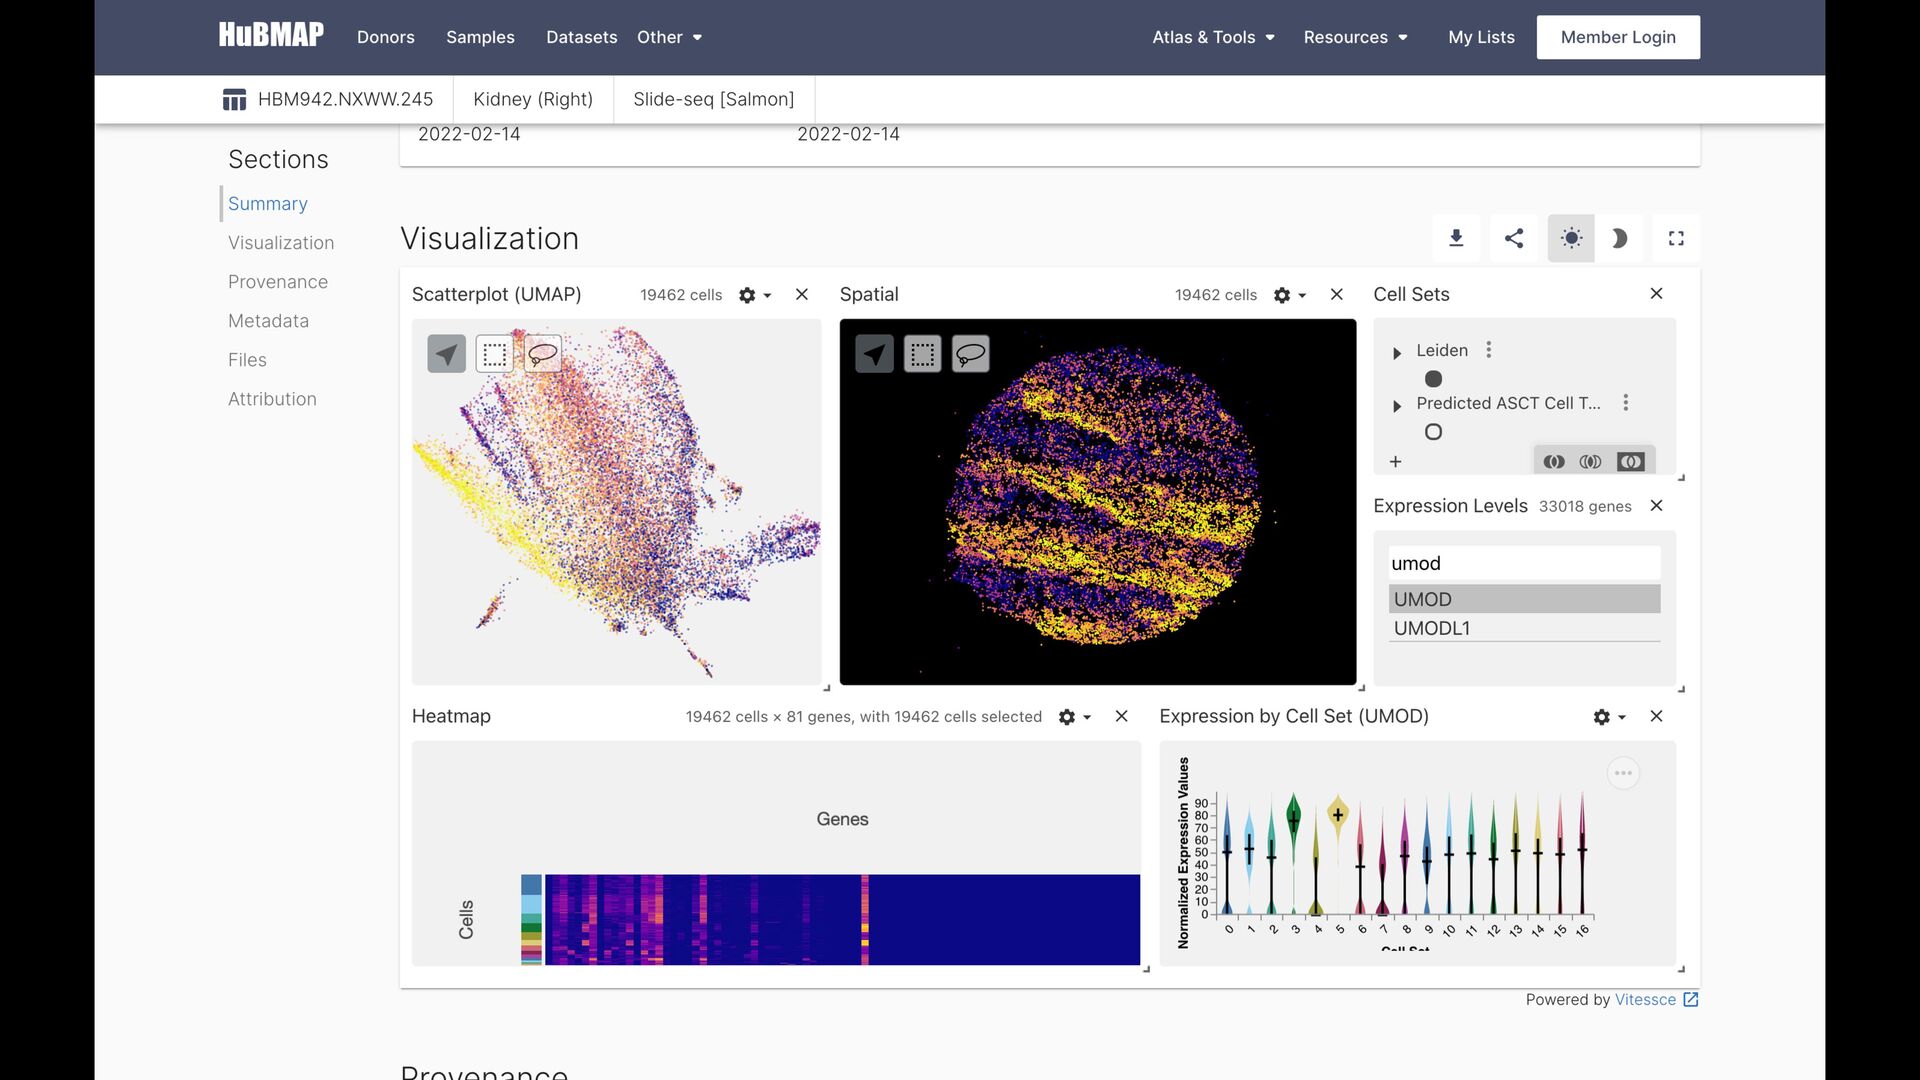
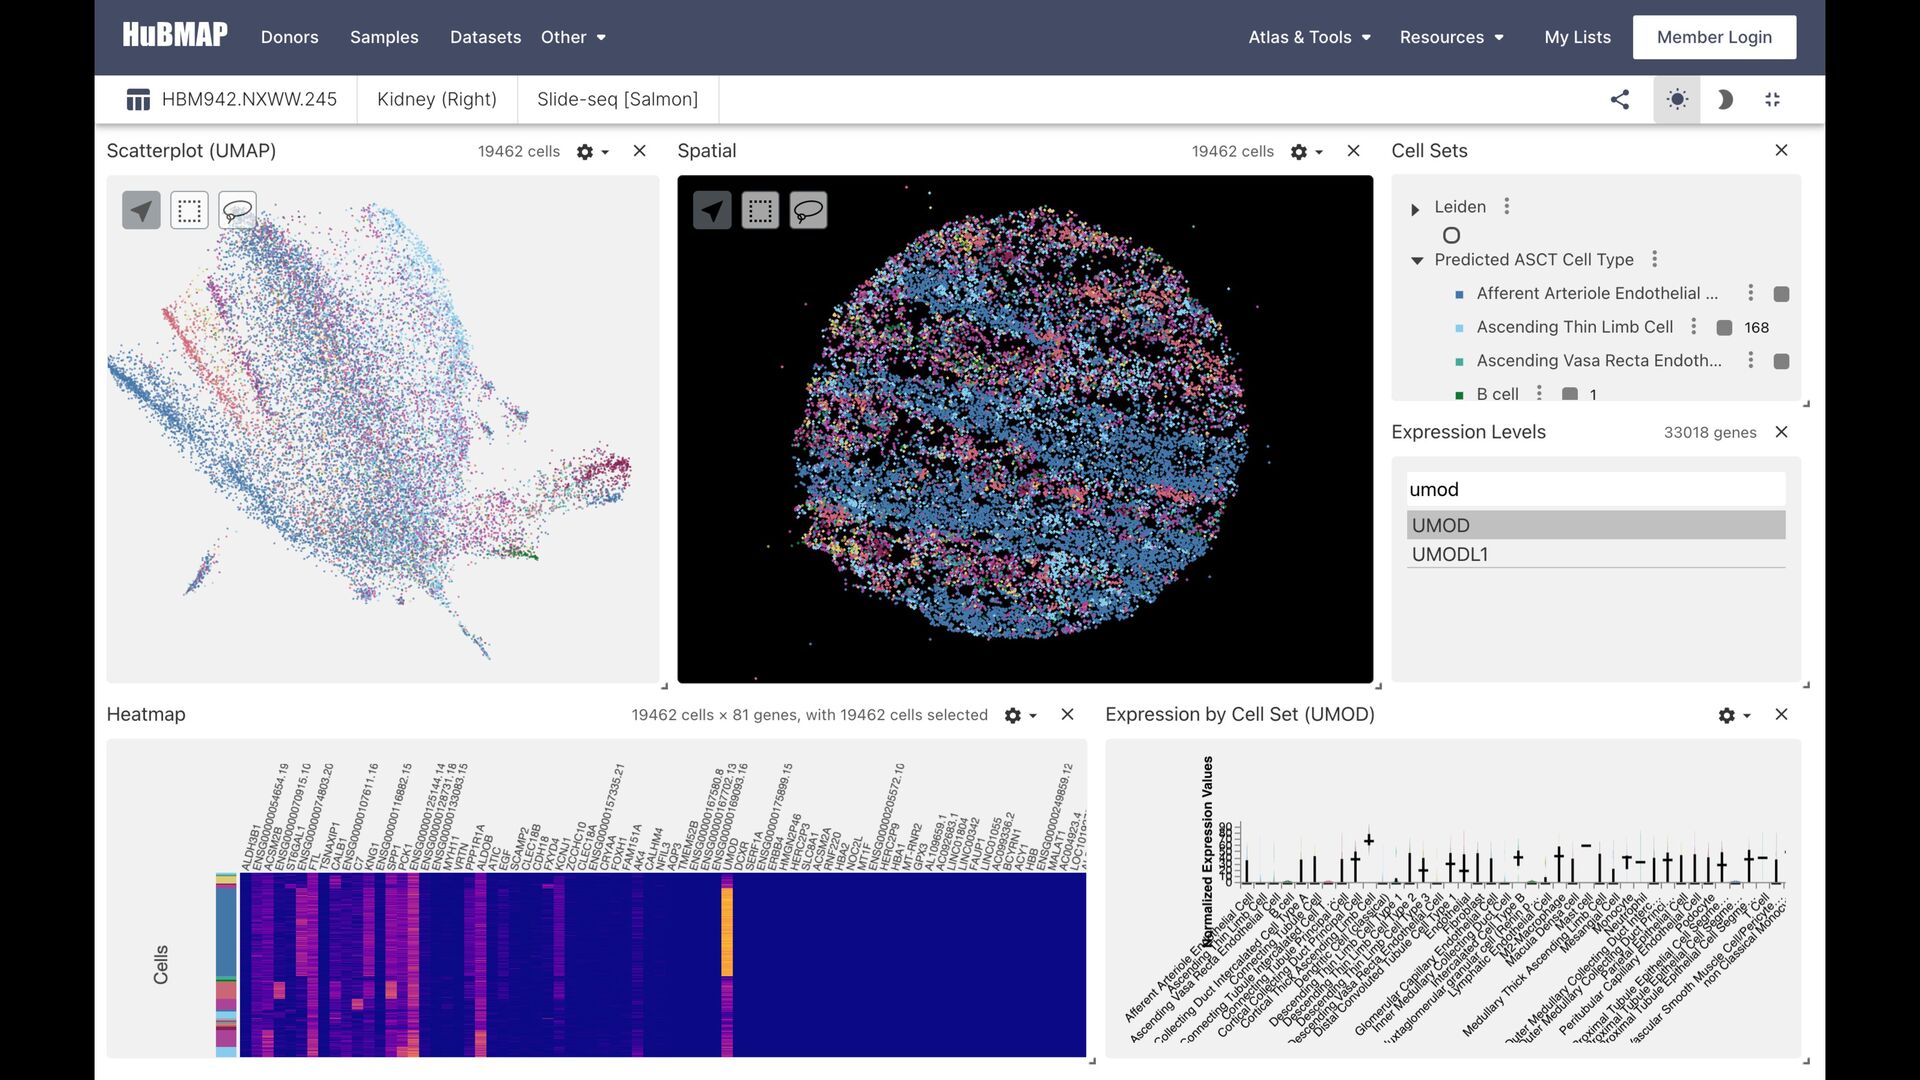
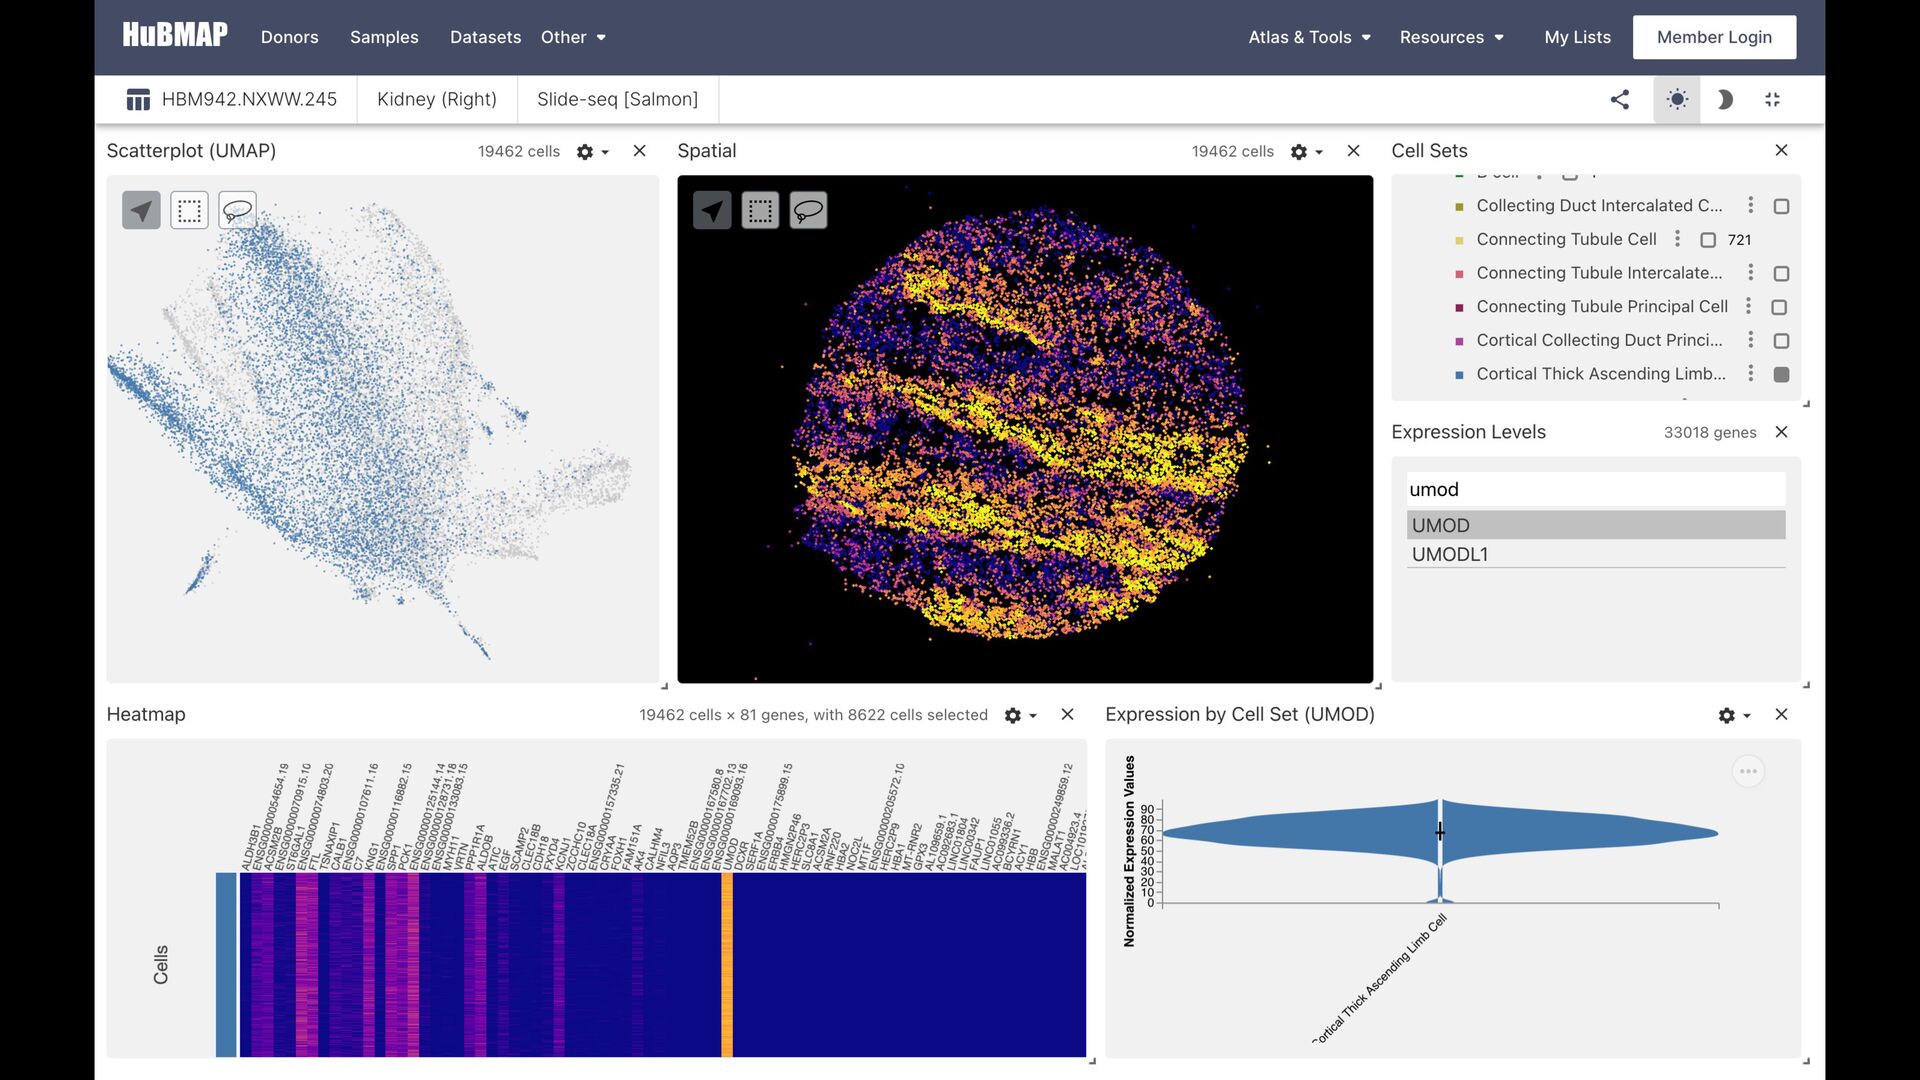
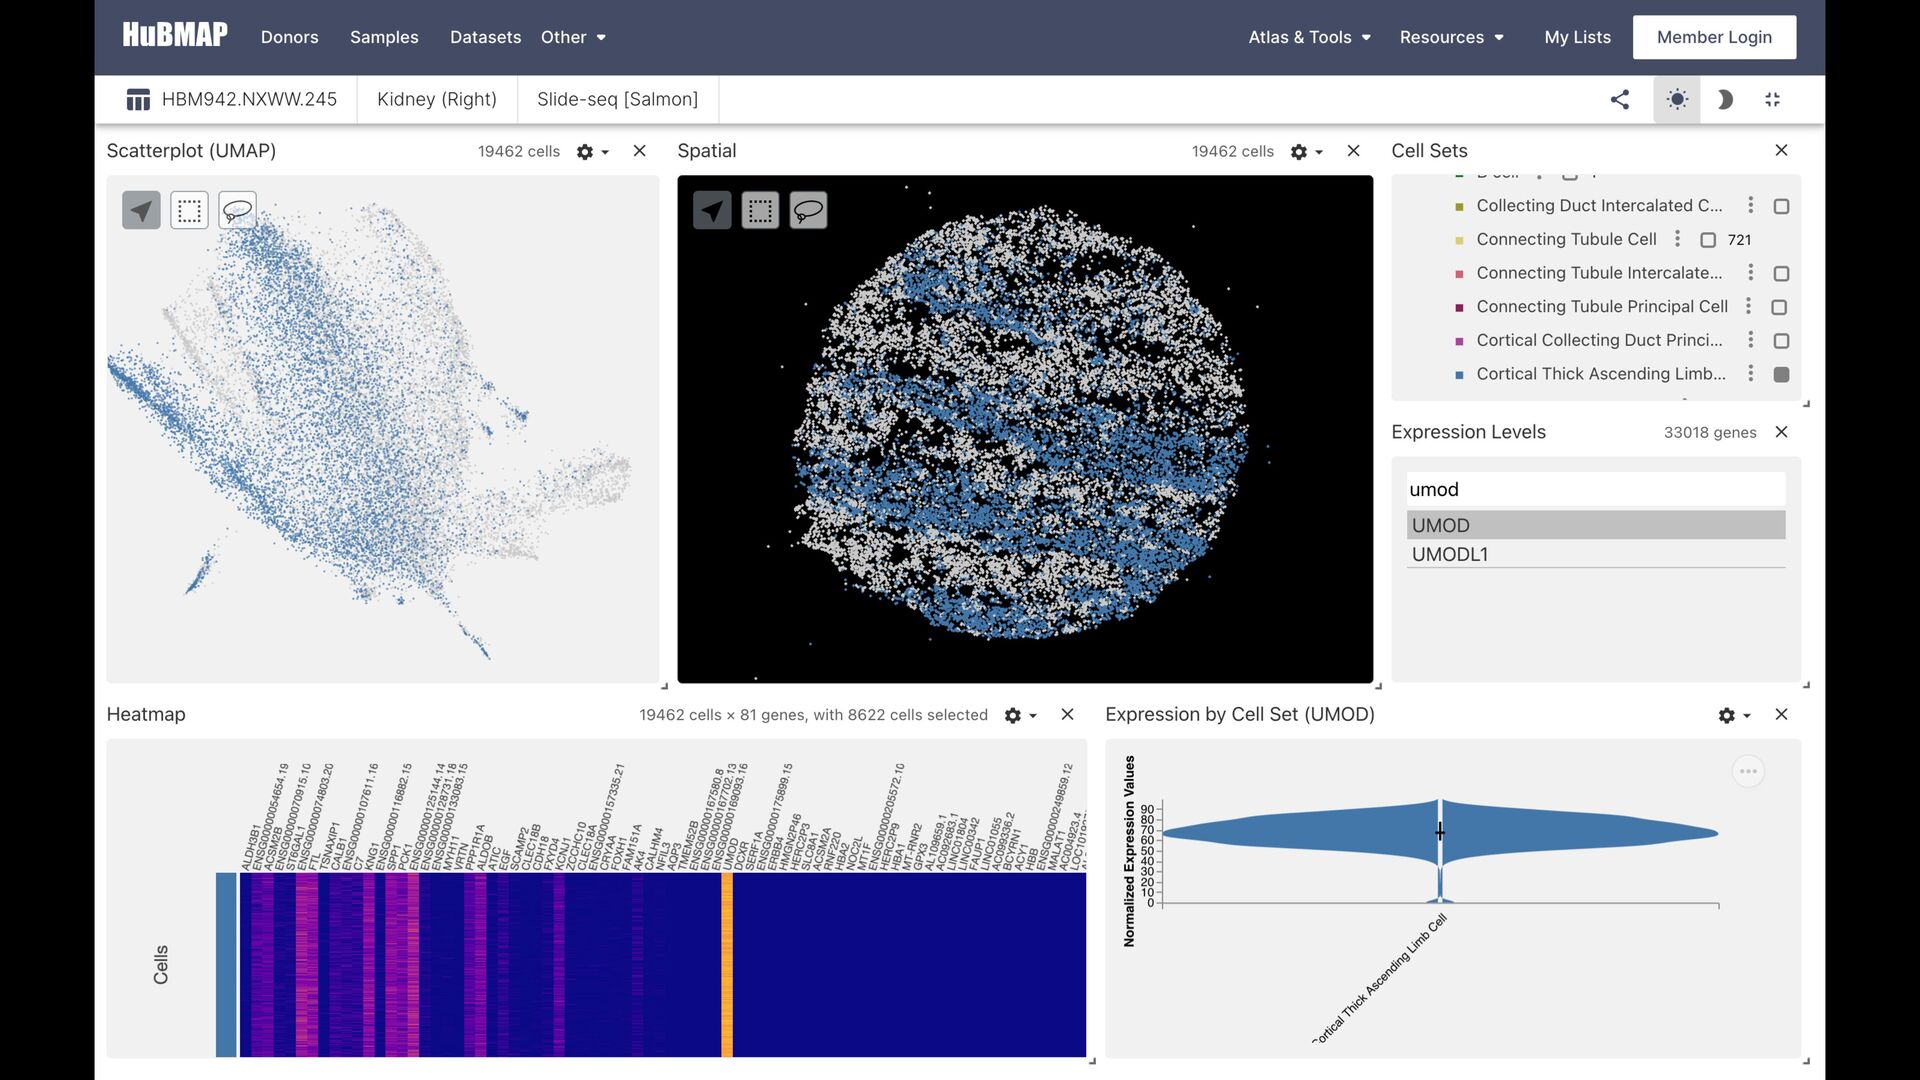
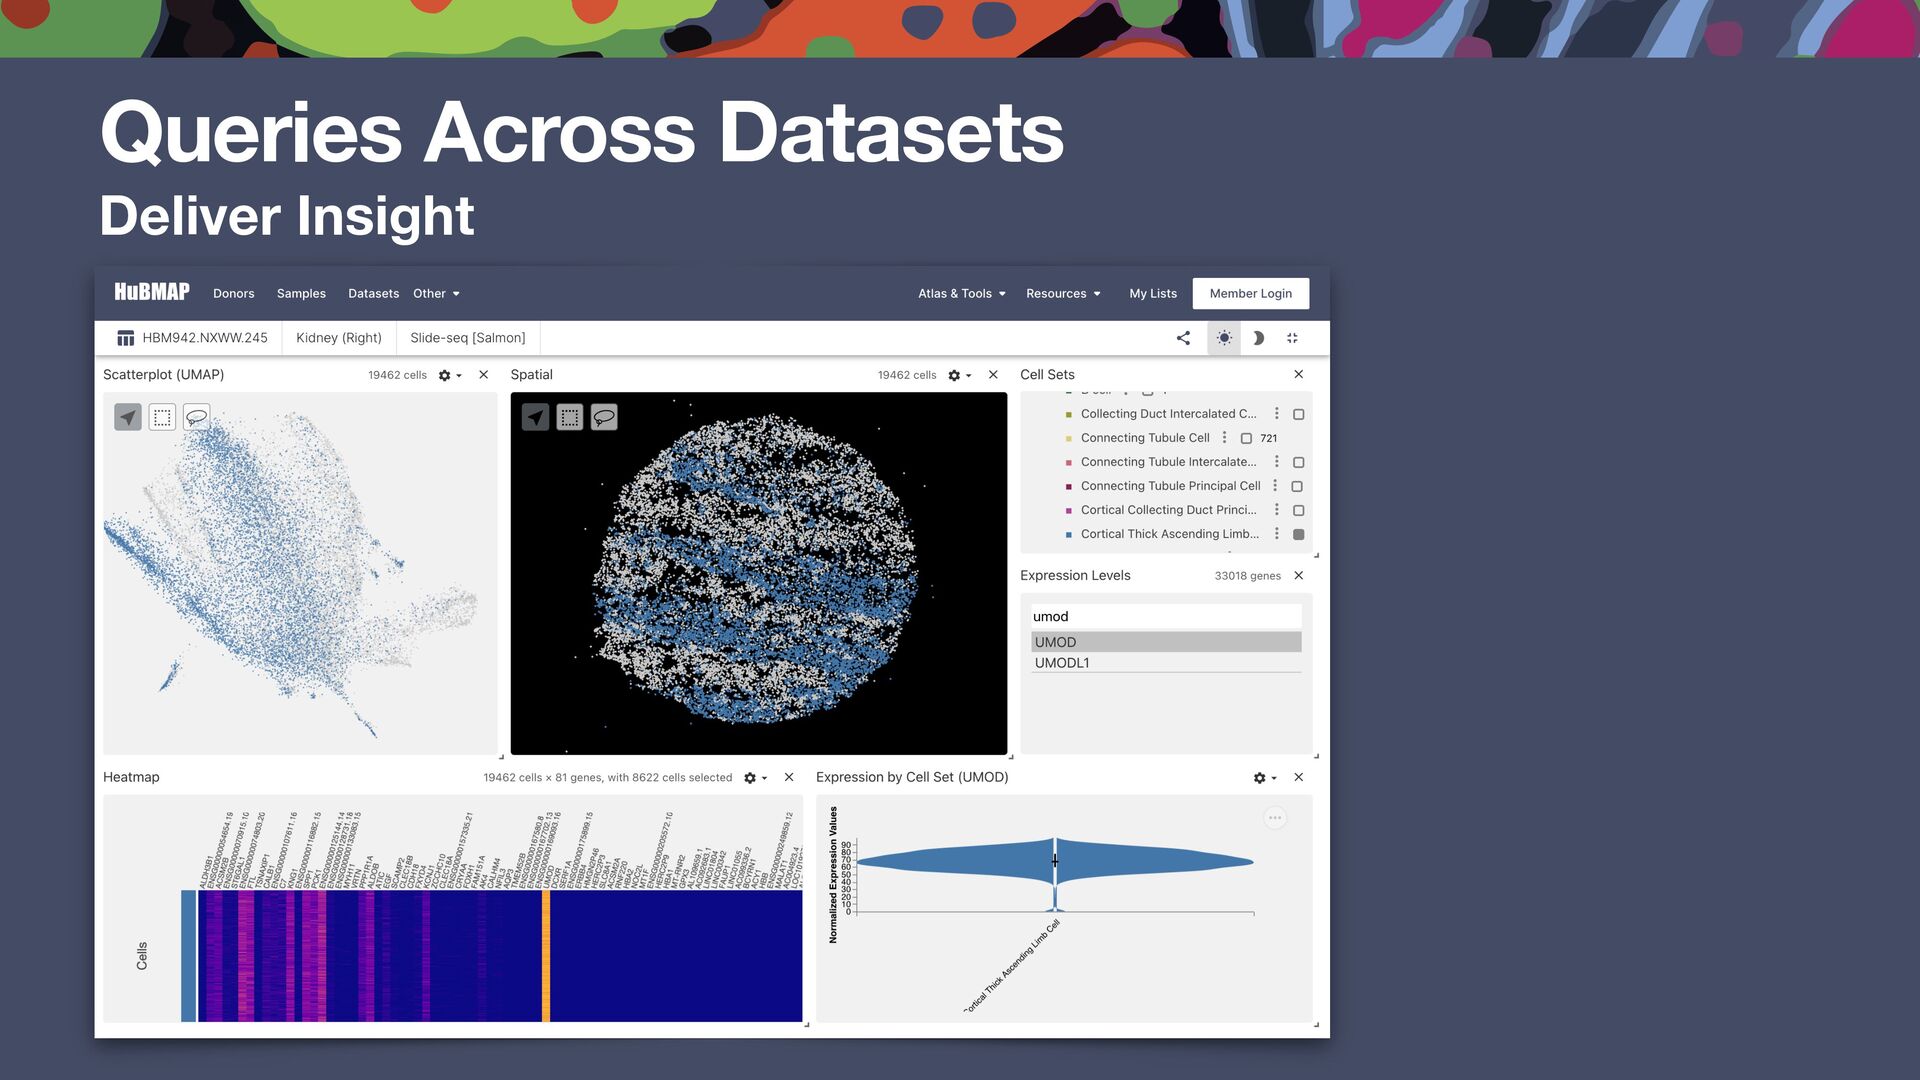
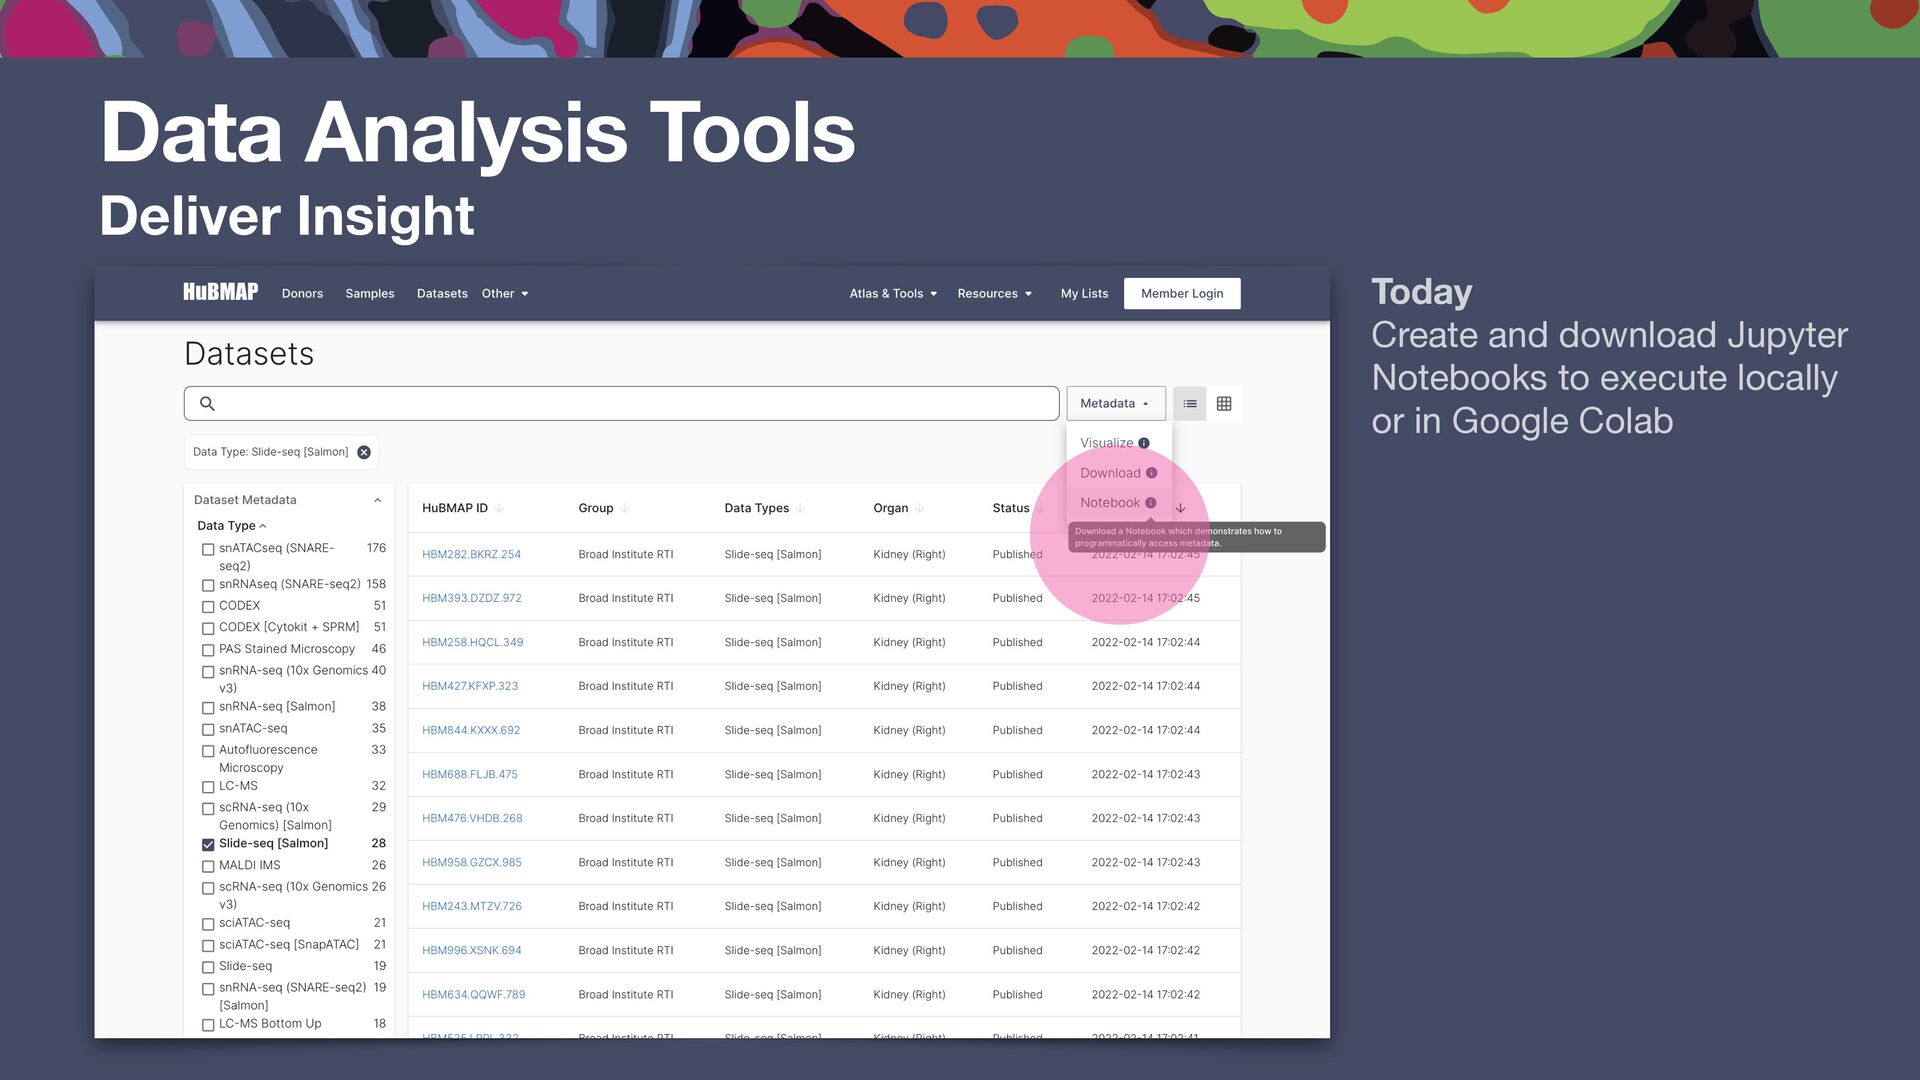
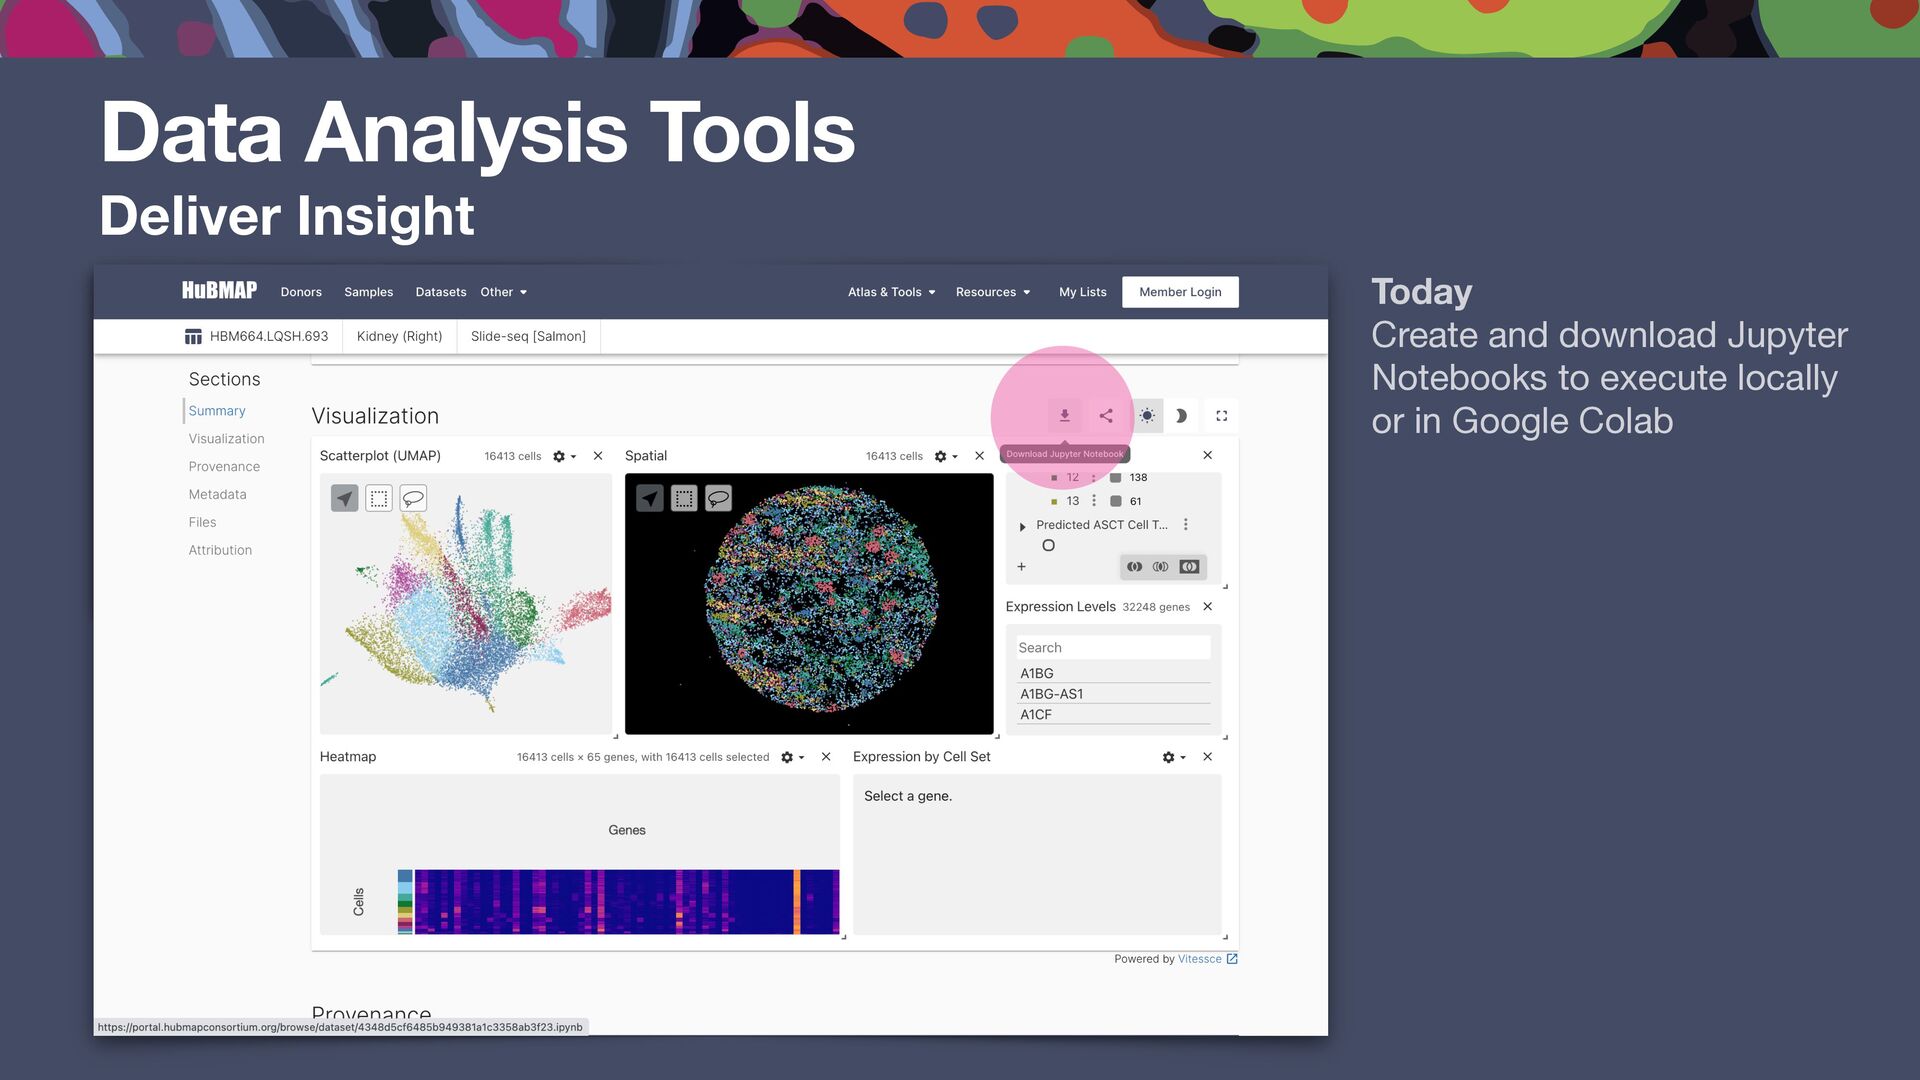
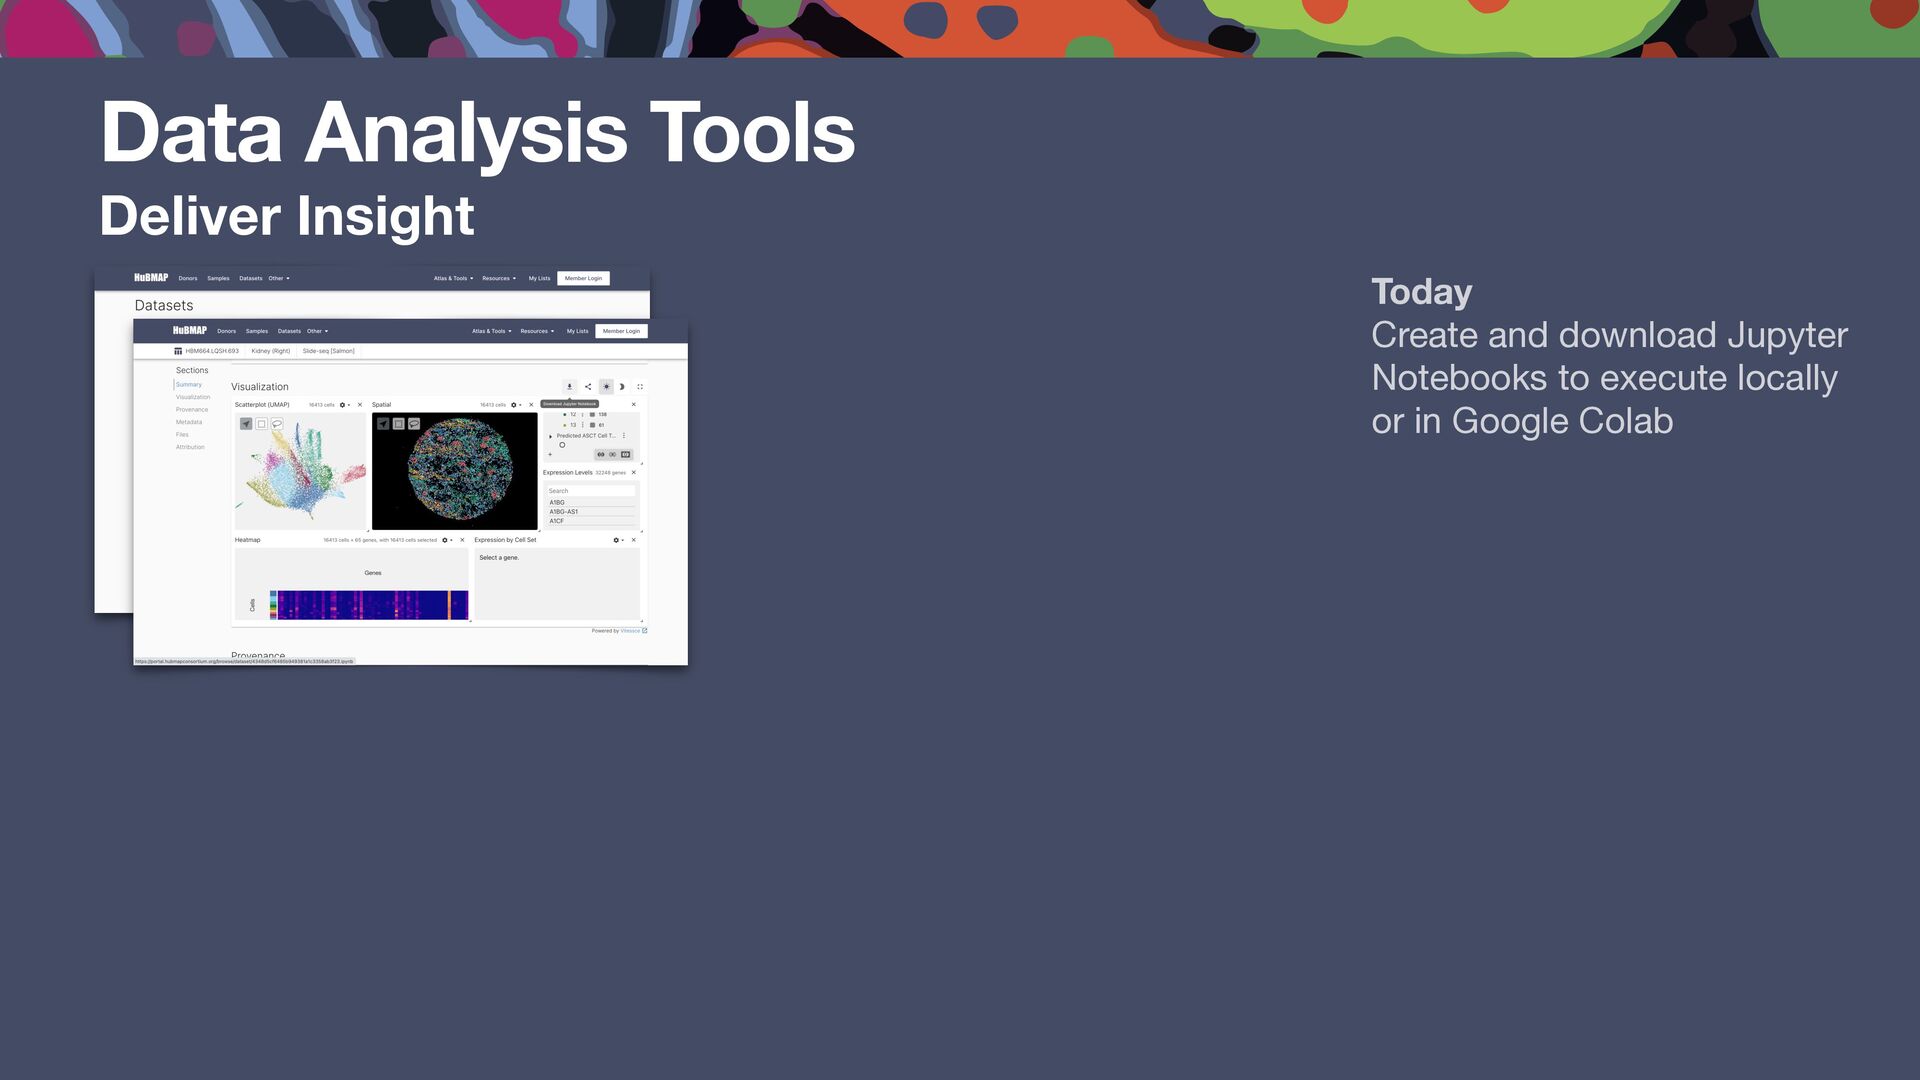
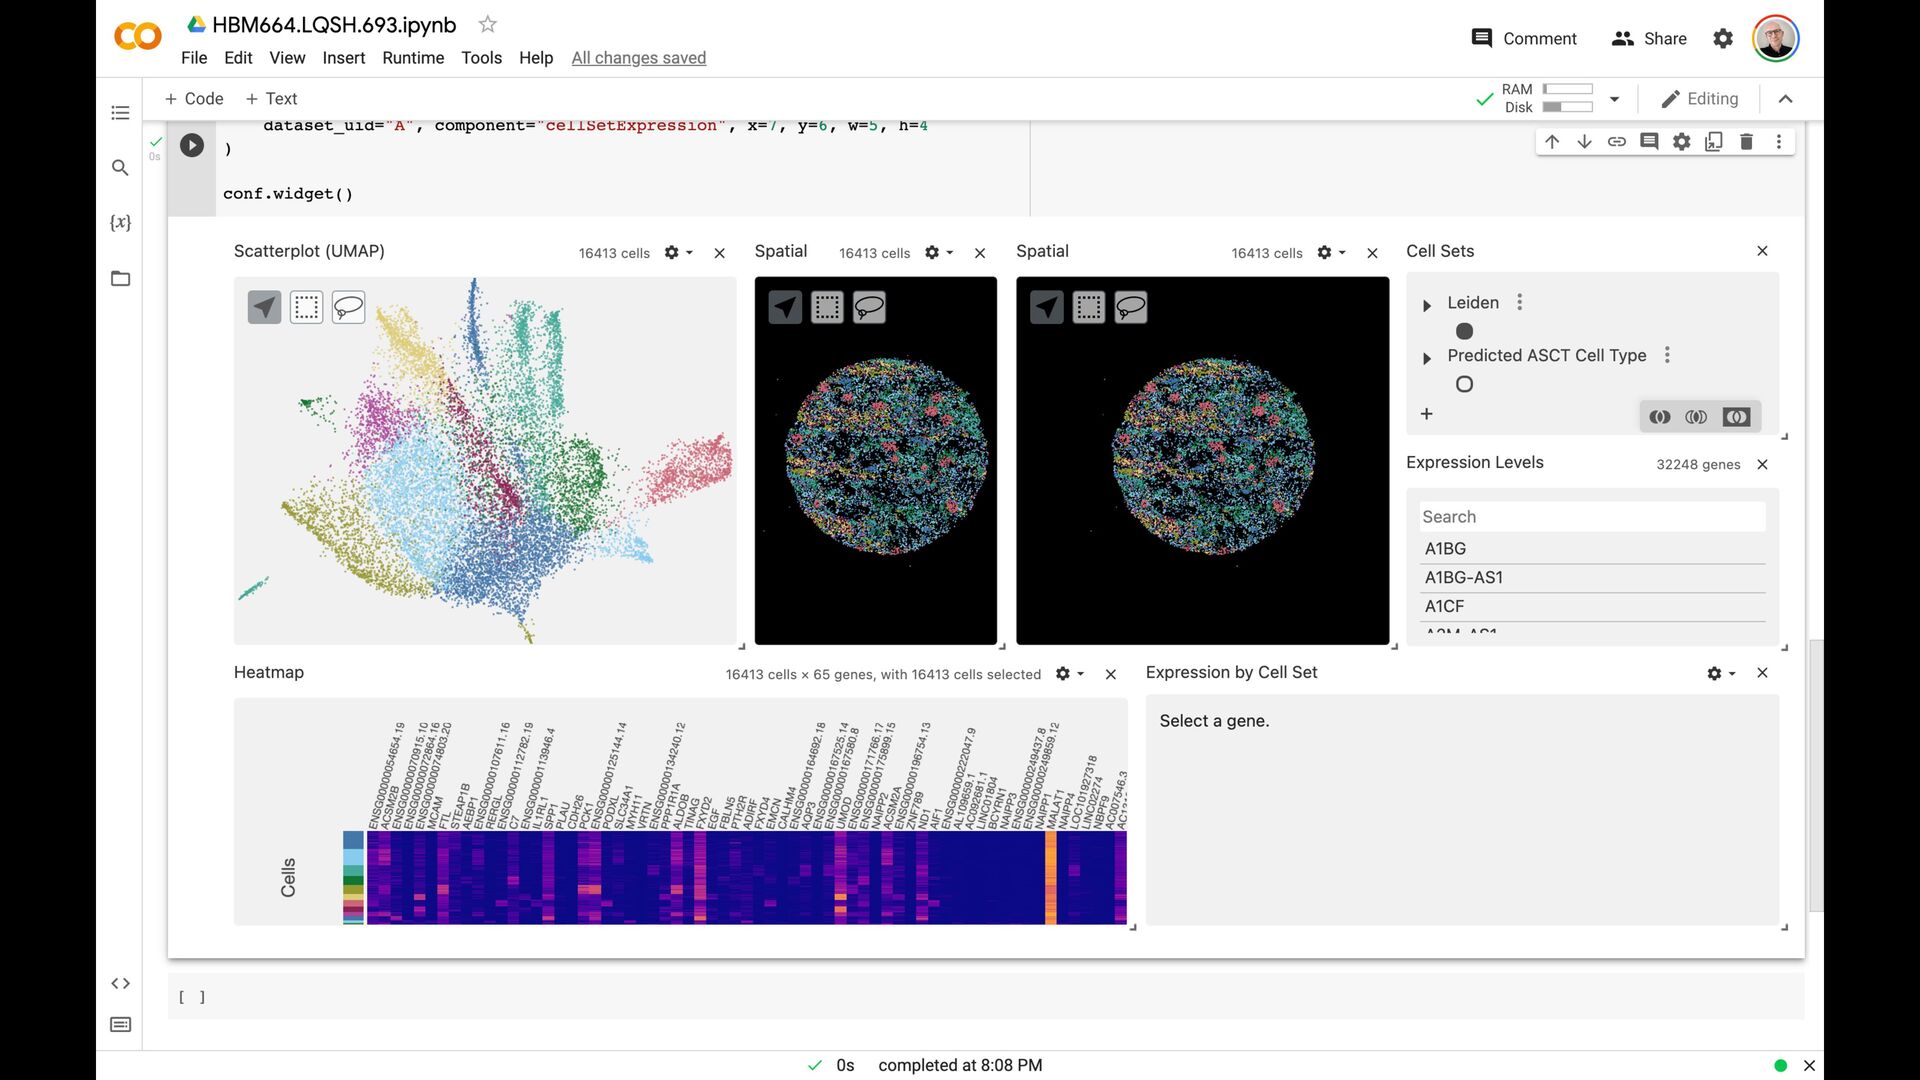
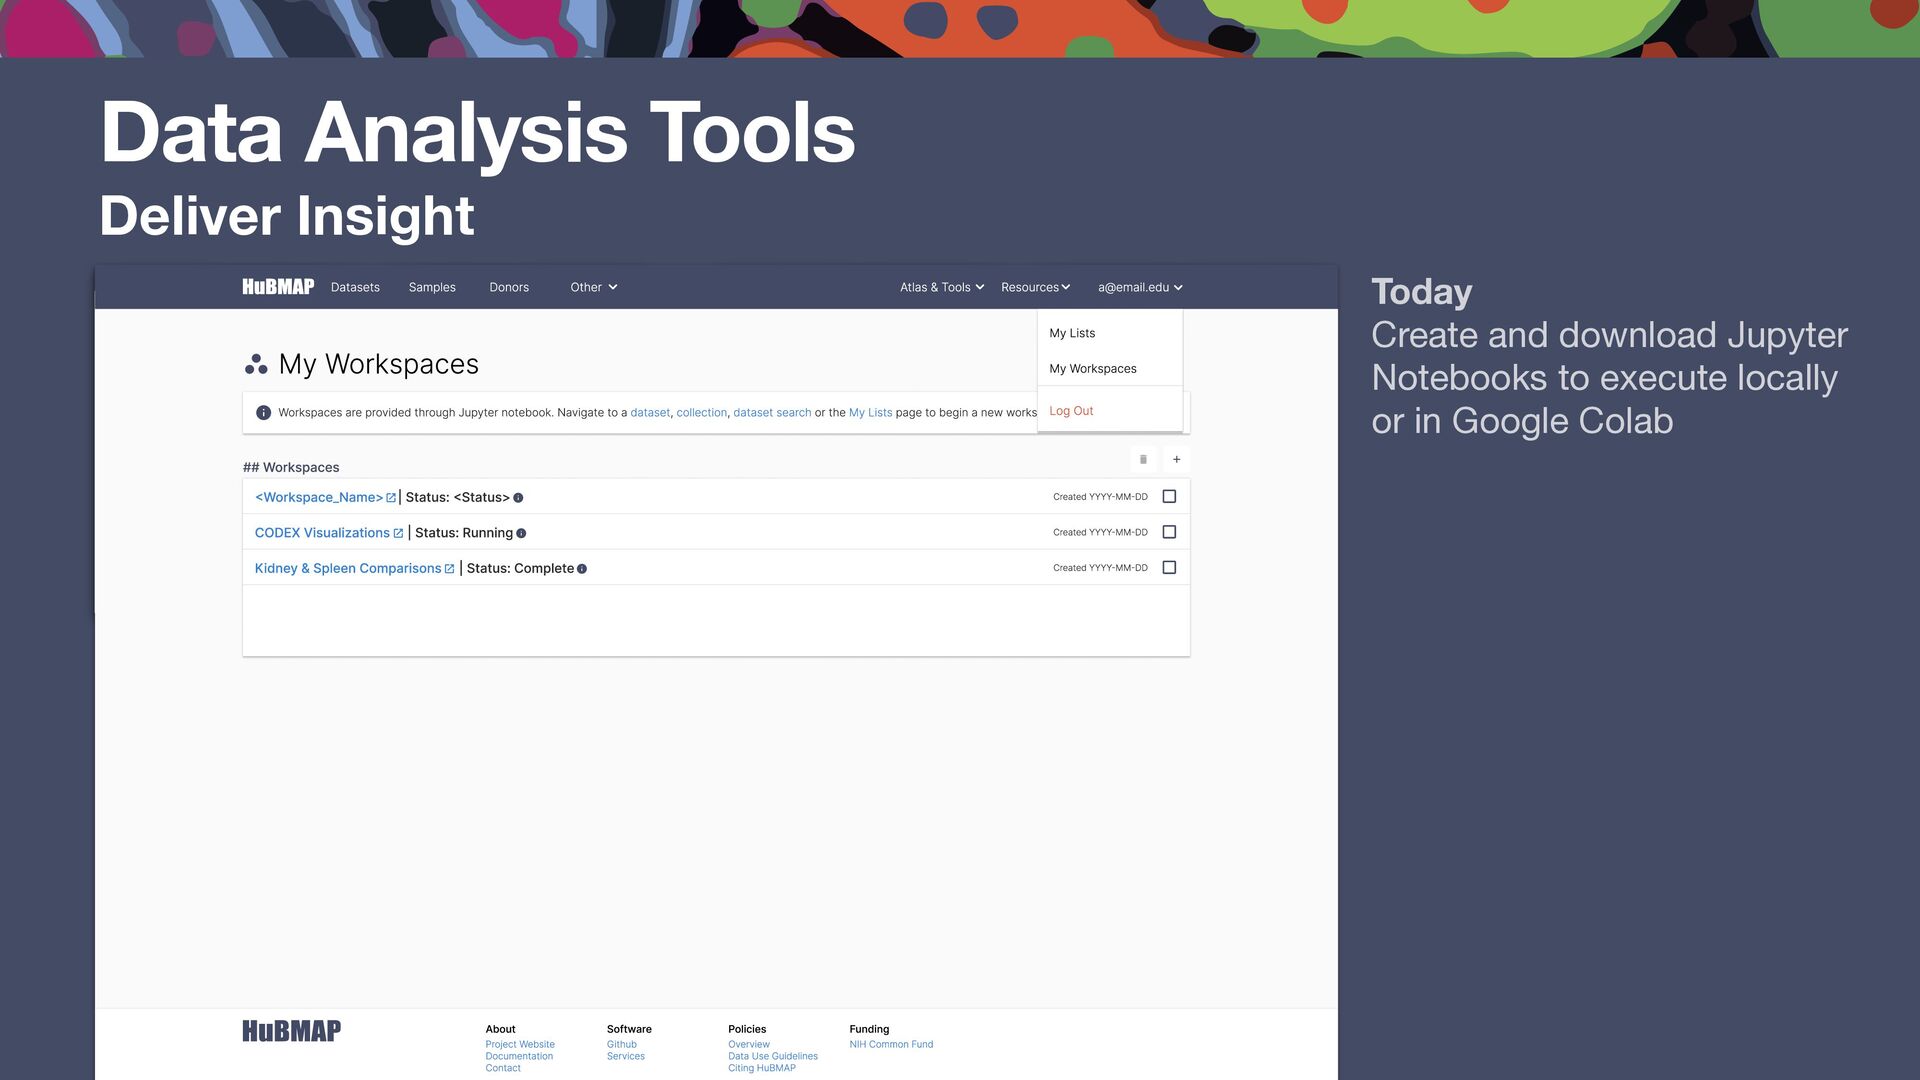
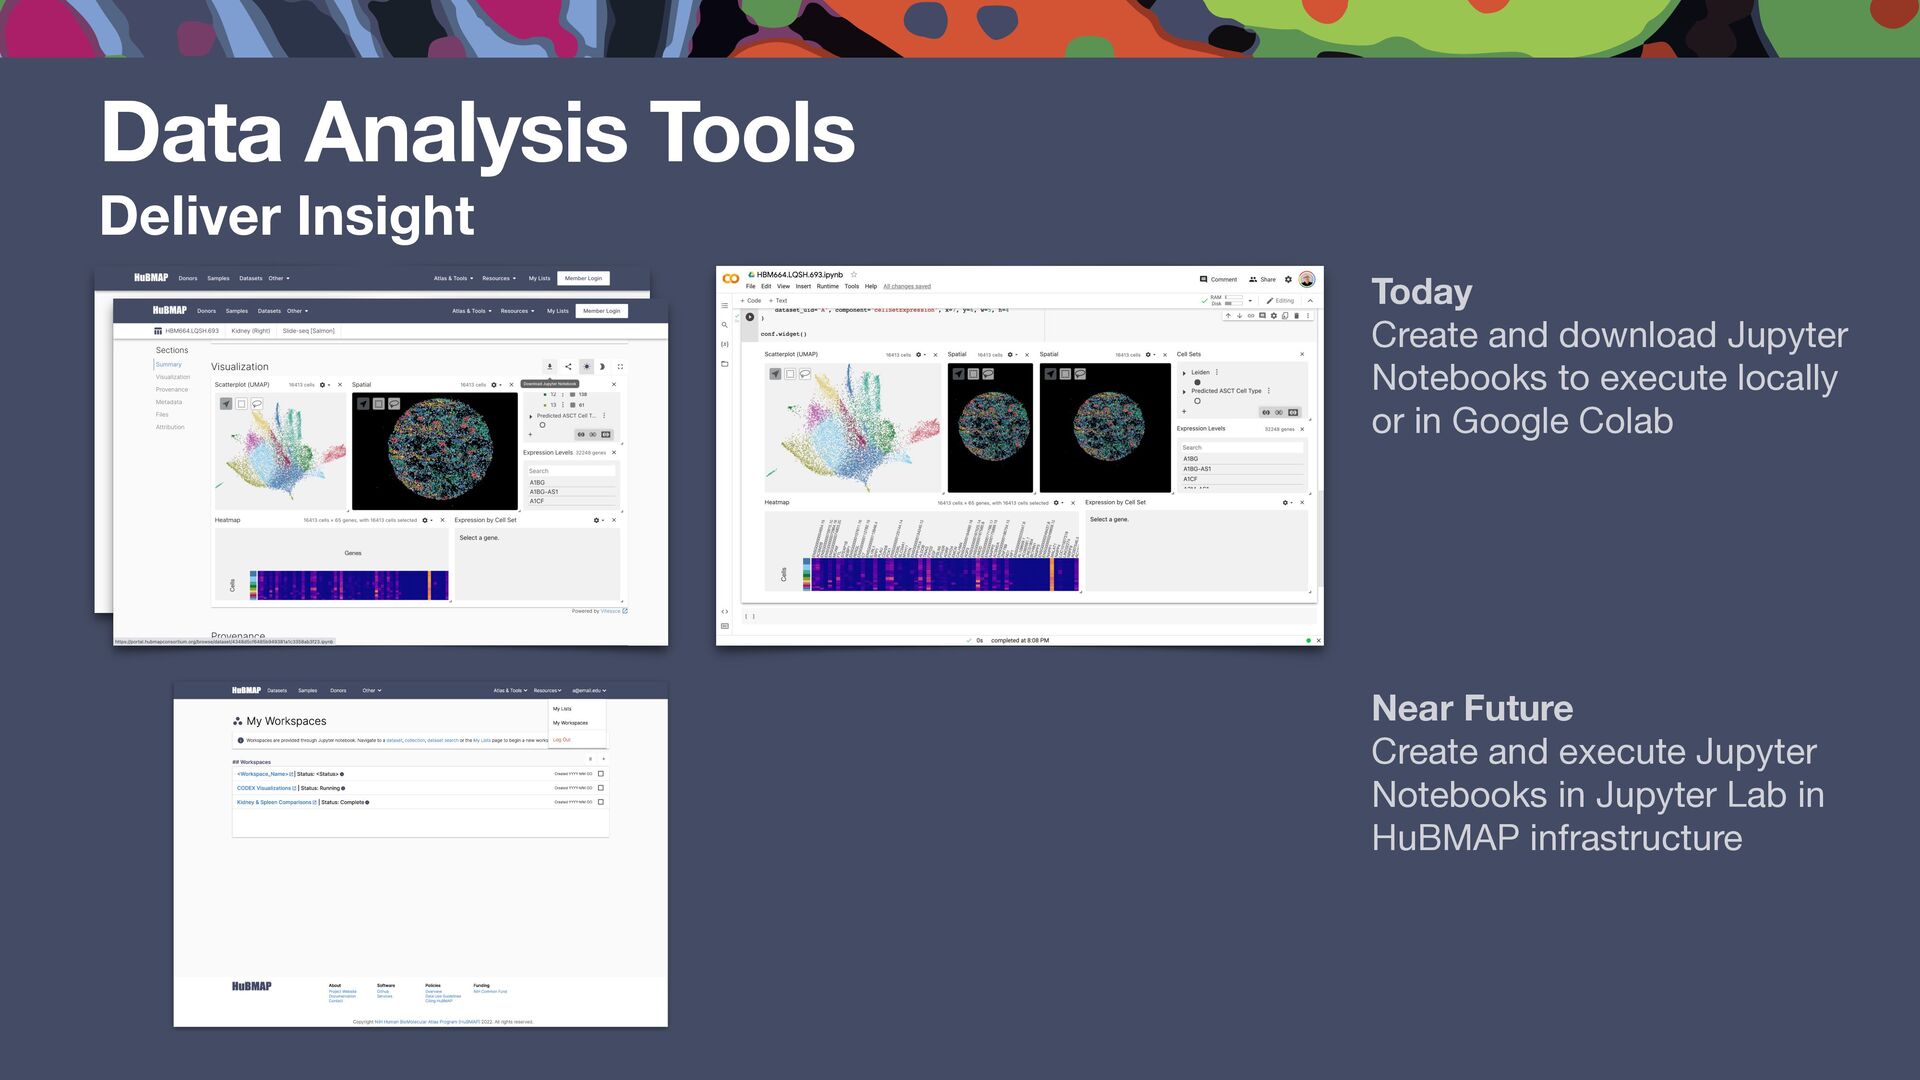
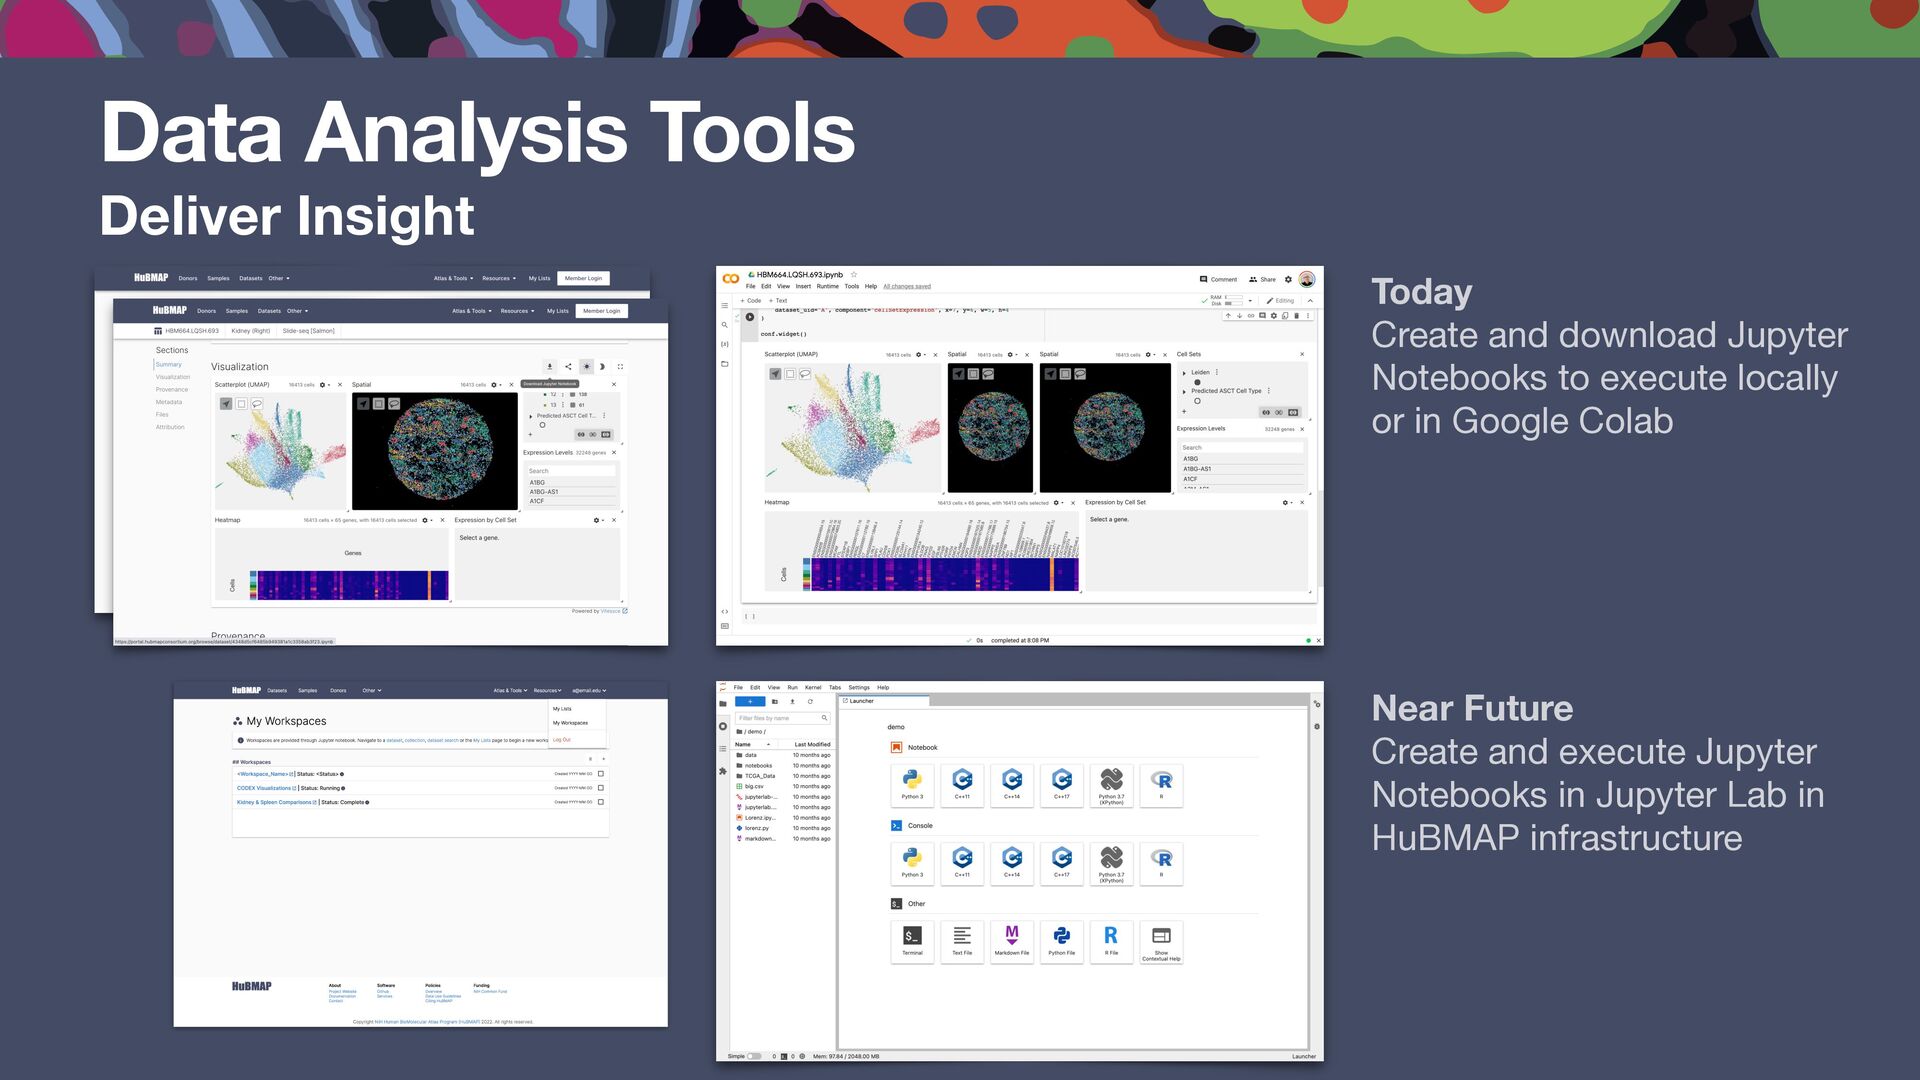
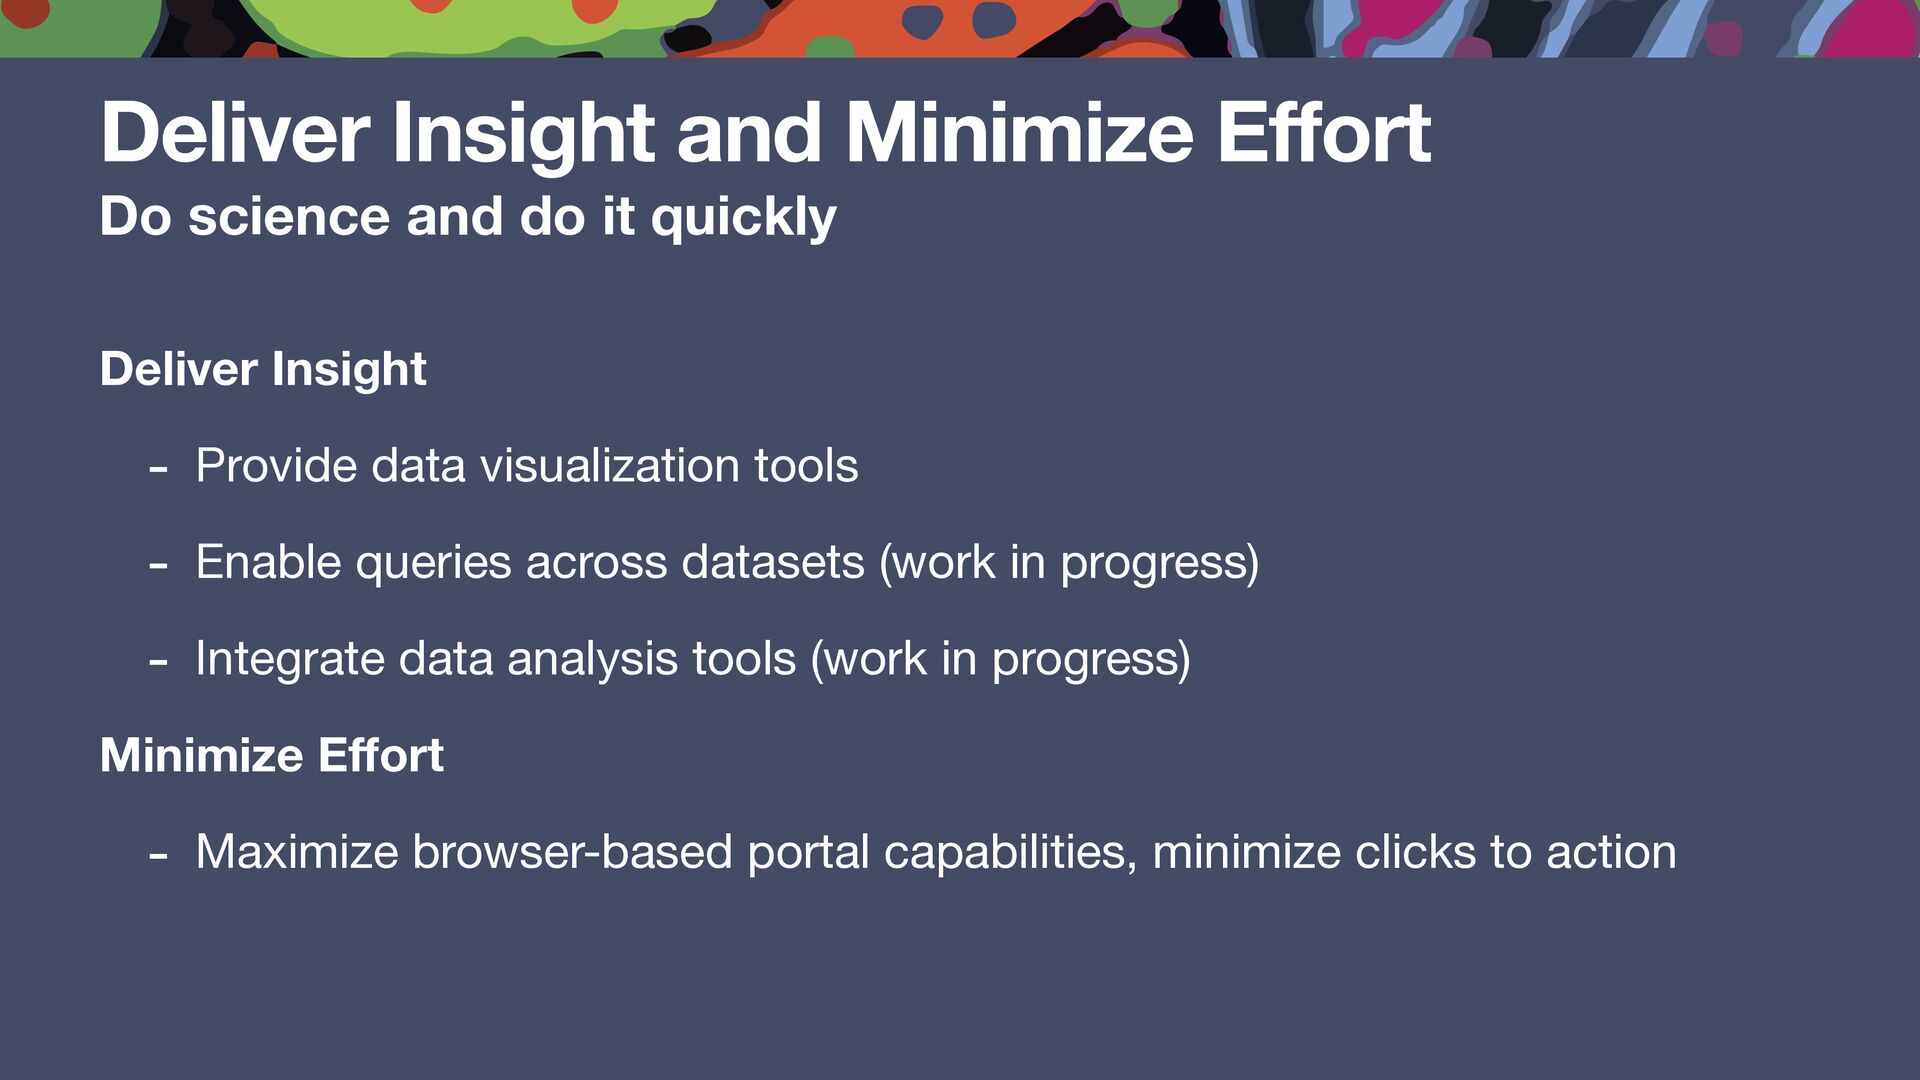
quickly Deliver Insight - Provide data visualization tools - Enable queries across datasets (work in progress) - Integrate data analysis tools (work in progress) Minimize Effort - Maximize browser-based portal capabilities, minimize clicks to action
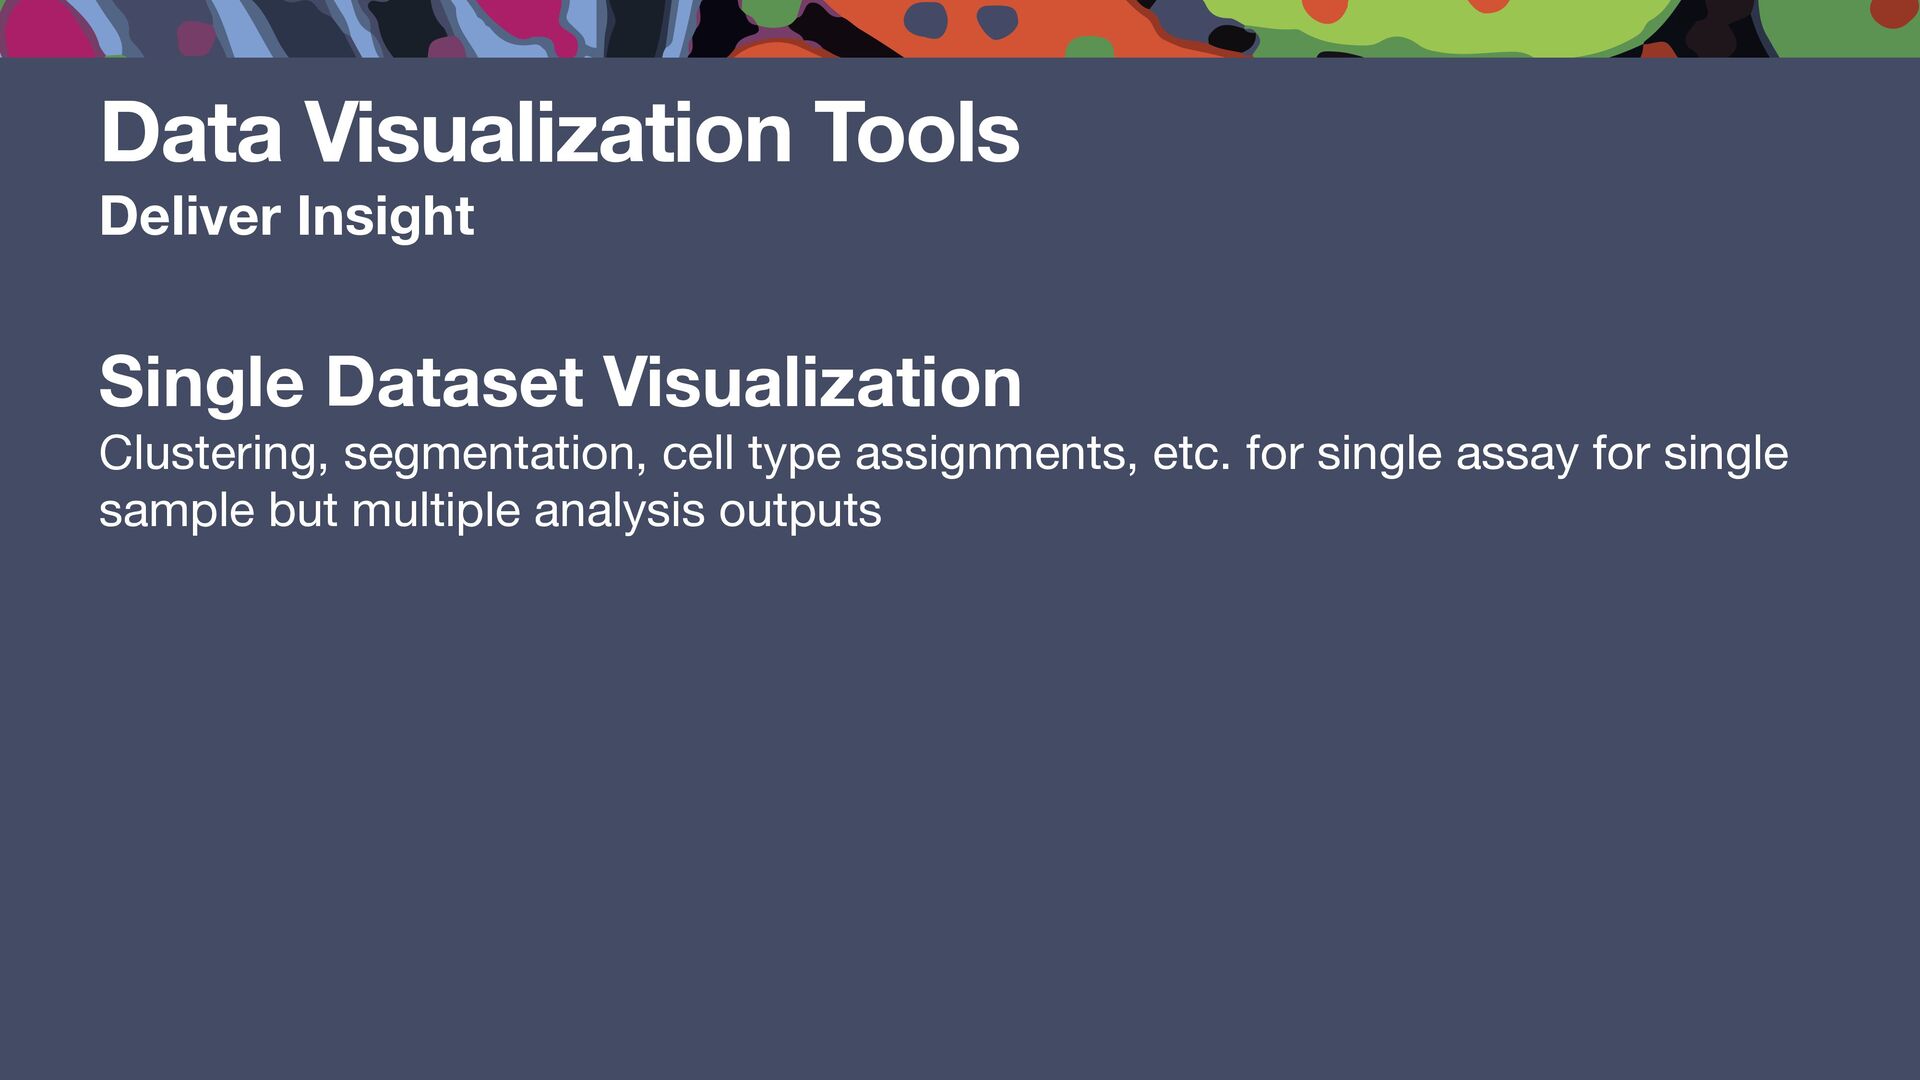
assignments, etc. for single assay for single sample but multiple analysis outputs Multi Dataset Visualization Multiple samples of single assay, multiple assays for single sample, etc. Altas Visualization UIs to test hypotheses, build models, and make predictions Deliver Insight
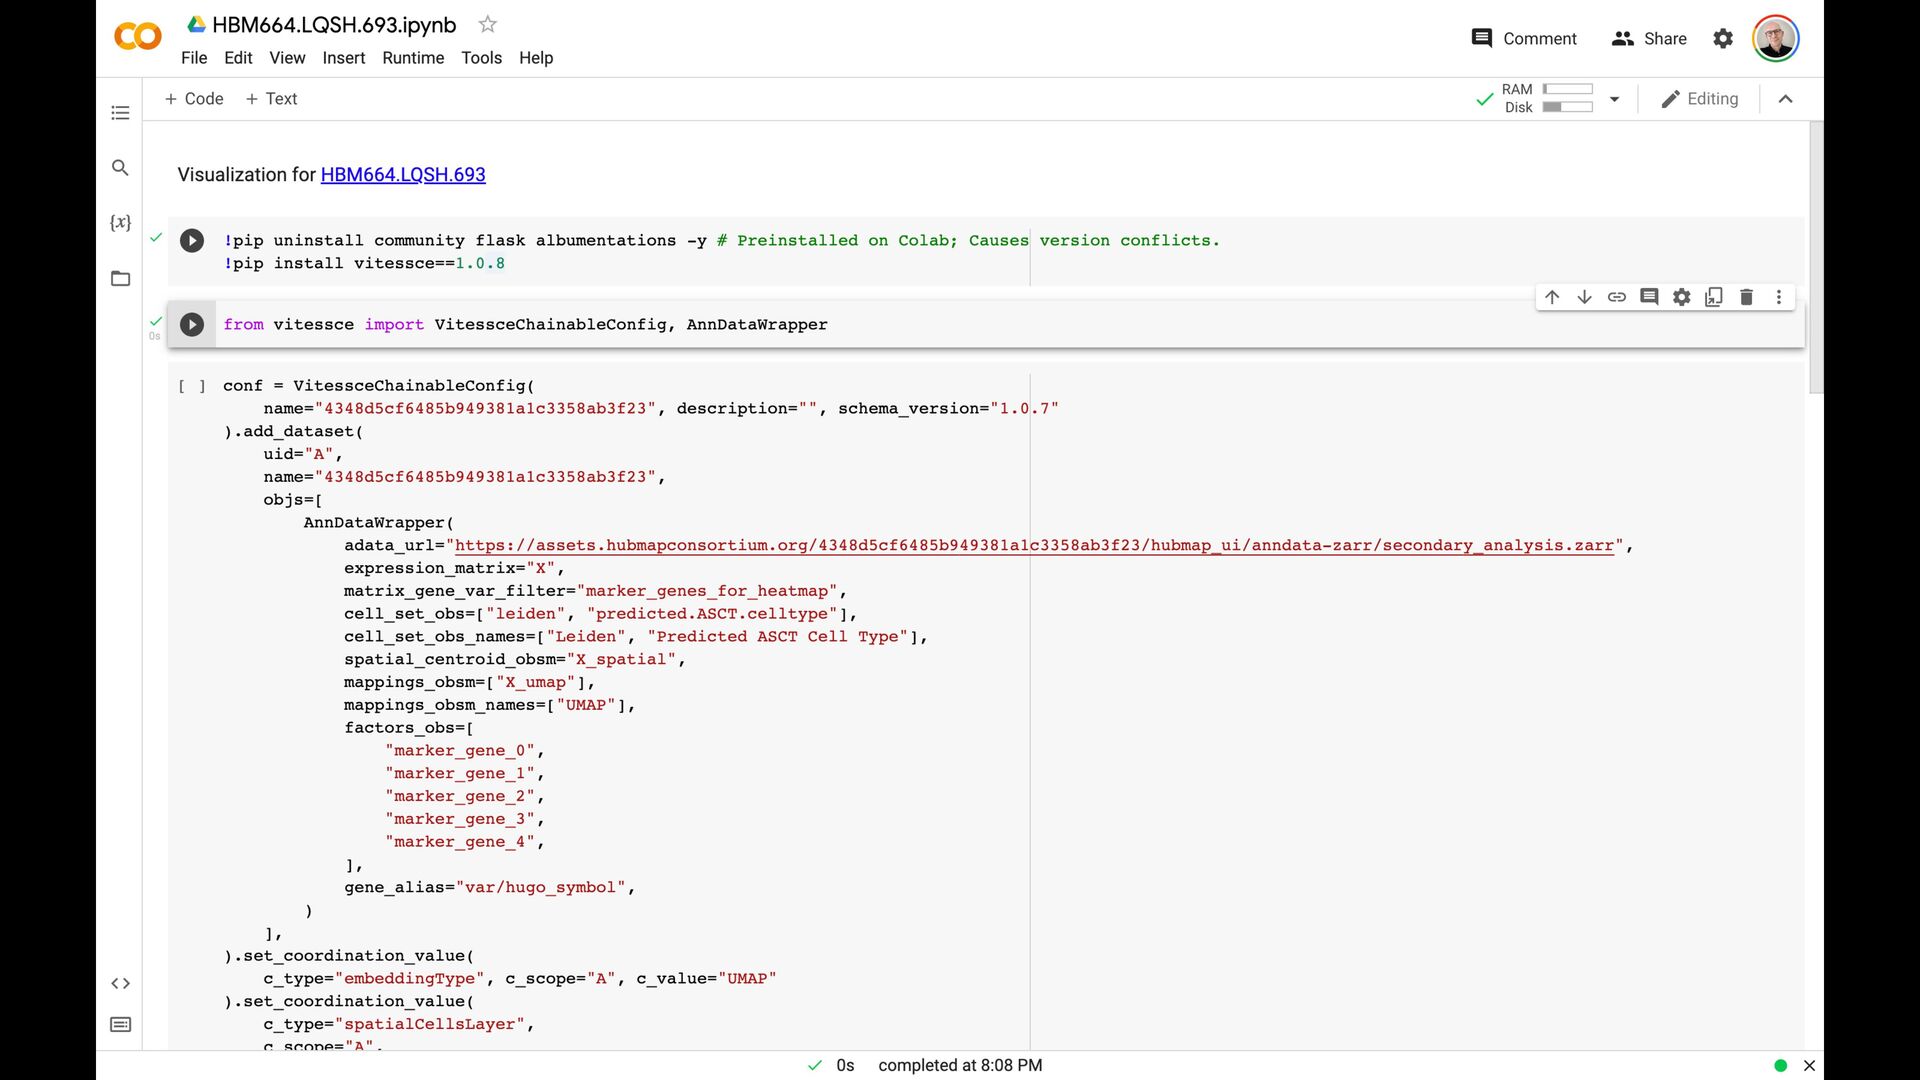
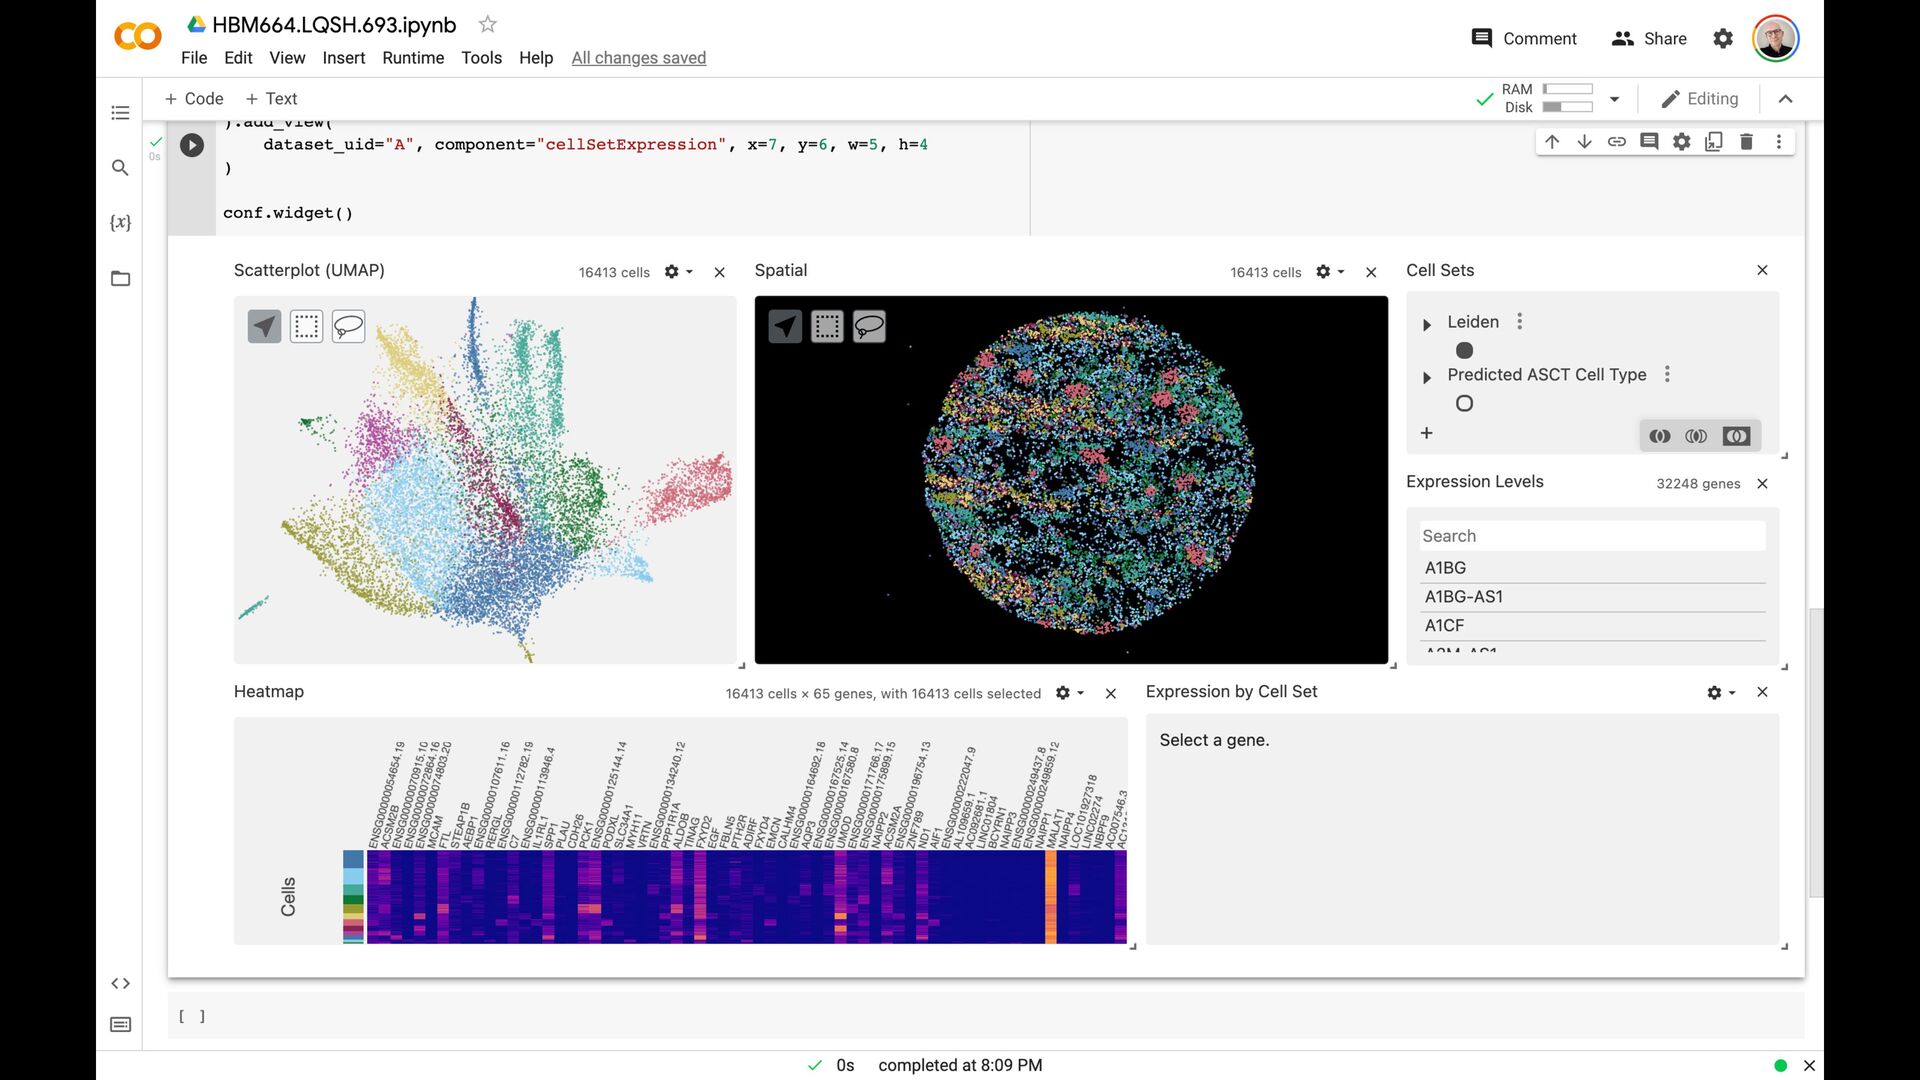
HuBMAP Data Portal Focus on computational analysts - Support cutting edge work - Extensible solution that enables community contributions - Combine HuBMAP data with user data - Use HuBMAP infrastructure for computation and storage - Enable pick up where portal UI functionality leaves off
quickly Deliver Insight - Provide data visualization tools - Enable queries across datasets (work in progress) - Integrate data analysis tools (work in progress) Minimize Effort - Maximize browser-based portal capabilities, minimize clicks to action
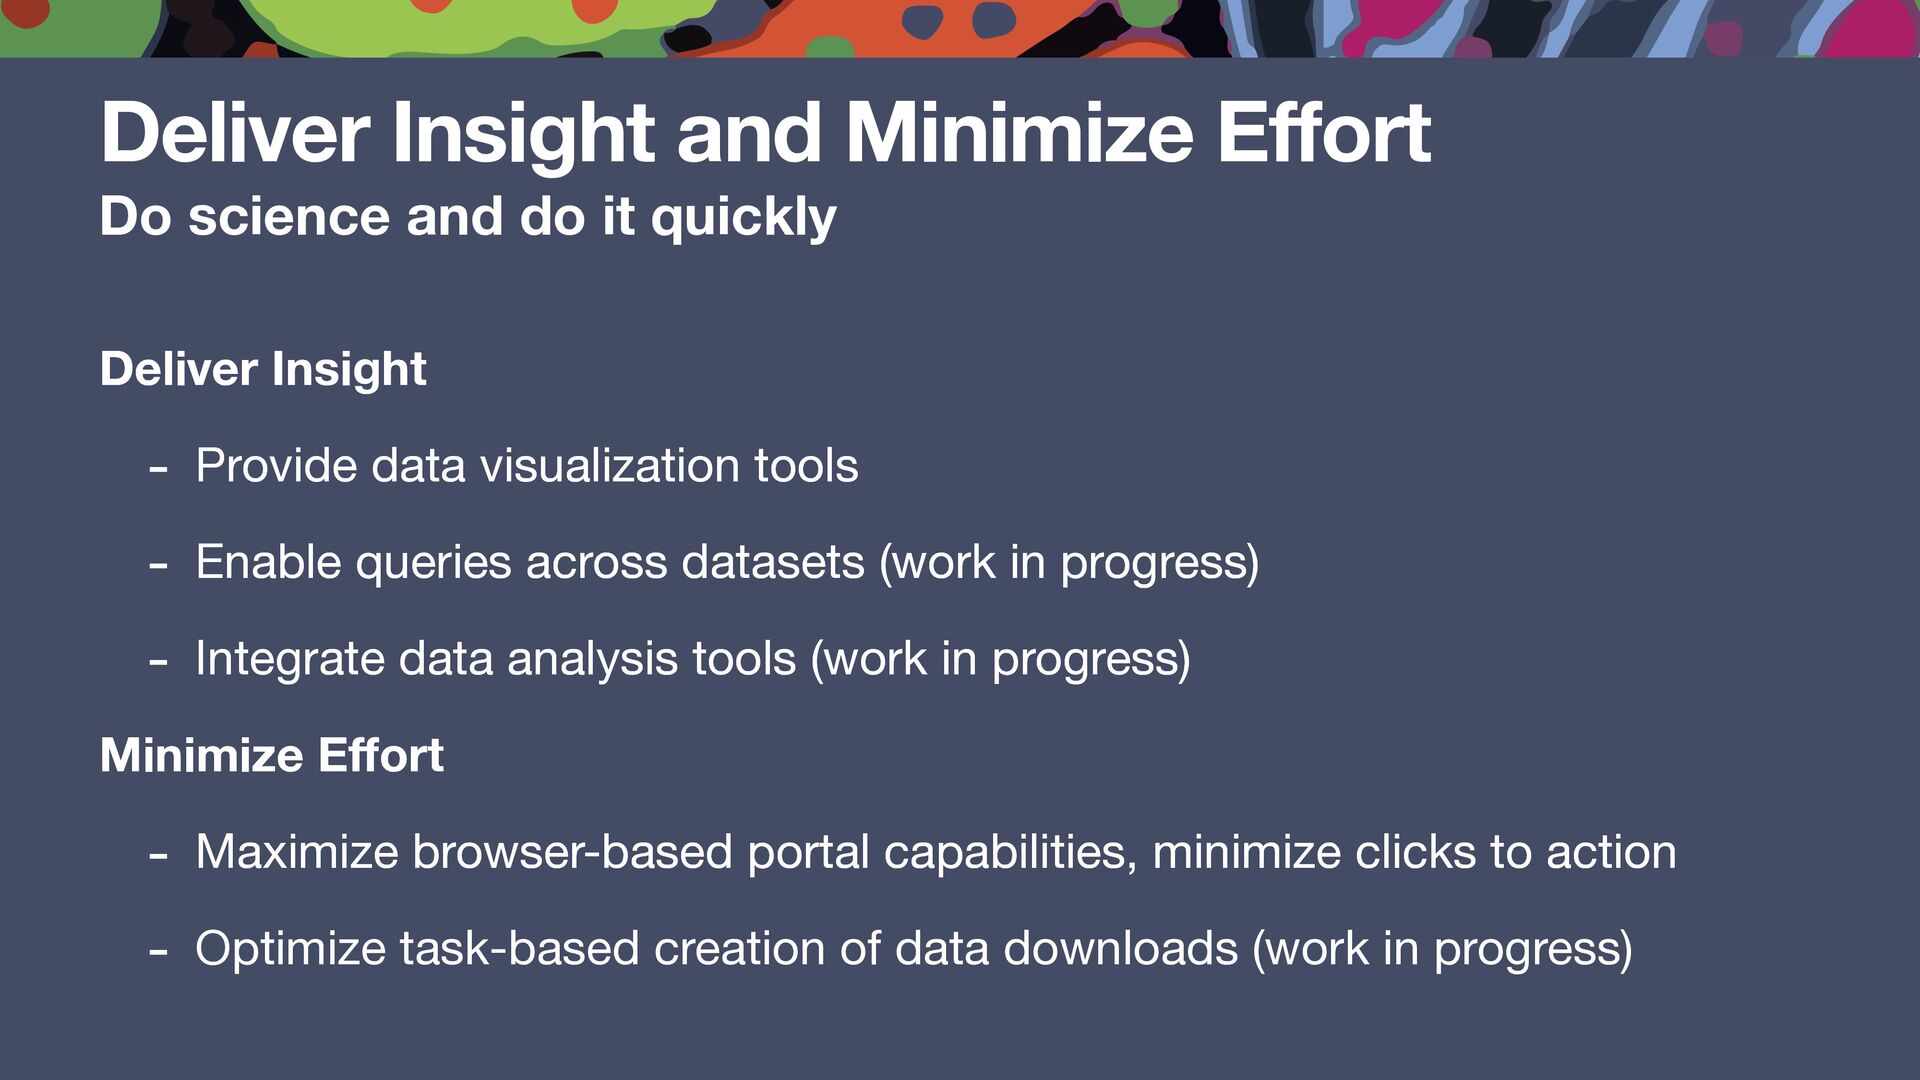
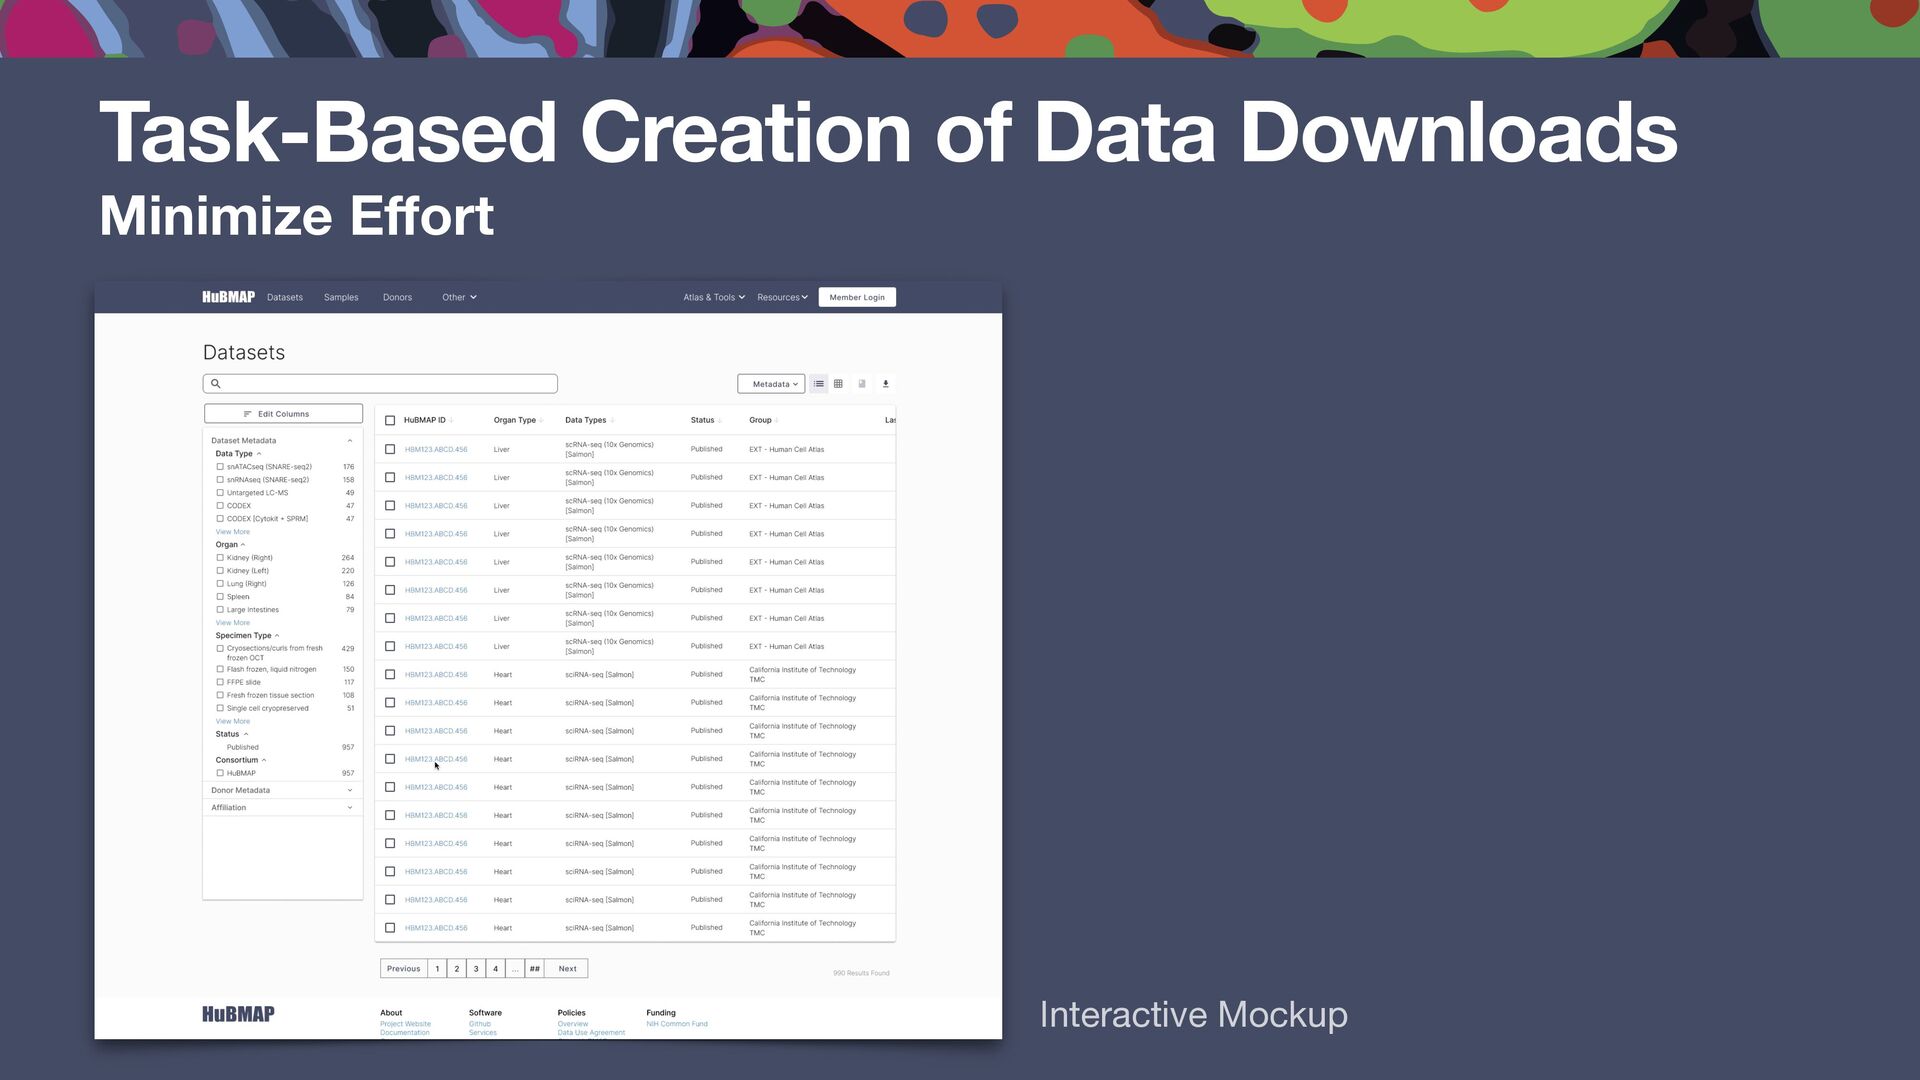
quickly Deliver Insight - Provide data visualization tools - Enable queries across datasets (work in progress) - Integrate data analysis tools (work in progress) Minimize Effort - Maximize browser-based portal capabilities, minimize clicks to action Deliver Insight - Provide data visualization tools - Enable queries across datasets (work in progress) - Integrate data analysis tools (work in progress) Minimize Effort - Maximize browser-based portal capabilities, minimize clicks to action - Optimize task-based creation of data downloads (work in progress)
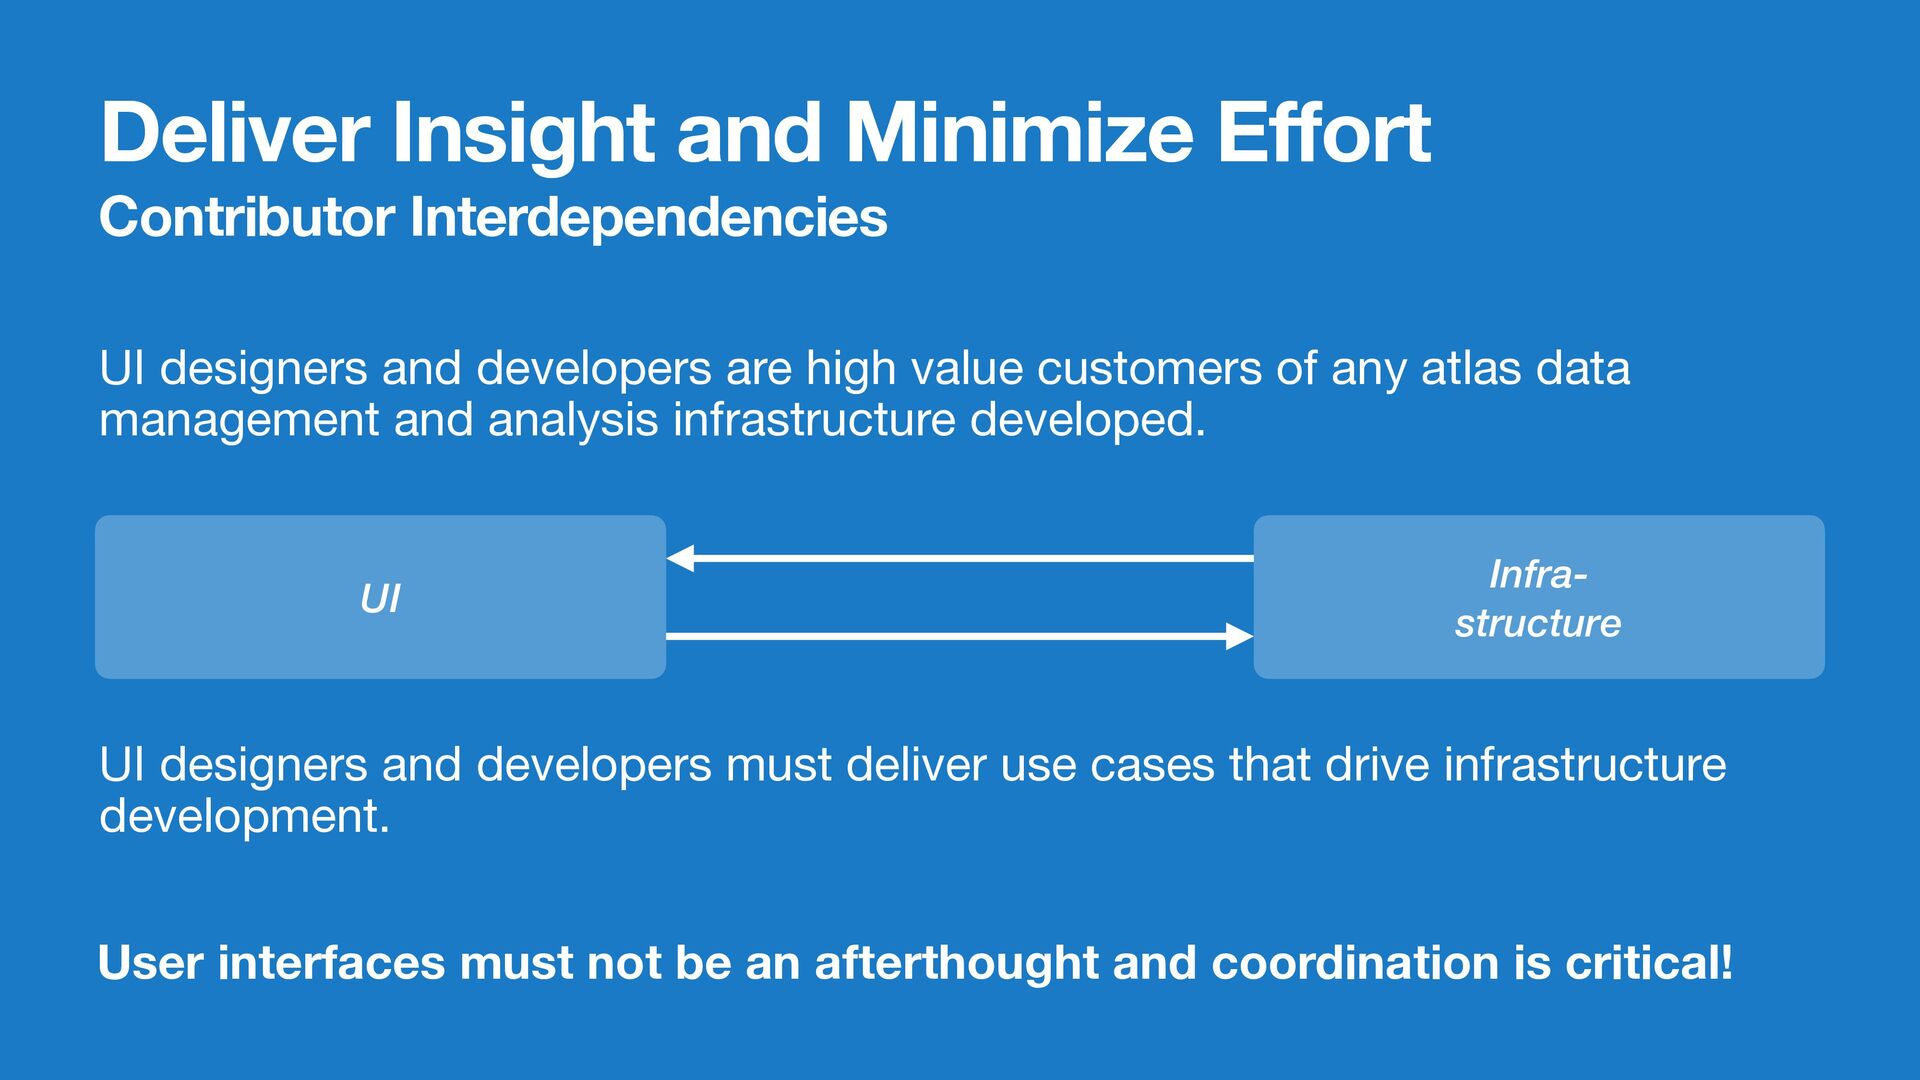
developers are high value customers of any atlas data management and analysis infrastructure developed. UI designers and developers must deliver use cases that drive infrastructure development. UI Infra- structure User interfaces must not be an afterthought and coordination is critical!
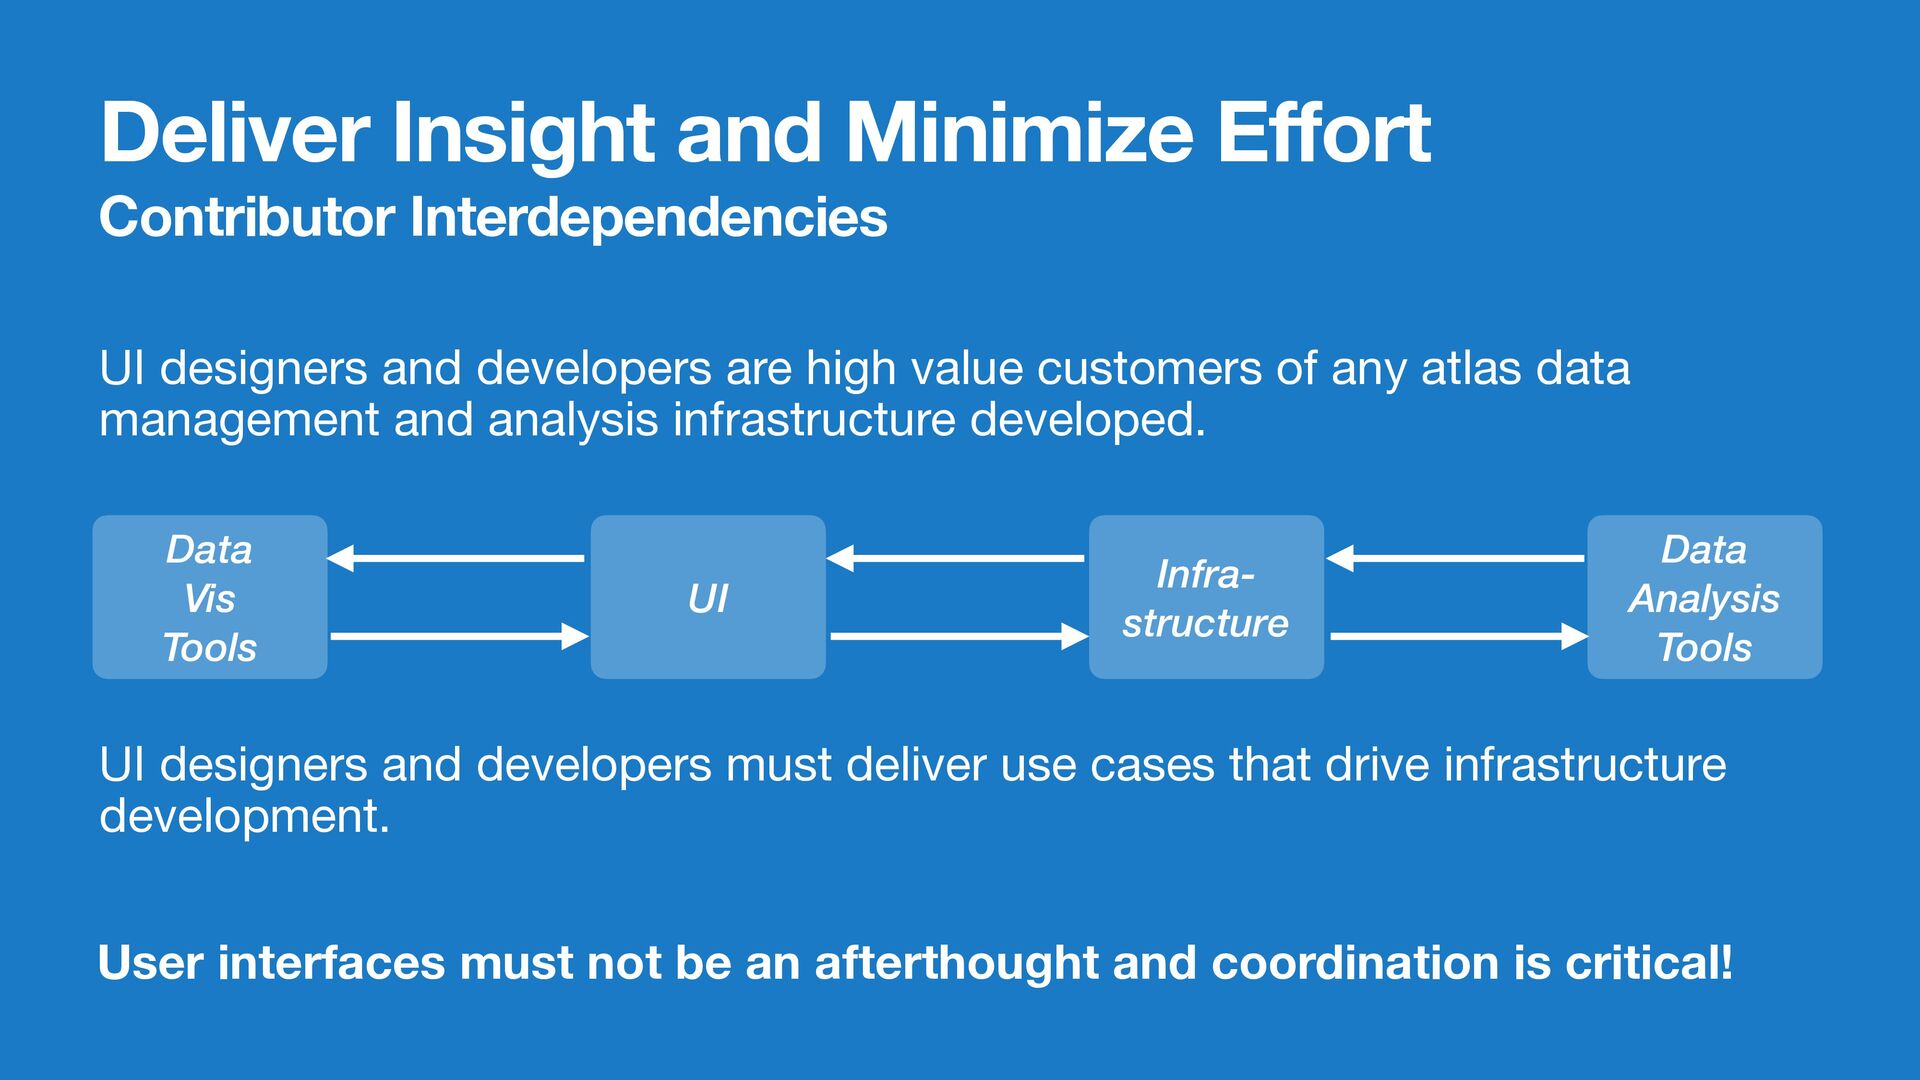
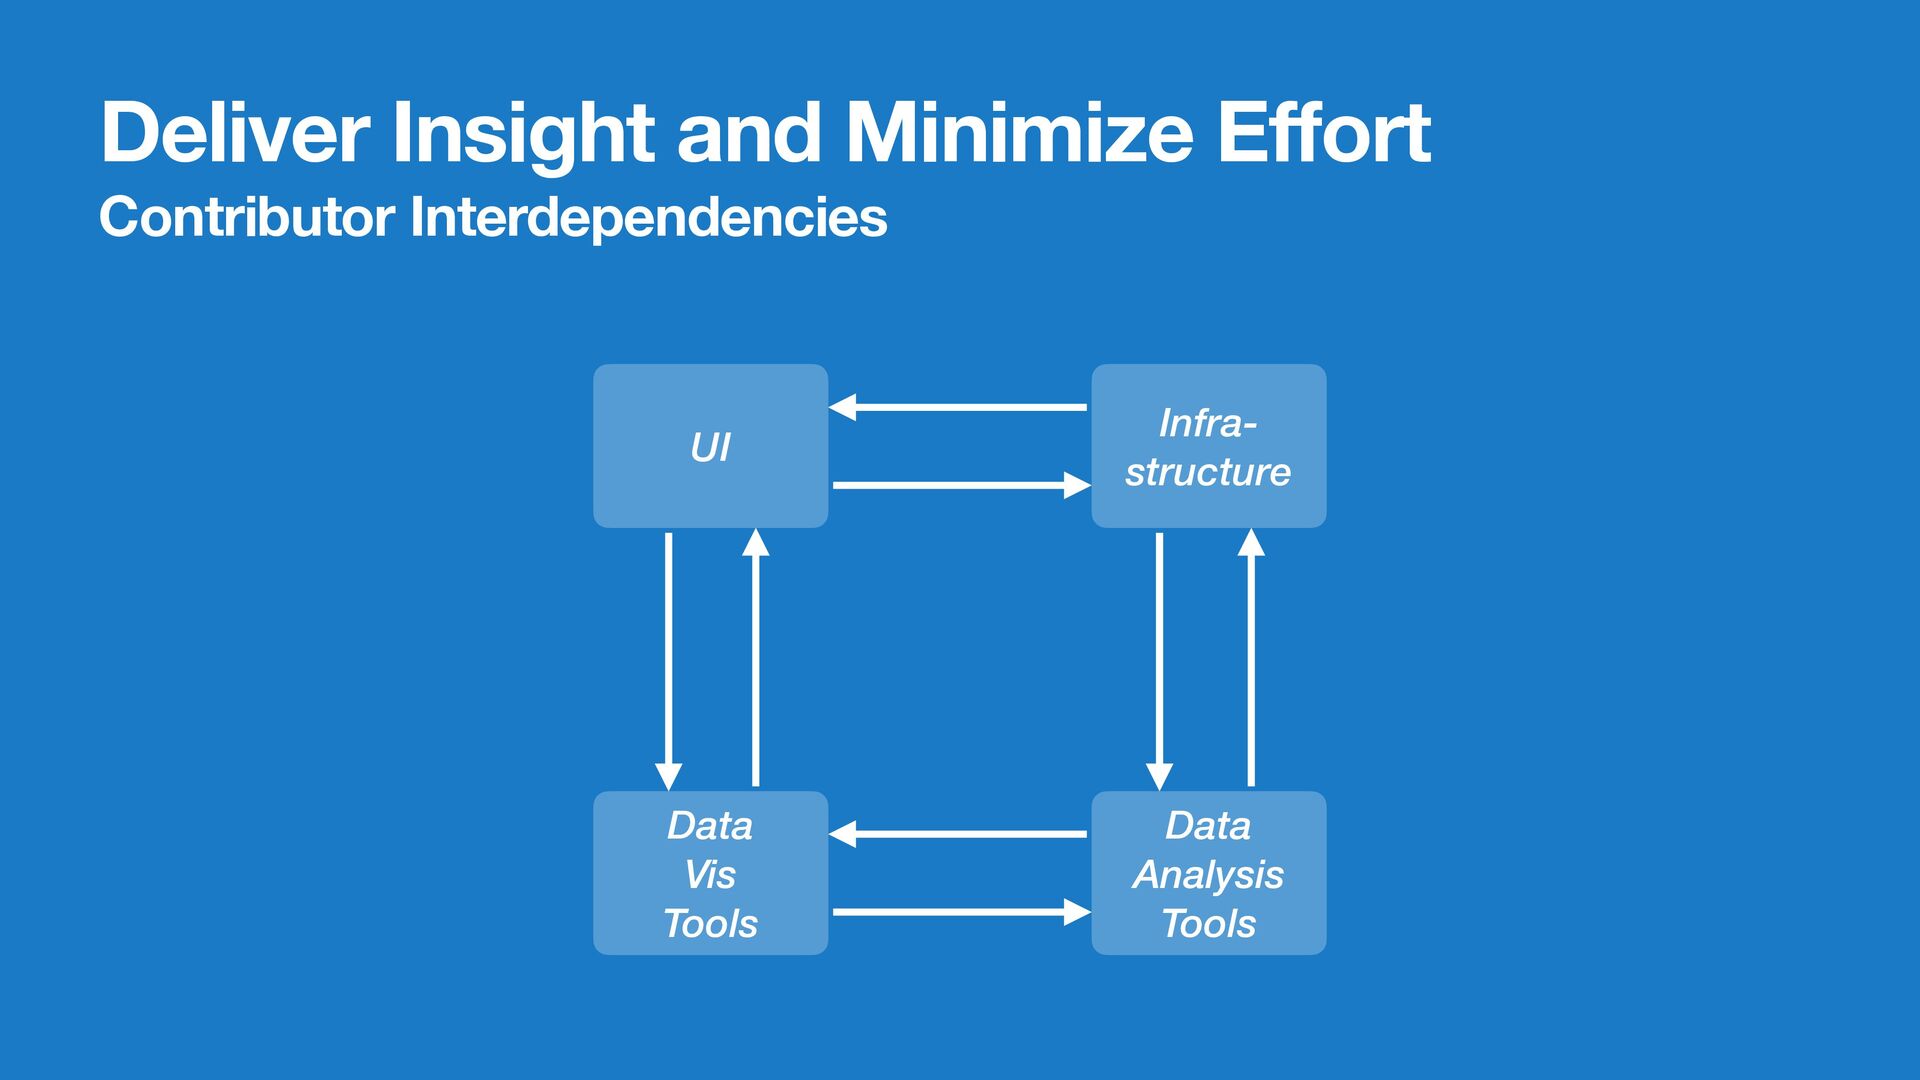
Data Analysis Tools Data Vis Tools UI designers and developers are high value customers of any atlas data management and analysis infrastructure developed. UI designers and developers must deliver use cases that drive infrastructure development. User interfaces must not be an afterthought and coordination is critical!
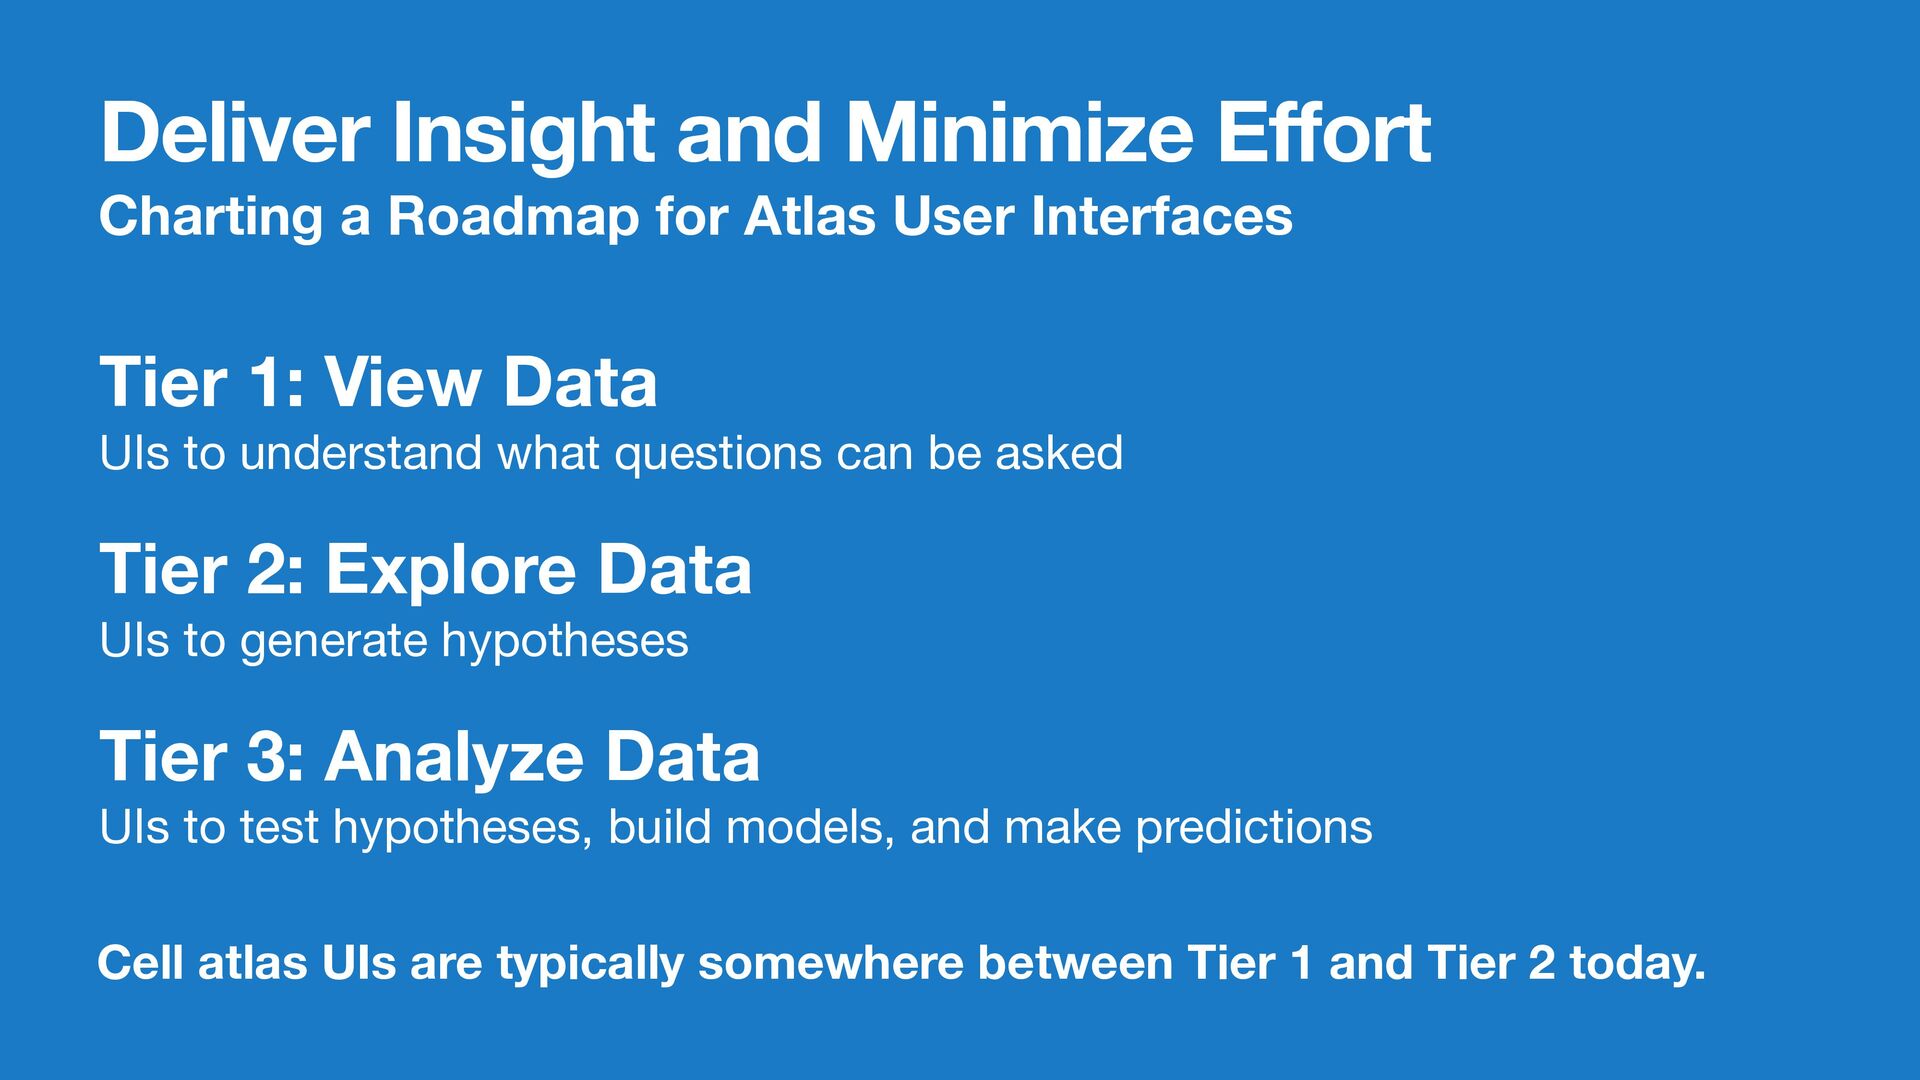
User Interfaces Tier 1: View Data UIs to understand what questions can be asked Tier 2: Explore Data UIs to generate hypotheses Tier 3: Analyze Data UIs to test hypotheses, build models, and make predictions Cell atlas UIs are typically somewhere between Tier 1 and Tier 2 today.
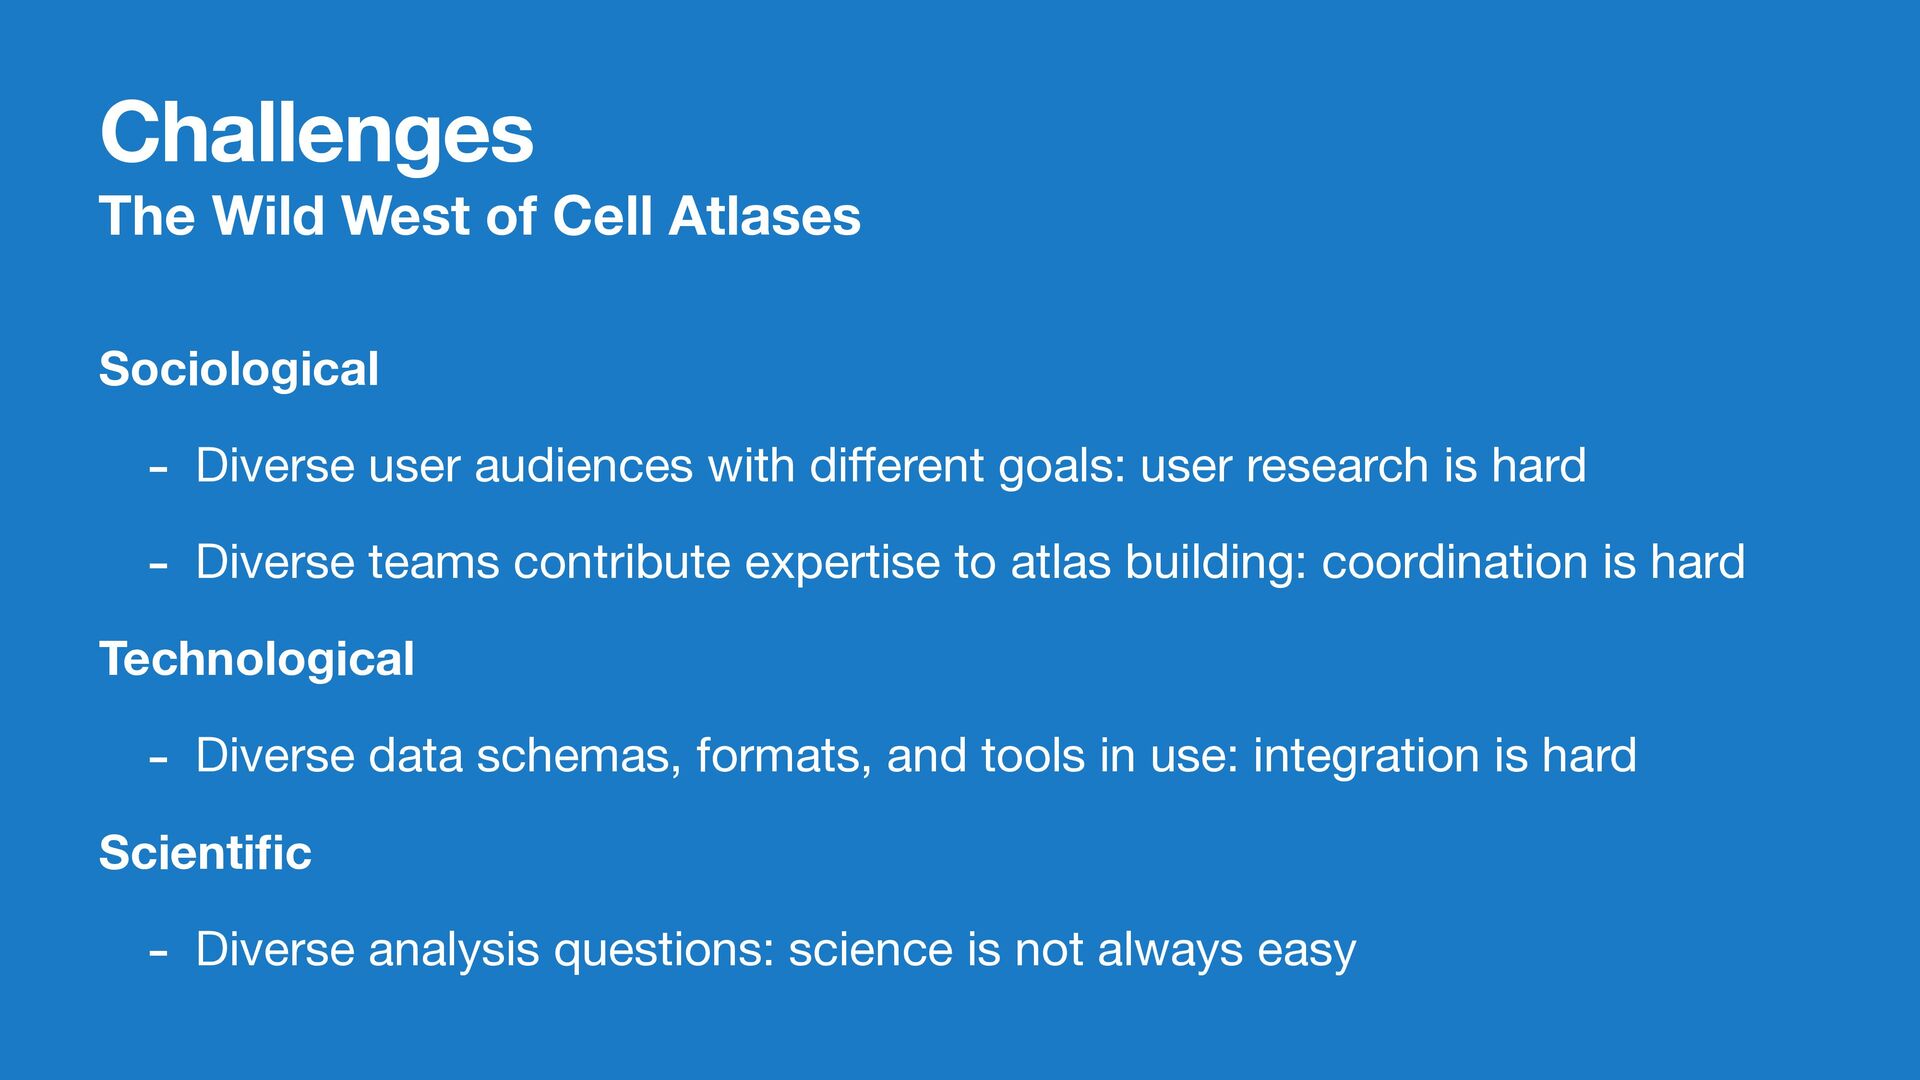
user audiences with different goals: user research is hard - Diverse teams contribute expertise to atlas building: coordination is hard Technological - Diverse data schemas, formats, and tools in use: integration is hard Scientific - Diverse analysis questions: science is not always easy
atlas user interface development - Share use cases, personas, and other user research artifacts - Agree on common data schemas and formats Consider APIs user interfaces - Many analysts will interact with data primarily through APIs and serving their needs for efficient data access will accelerate science What else can we do? Postdoctoral Fellow (Senior) UI/UX Developer (Senior) Software Developer Apply for a position in my lab as a Email [email protected] if interested!