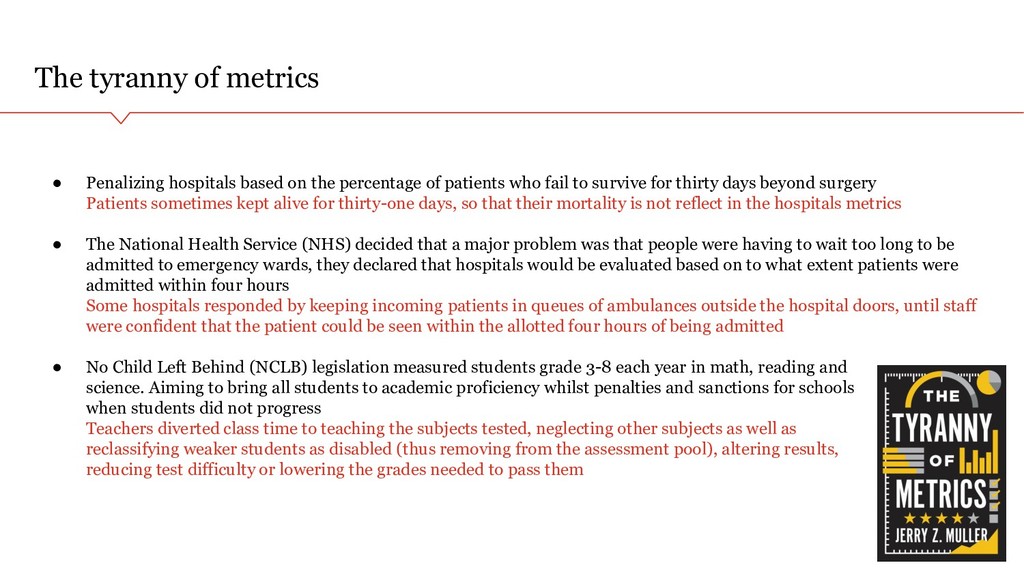
percentage of patients who fail to survive for thirty days beyond surgery Patients sometimes kept alive for thirty-one days, so that their mortality is not reflect in the hospitals metrics • The National Health Service (NHS) decided that a major problem was that people were having to wait too long to be admitted to emergency wards, they declared that hospitals would be evaluated based on to what extent patients were admitted within four hours Some hospitals responded by keeping incoming patients in queues of ambulances outside the hospital doors, until staff were confident that the patient could be seen within the allotted four hours of being admitted • No Child Left Behind (NCLB) legislation measured students grade 3-8 each year in math, reading and science. Aiming to bring all students to academic proficiency whilst penalties and sanctions for schools when students did not progress Teachers diverted class time to teaching the subjects tested, neglecting other subjects as well as reclassifying weaker students as disabled (thus removing from the assessment pool), altering results, reducing test difficulty or lowering the grades needed to pass them
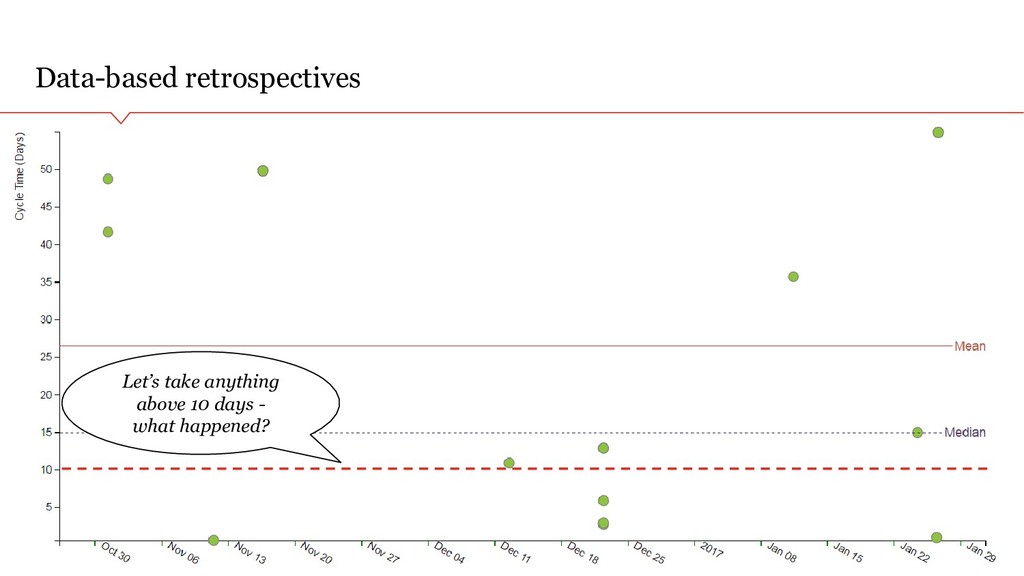
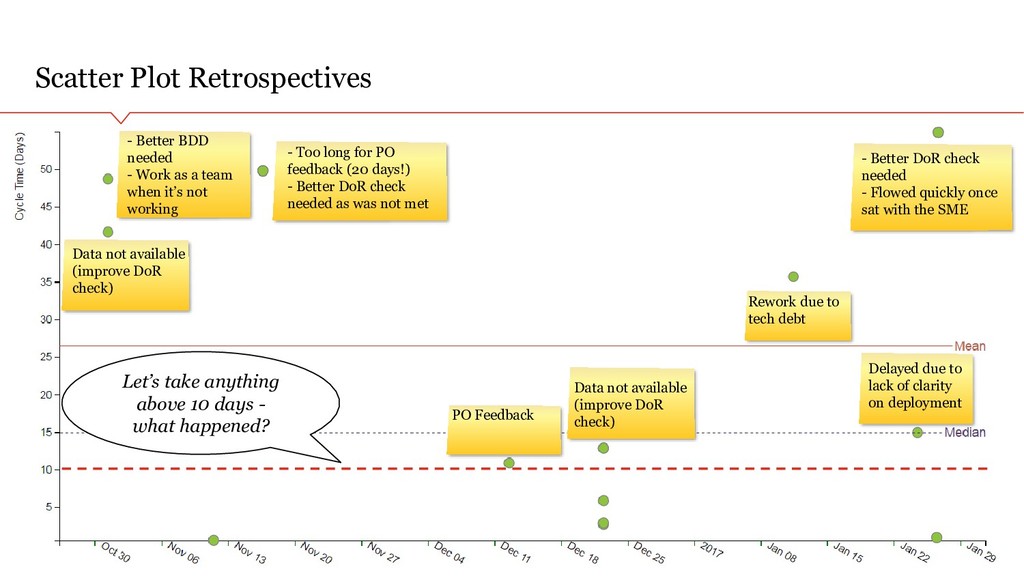
what happened? Data not available (improve DoR check) - Better BDD needed - Work as a team when it’s not working - Too long for PO feedback (20 days!) - Better DoR check needed as was not met PO Feedback Data not available (improve DoR check) Rework due to tech debt - Better DoR check needed - Flowed quickly once sat with the SME Delayed due to lack of clarity on deployment
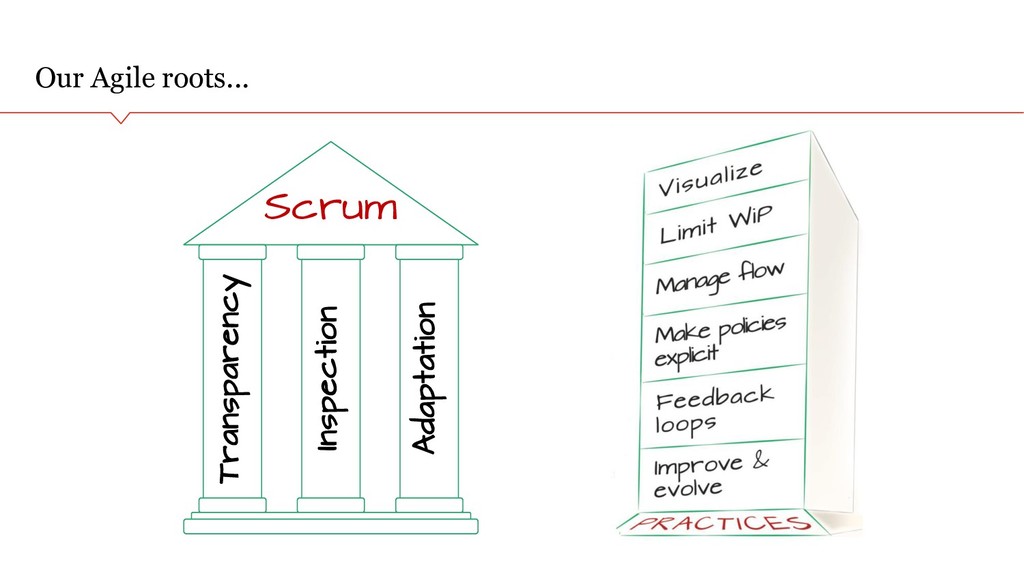
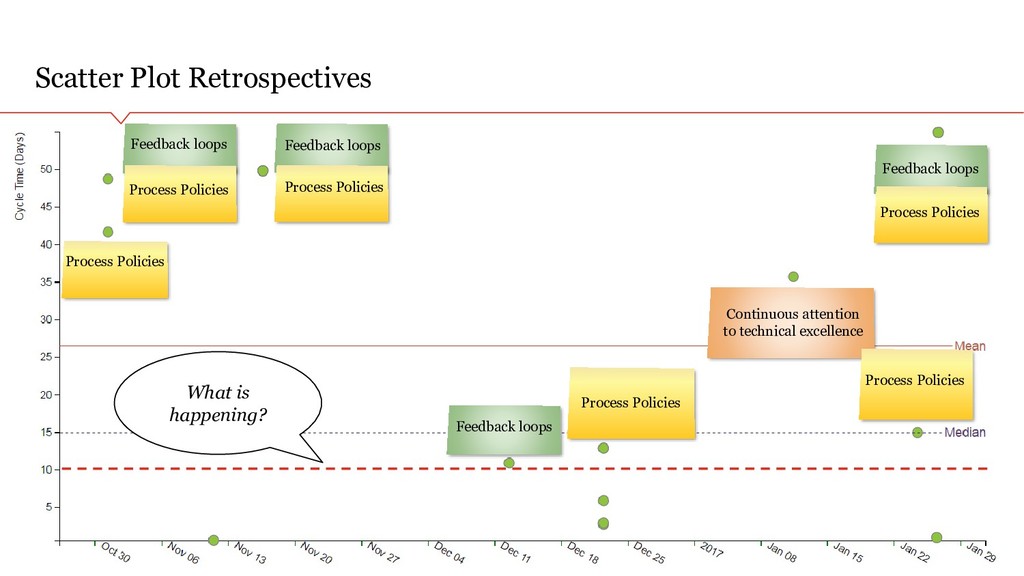
Process Policies Continuous attention to technical excellence Process Policies Process Policies Feedback loops Feedback loops Feedback loops Feedback loops Process Policies
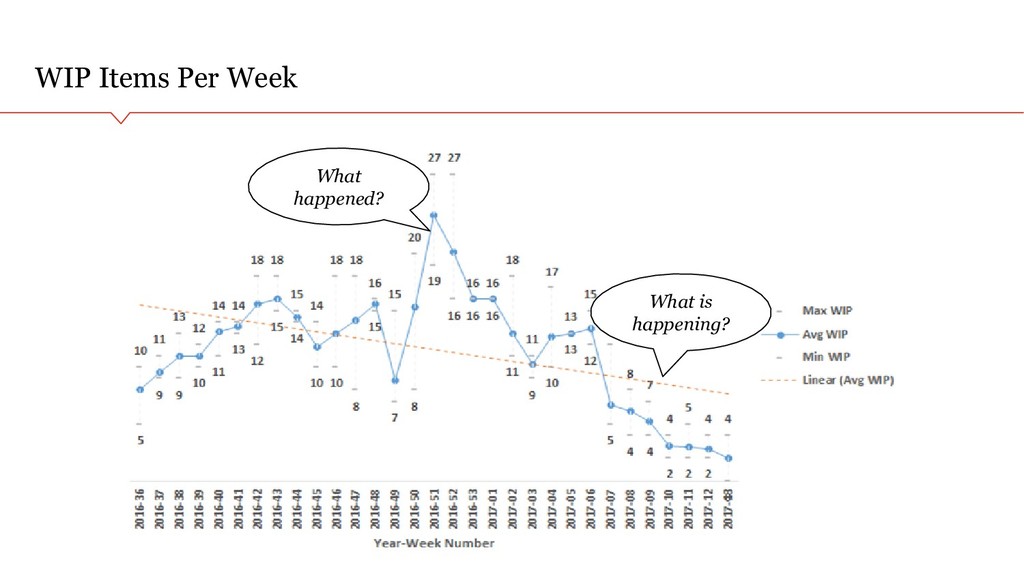
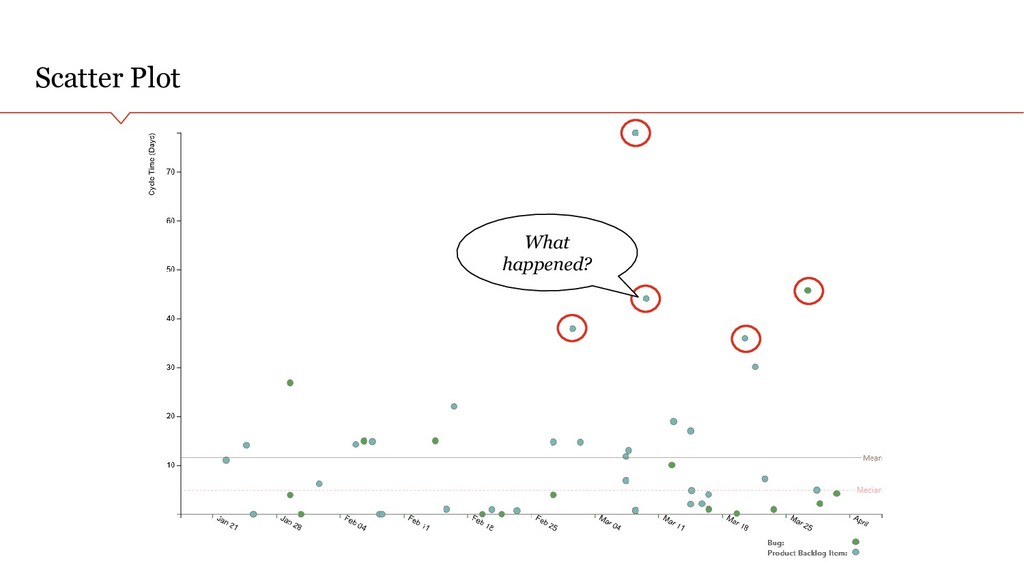
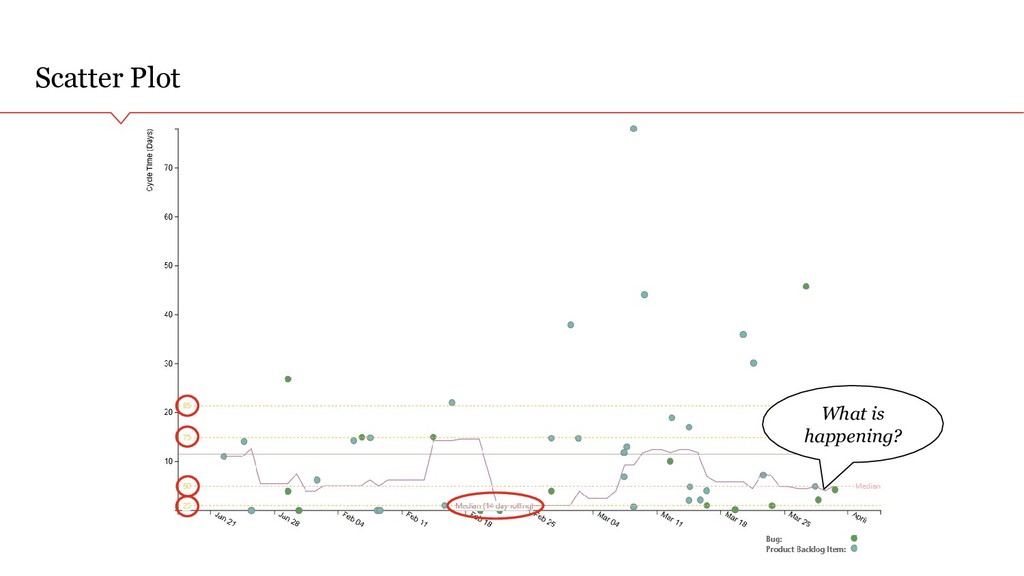
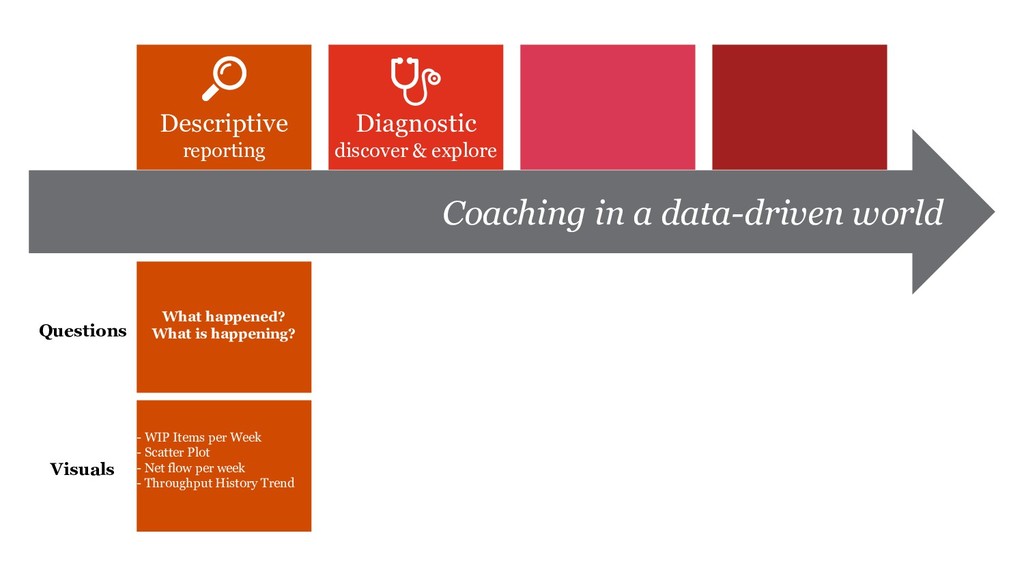
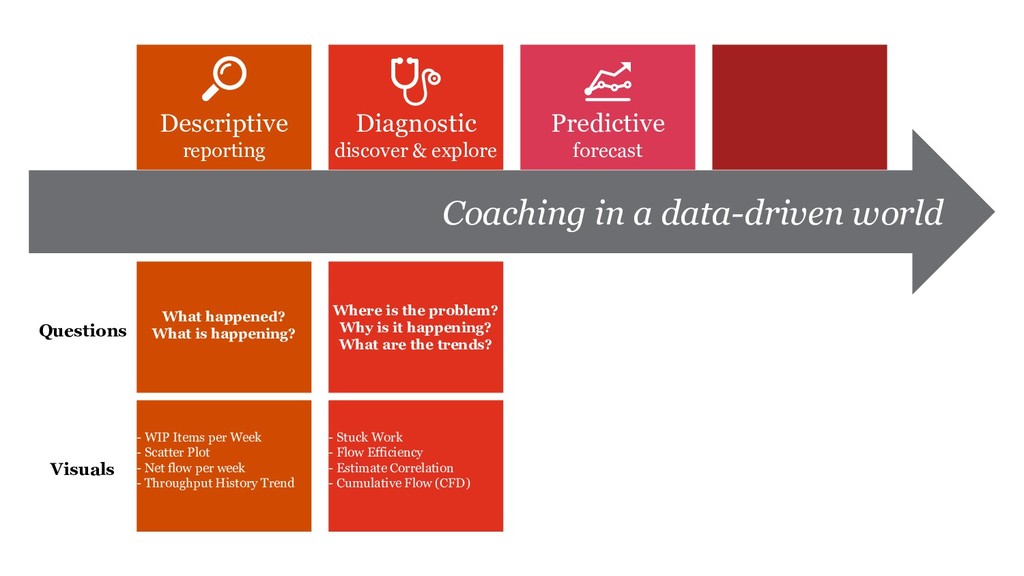
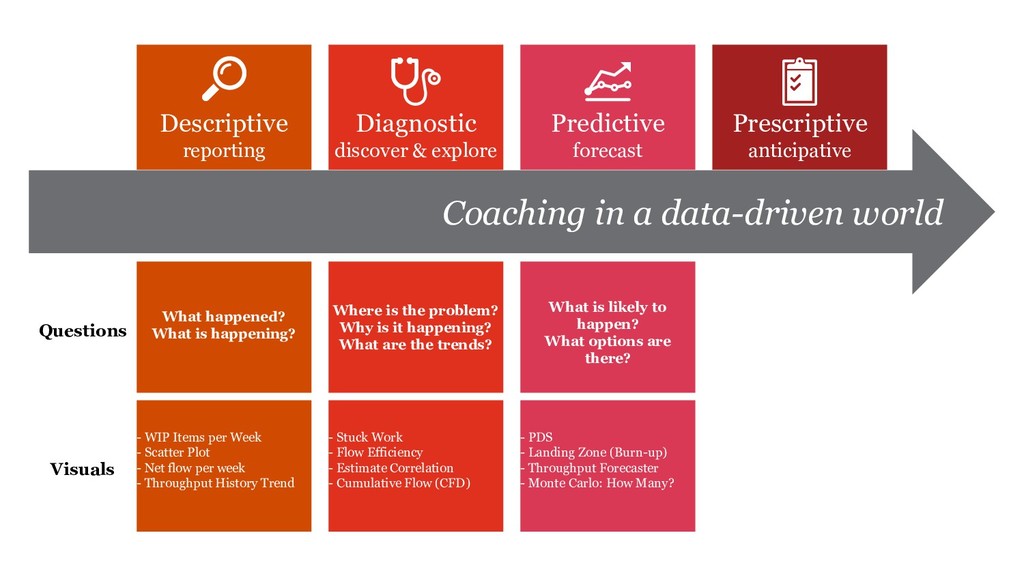
the problem? Why is it happening? What are the trends? What happened? What is happening? Visuals Diagnostic discover & explore Predictive forecast - WIP Items per Week - Scatter Plot - Net flow per week - Throughput History Trend - Stuck Work - Flow Efficiency - Estimate Correlation - Cumulative Flow (CFD)
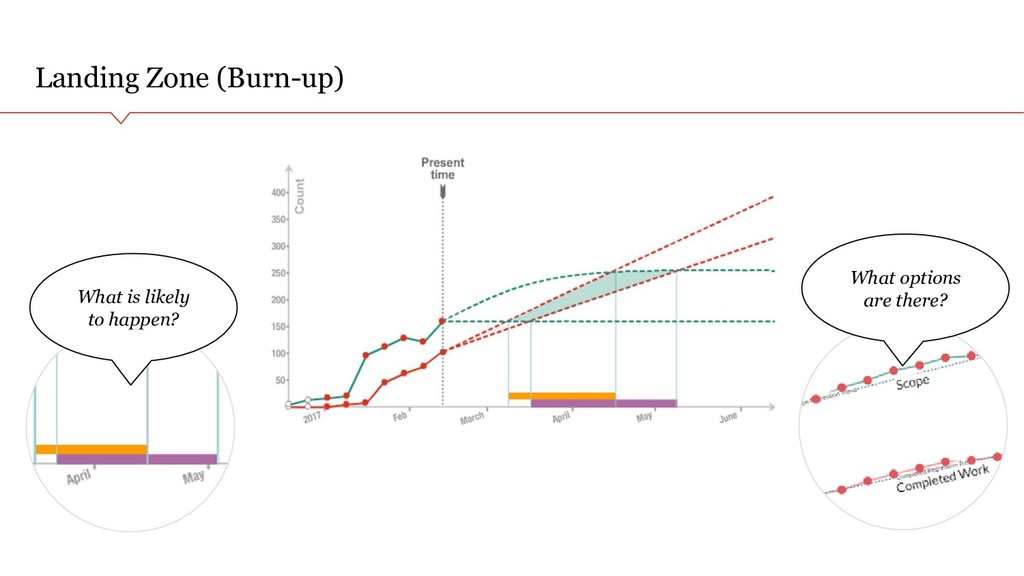
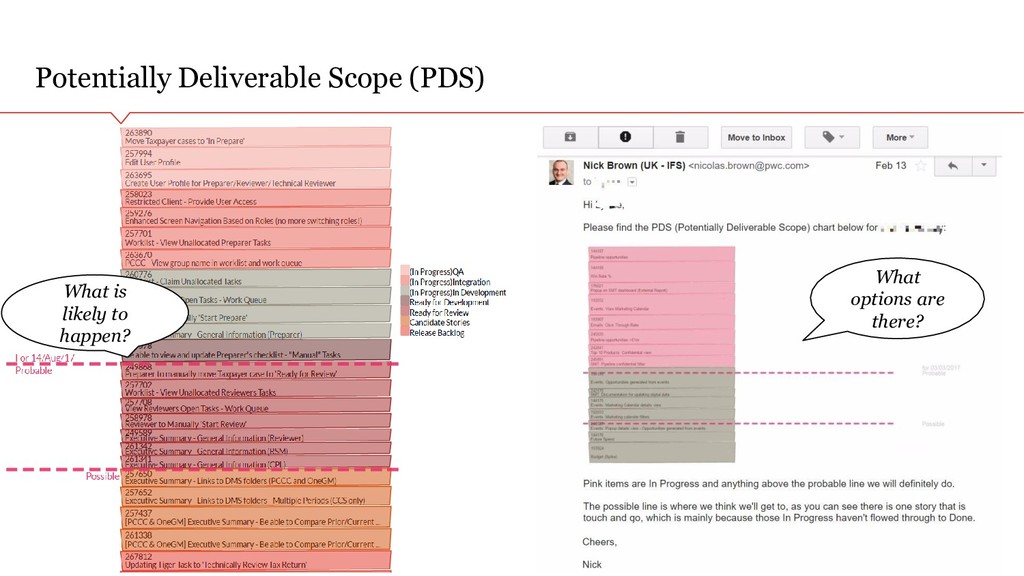
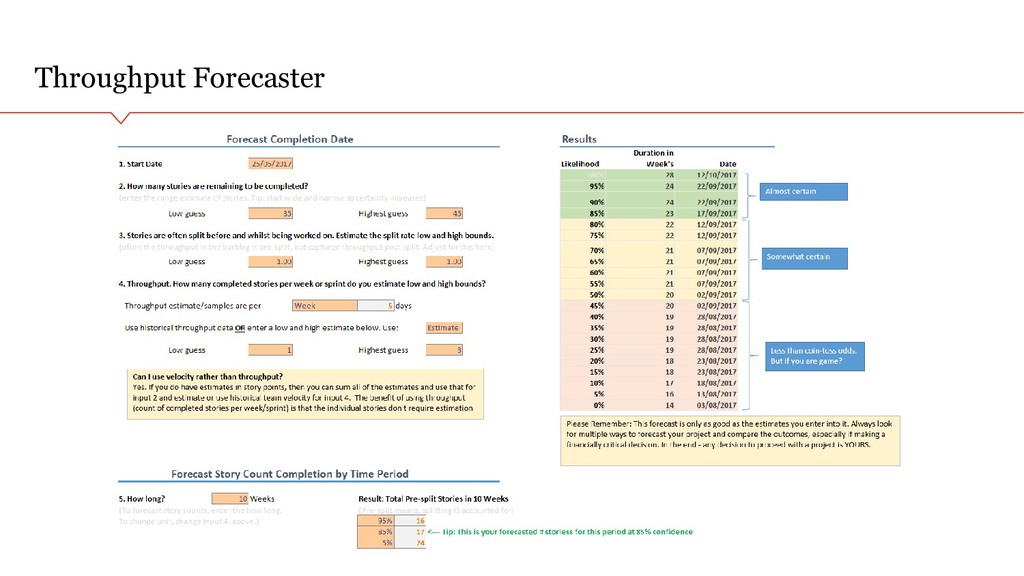
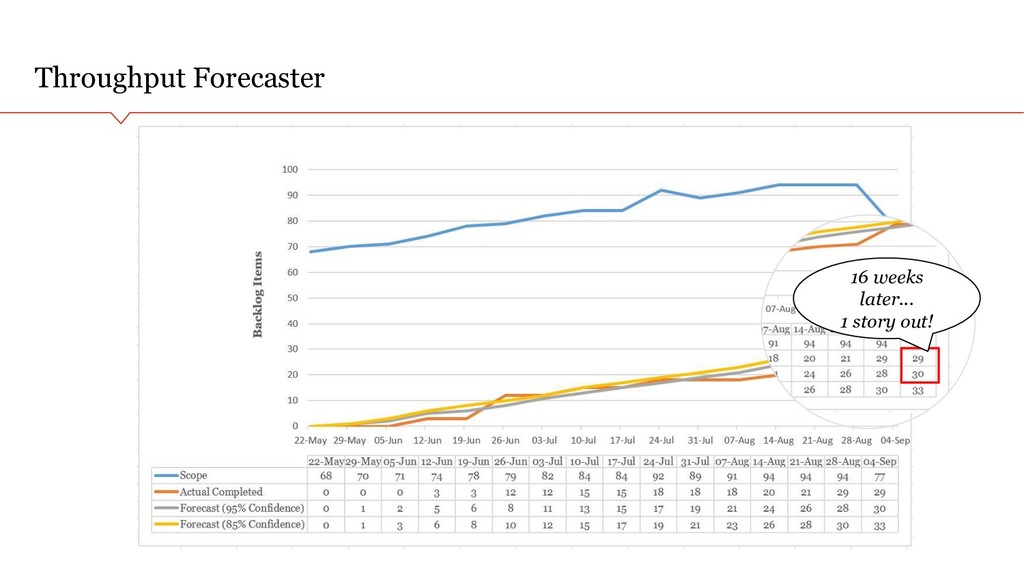
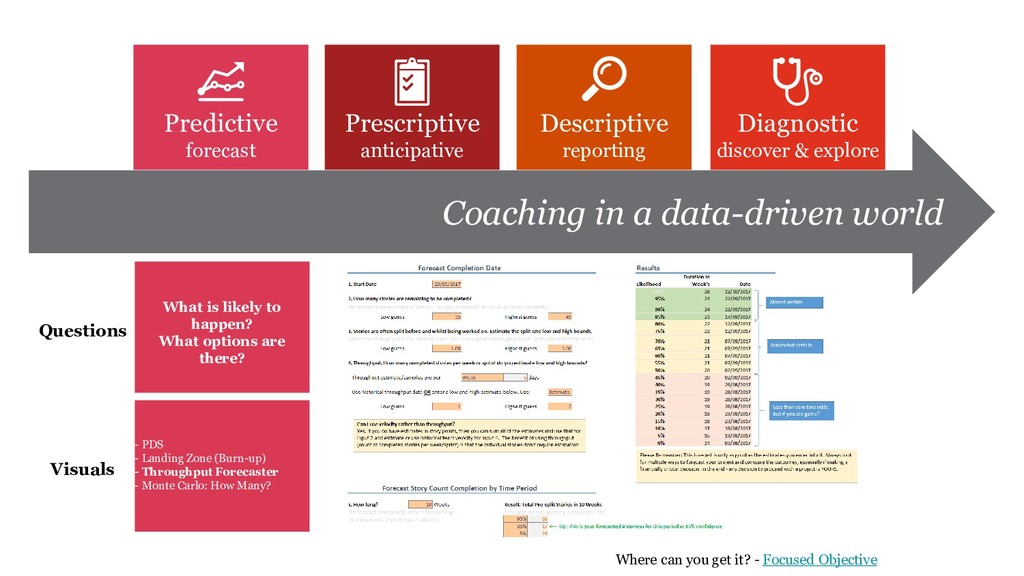
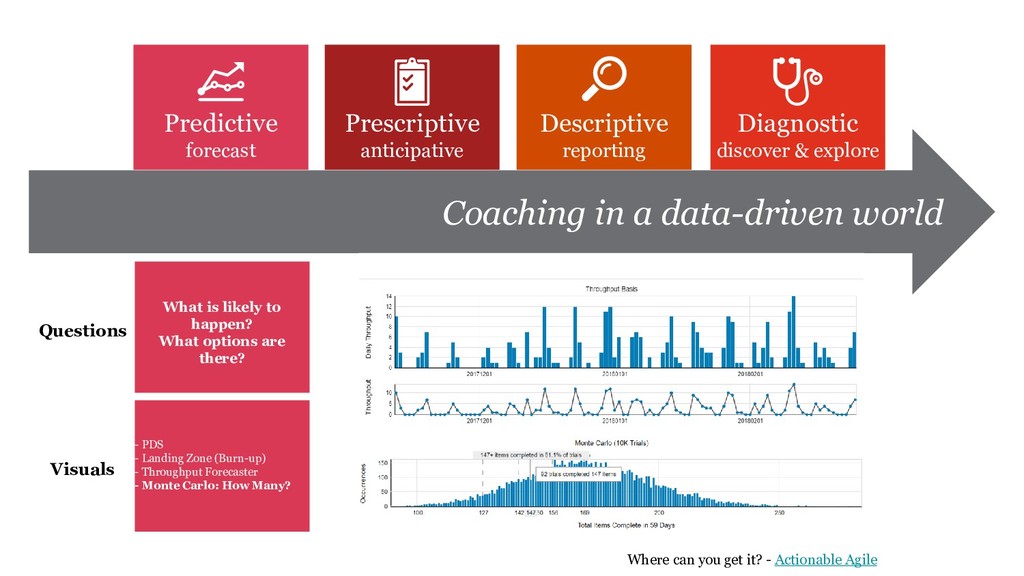
the problem? Why is it happening? What are the trends? What happened? What is happening? Visuals Diagnostic discover & explore Predictive forecast Prescriptive anticipative What is likely to happen? What options are there? - WIP Items per Week - Scatter Plot - Net flow per week - Throughput History Trend - Stuck Work - Flow Efficiency - Estimate Correlation - Cumulative Flow (CFD) - PDS - Landing Zone (Burn-up) - Throughput Forecaster - Monte Carlo: How Many?
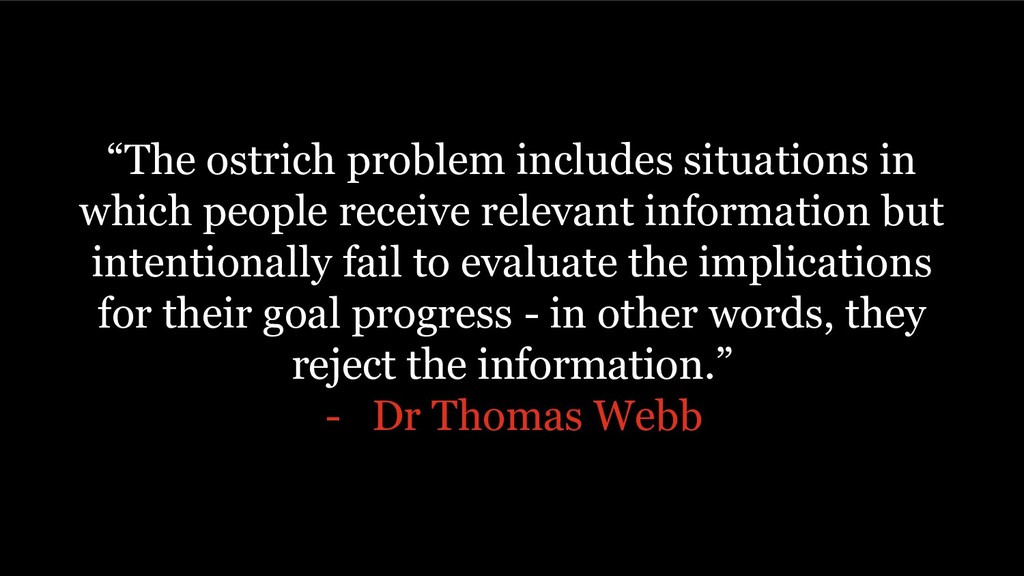
information but intentionally fail to evaluate the implications for their goal progress - in other words, they reject the information.” - Dr Thomas Webb
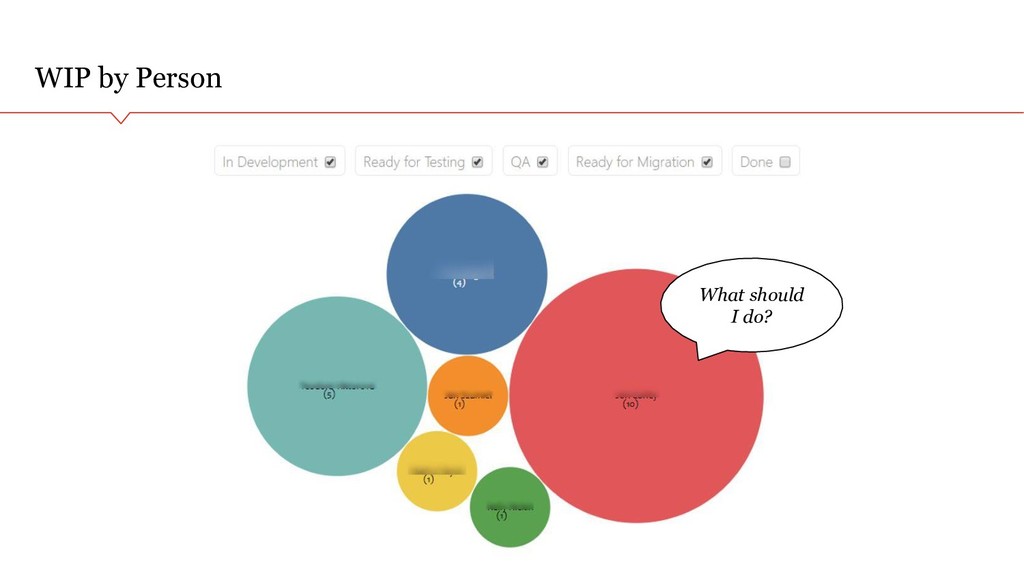
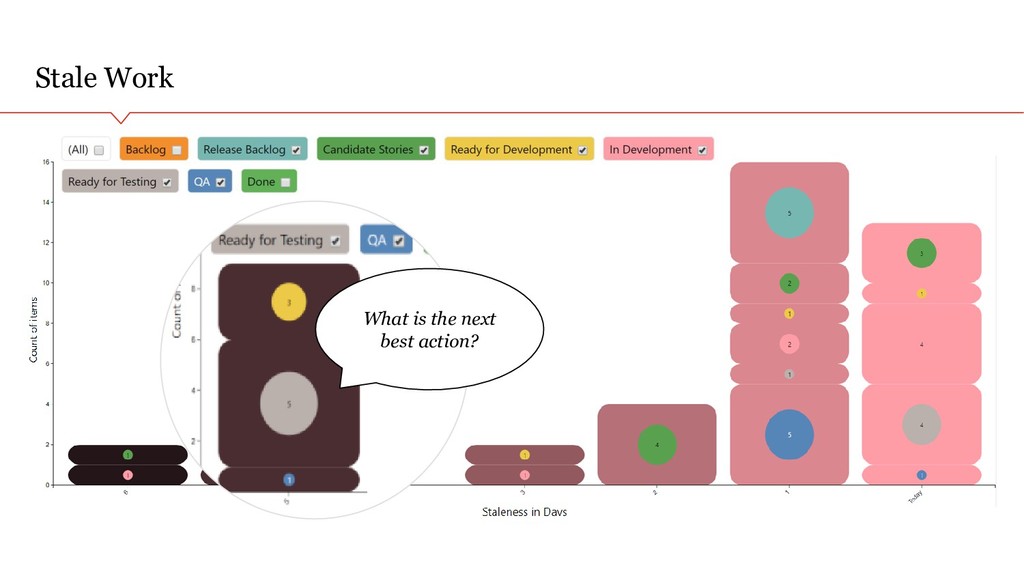
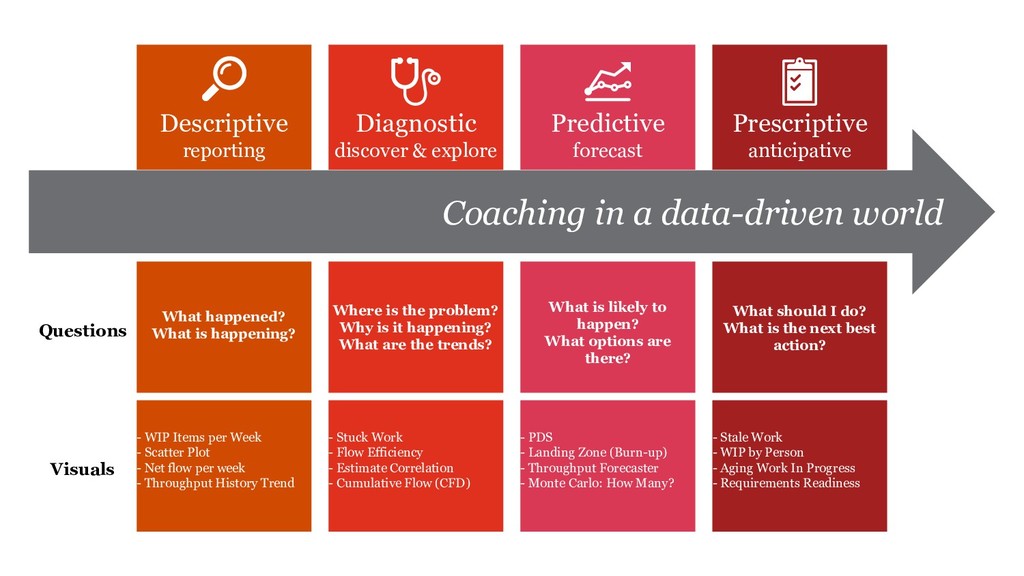
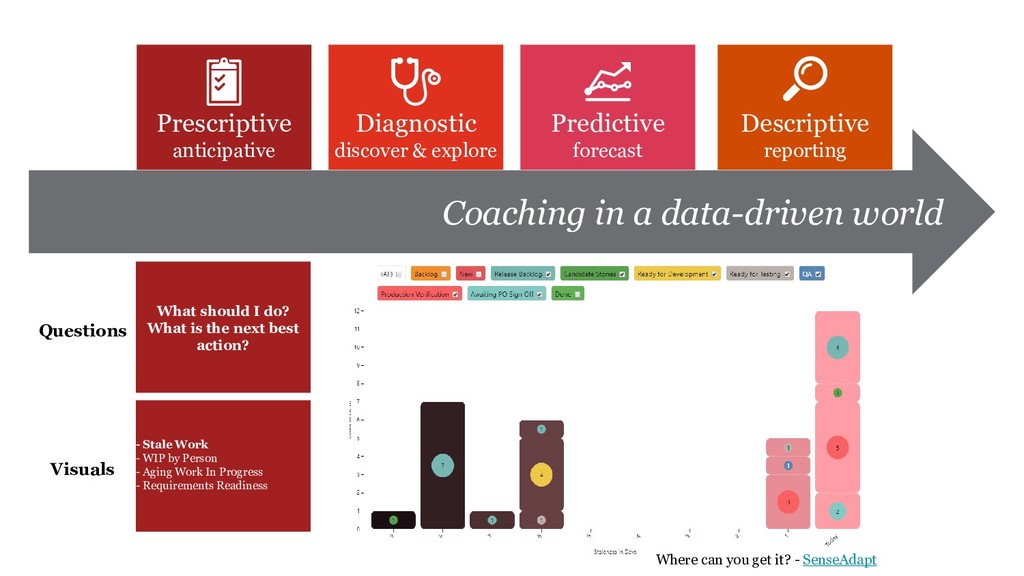
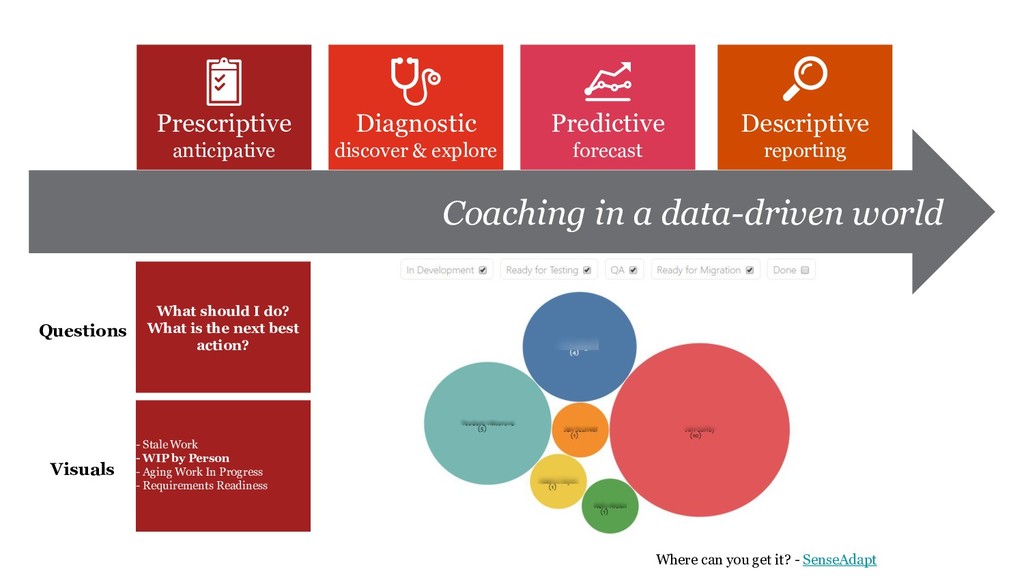
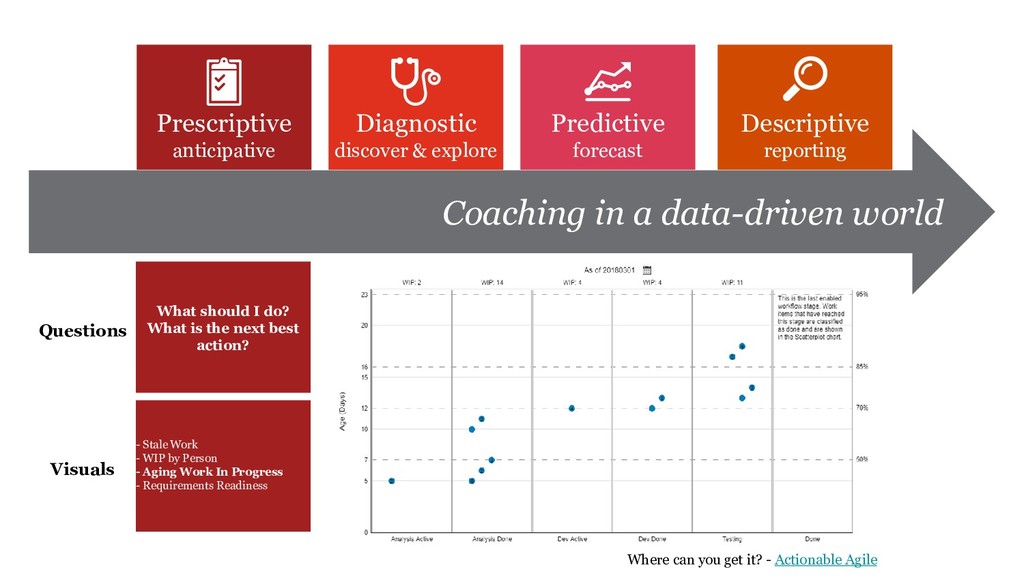
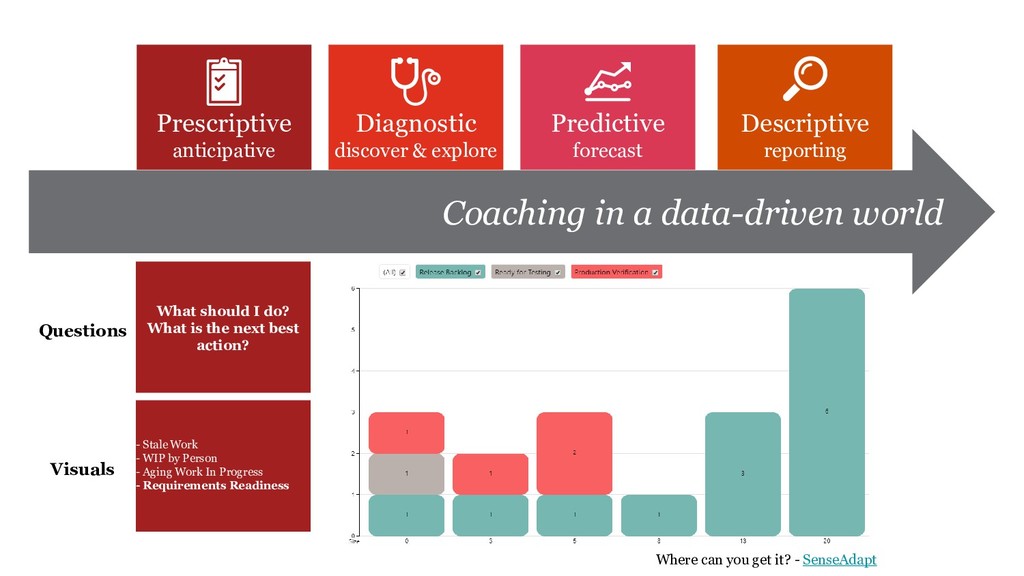
the problem? Why is it happening? What are the trends? What happened? What is happening? Visuals What should I do? What is the next best action? Diagnostic discover & explore Predictive forecast Prescriptive anticipative - WIP Items per Week - Scatter Plot - Net flow per week - Throughput History Trend - Stuck Work - Flow Efficiency - Estimate Correlation - Cumulative Flow (CFD) - Stale Work - WIP by Person - Aging Work In Progress - Requirements Readiness - PDS - Landing Zone (Burn-up) - Throughput Forecaster - Monte Carlo: How Many? What is likely to happen? What options are there?
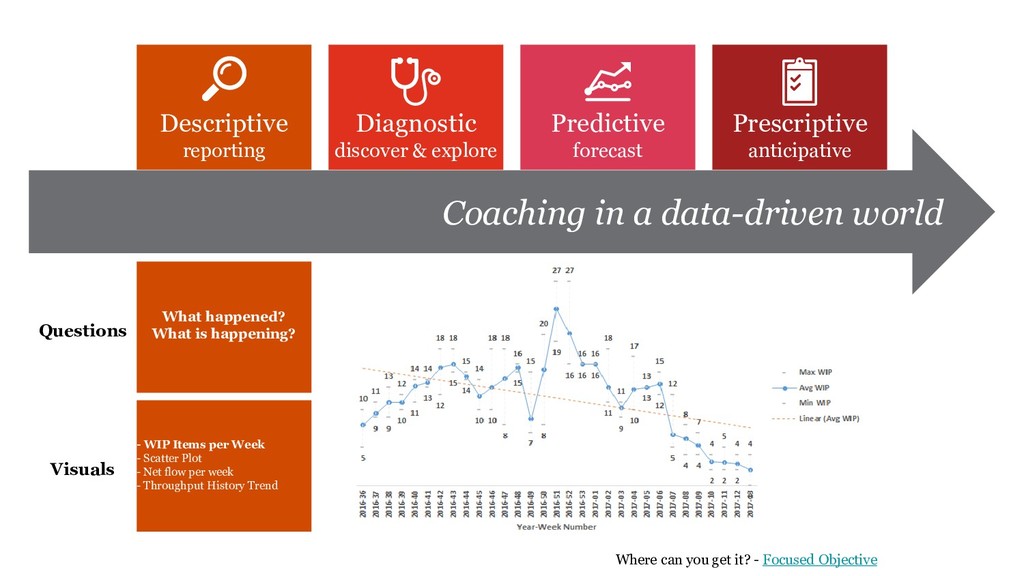
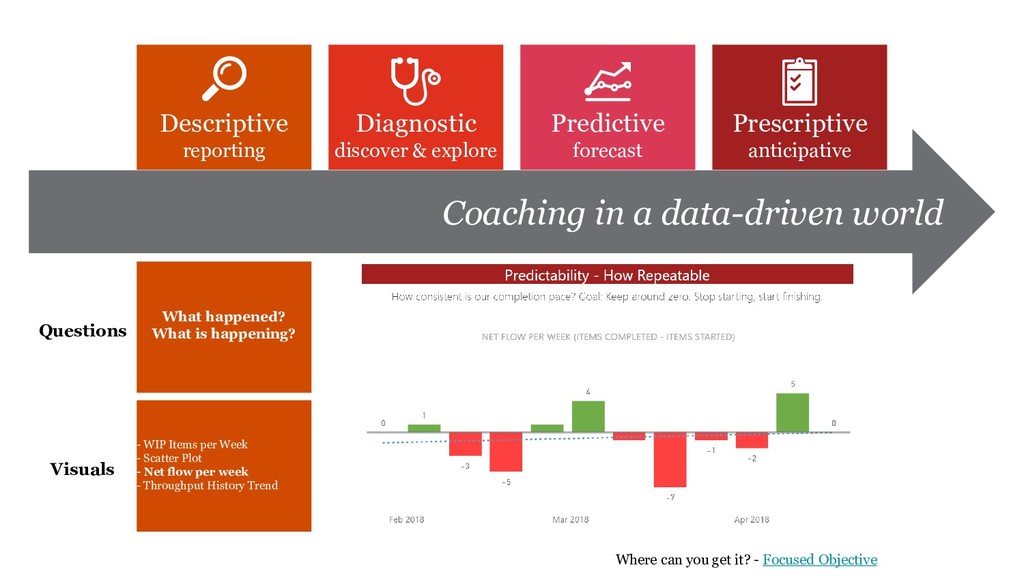
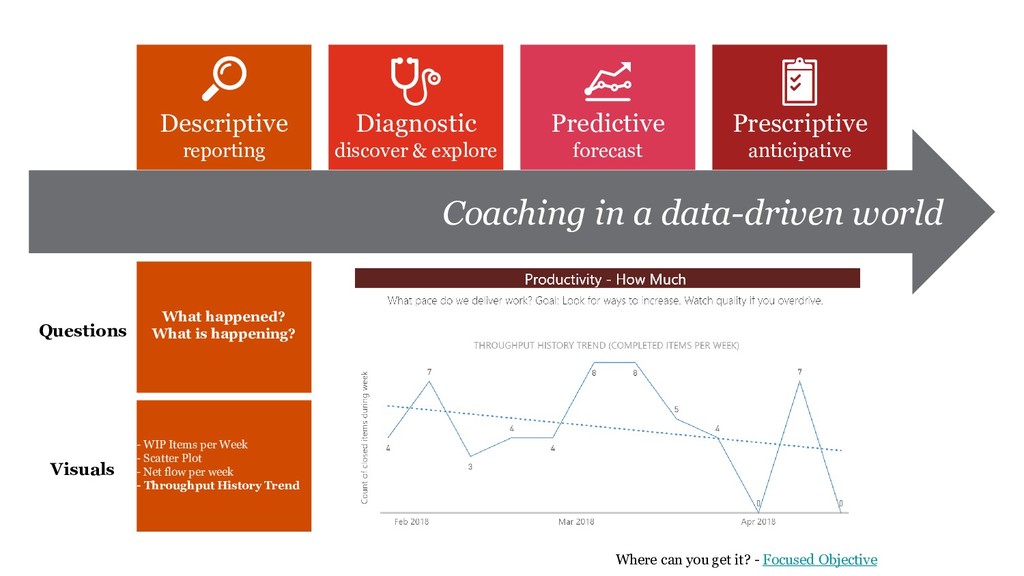
What is happening? Visuals Diagnostic discover & explore Predictive forecast Prescriptive anticipative - WIP Items per Week - Scatter Plot - Net flow per week - Throughput History Trend Where can you get it? - Focused Objective
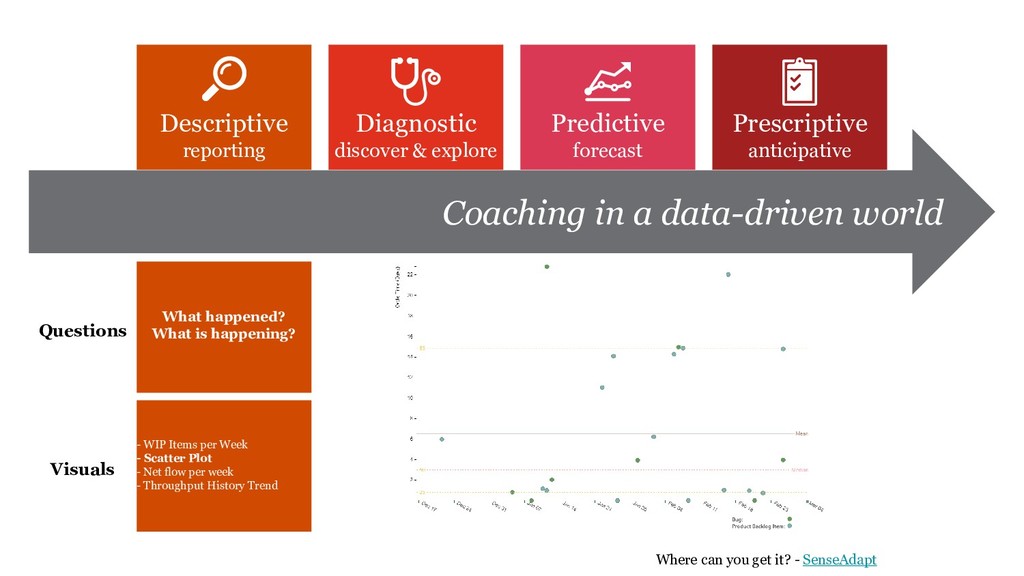
What is happening? Visuals Diagnostic discover & explore Predictive forecast Prescriptive anticipative - WIP Items per Week - Scatter Plot - Net flow per week - Throughput History Trend Where can you get it? - SenseAdapt
What is happening? Visuals Diagnostic discover & explore Predictive forecast Prescriptive anticipative - WIP Items per Week - Scatter Plot - Net flow per week - Throughput History Trend Where can you get it? - Focused Objective
What is happening? Visuals Diagnostic discover & explore Predictive forecast Prescriptive anticipative - WIP Items per Week - Scatter Plot - Net flow per week - Throughput History Trend Where can you get it? - Focused Objective
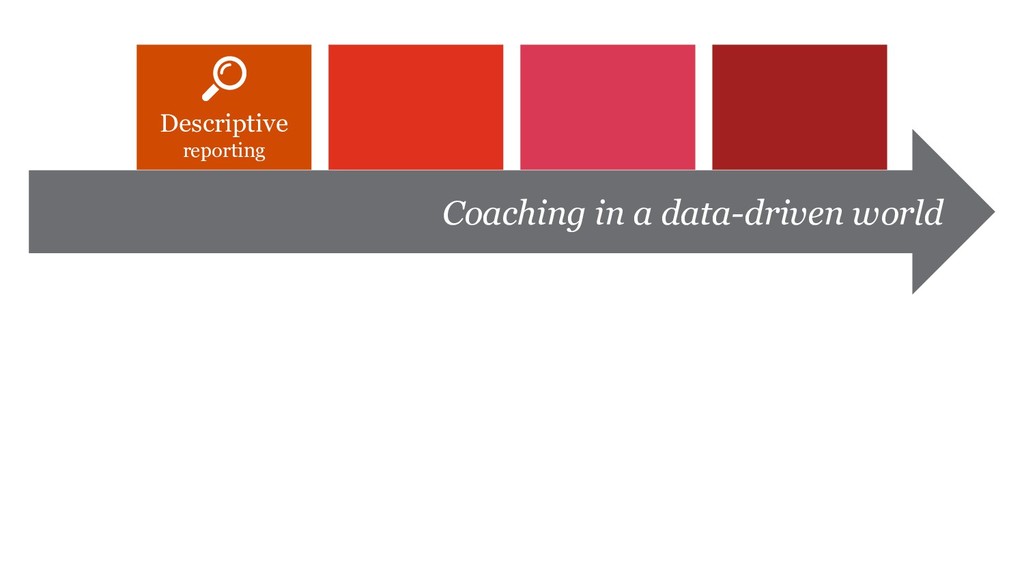
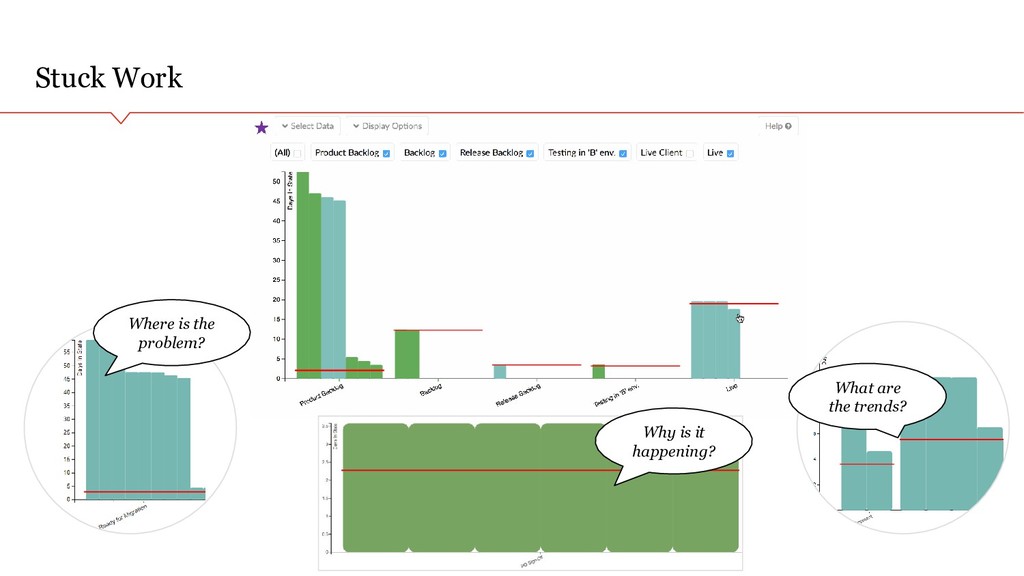
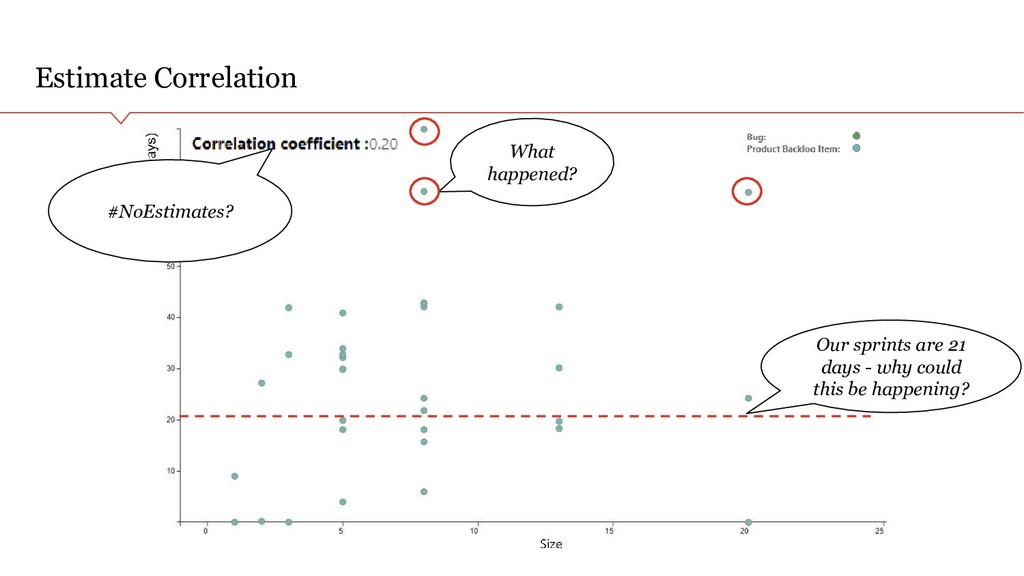
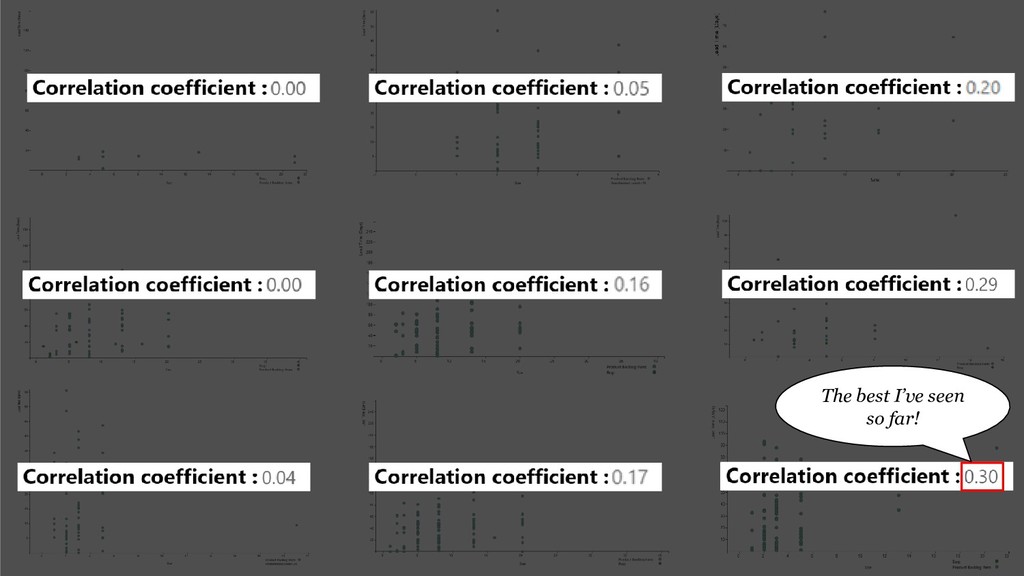
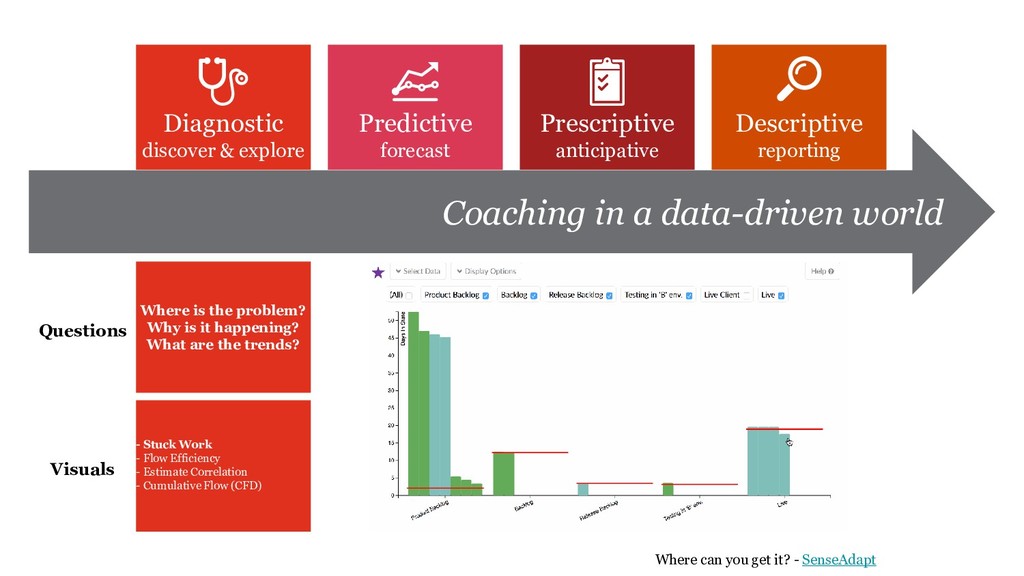
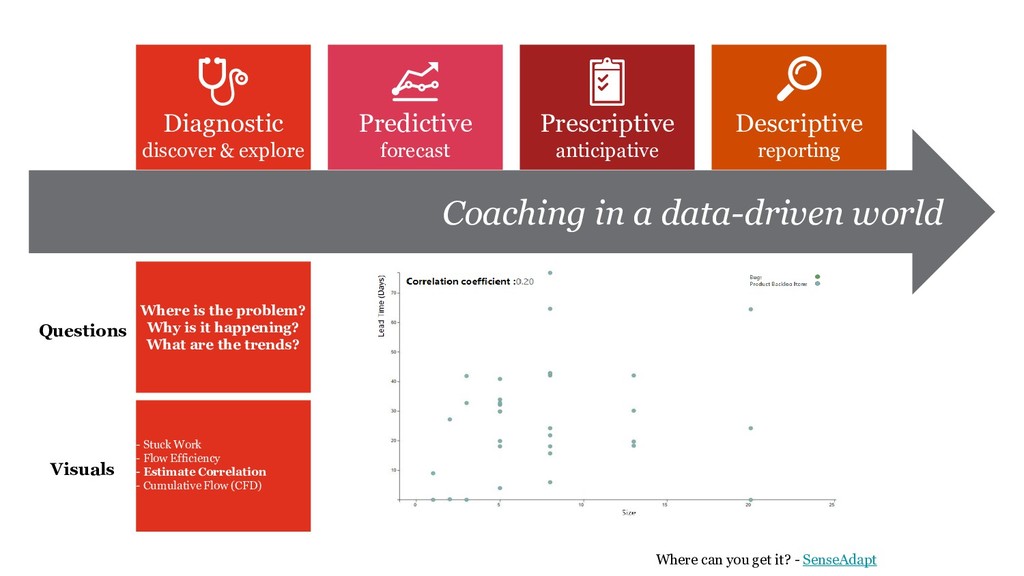
Why is it happening? What are the trends? Visuals Diagnostic discover & explore Predictive forecast Prescriptive anticipative - Stuck Work - Flow Efficiency - Estimate Correlation - Cumulative Flow (CFD) Descriptive reporting Where can you get it? - SenseAdapt
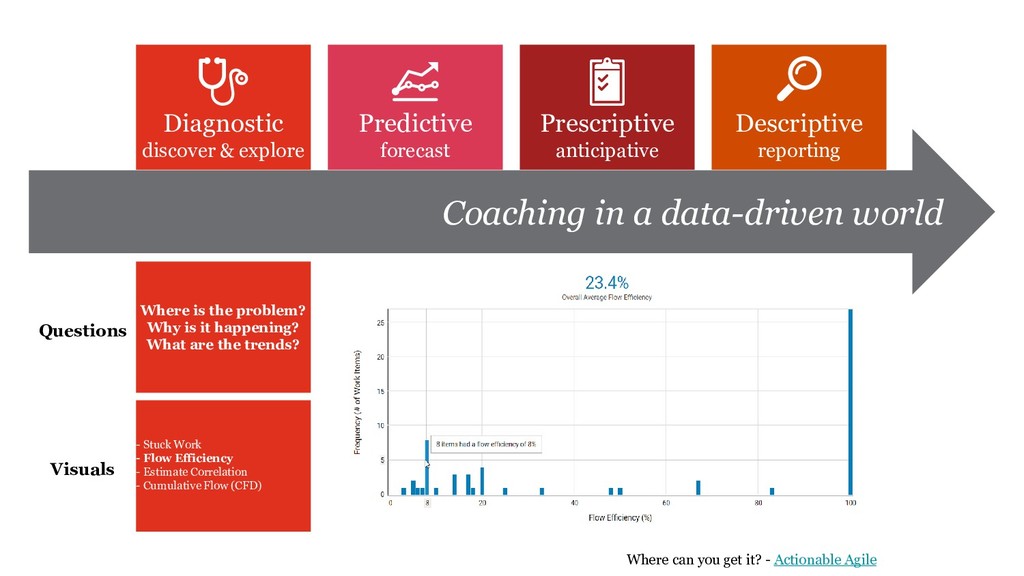
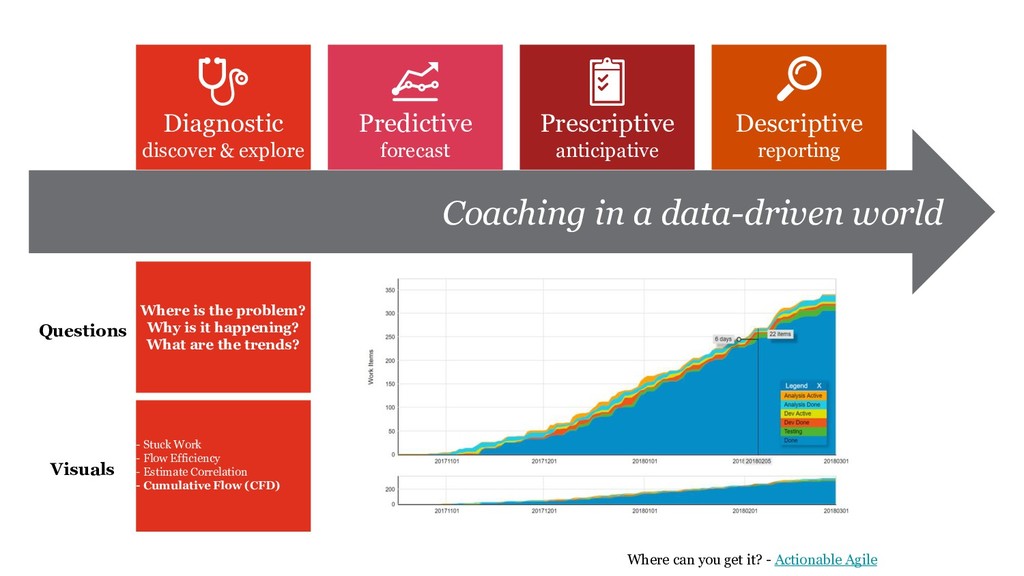
Why is it happening? What are the trends? Visuals Diagnostic discover & explore Predictive forecast Prescriptive anticipative - Stuck Work - Flow Efficiency - Estimate Correlation - Cumulative Flow (CFD) Descriptive reporting Where can you get it? - Actionable Agile
Why is it happening? What are the trends? Visuals Diagnostic discover & explore Predictive forecast Prescriptive anticipative - Stuck Work - Flow Efficiency - Estimate Correlation - Cumulative Flow (CFD) Descriptive reporting Where can you get it? - SenseAdapt
Why is it happening? What are the trends? Visuals Diagnostic discover & explore Predictive forecast Prescriptive anticipative - Stuck Work - Flow Efficiency - Estimate Correlation - Cumulative Flow (CFD) Descriptive reporting Where can you get it? - Actionable Agile
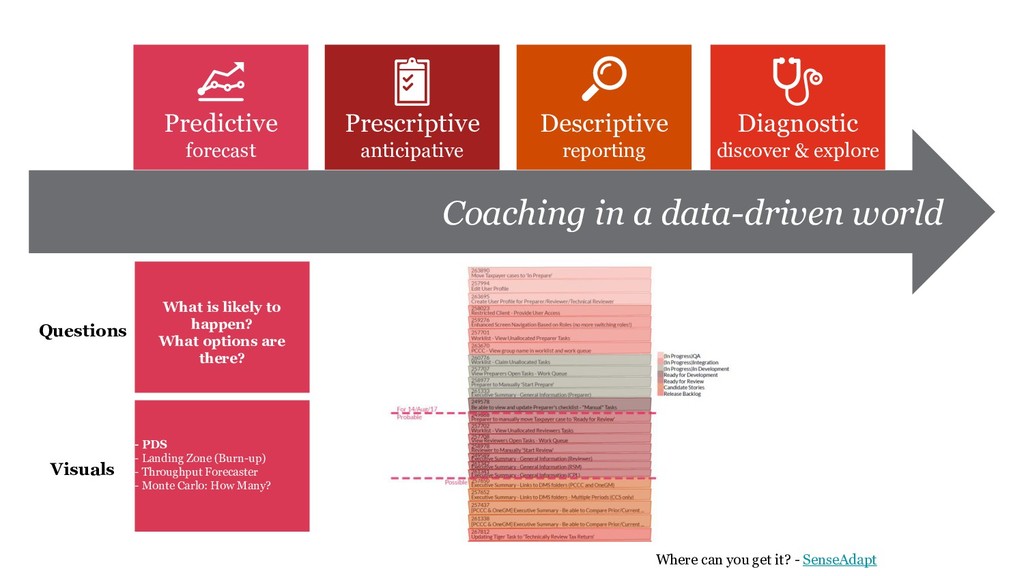
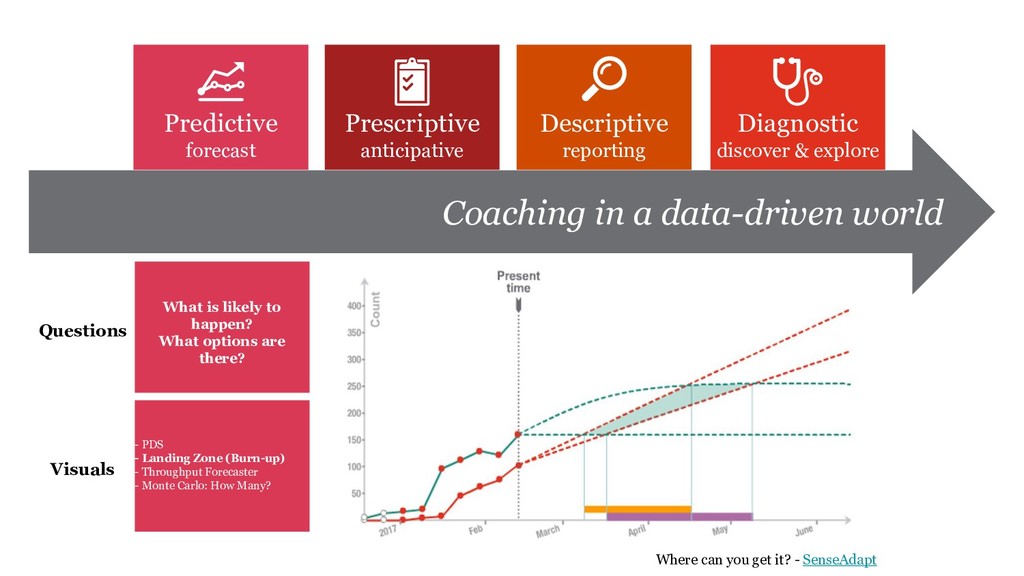
anticipative Descriptive reporting Diagnostic discover & explore - PDS - Landing Zone (Burn-up) - Throughput Forecaster - Monte Carlo: How Many? What is likely to happen? What options are there? Where can you get it? - SenseAdapt
anticipative Descriptive reporting Diagnostic discover & explore - PDS - Landing Zone (Burn-up) - Throughput Forecaster - Monte Carlo: How Many? What is likely to happen? What options are there? Where can you get it? - SenseAdapt
anticipative Descriptive reporting Diagnostic discover & explore - PDS - Landing Zone (Burn-up) - Throughput Forecaster - Monte Carlo: How Many? What is likely to happen? What options are there? Where can you get it? - Focused Objective
anticipative Descriptive reporting Diagnostic discover & explore - PDS - Landing Zone (Burn-up) - Throughput Forecaster - Monte Carlo: How Many? What is likely to happen? What options are there? Where can you get it? - Actionable Agile
discover & explore Predictive forecast Prescriptive anticipative What should I do? What is the next best action? - Stale Work - WIP by Person - Aging Work In Progress - Requirements Readiness Where can you get it? - SenseAdapt
discover & explore Predictive forecast Prescriptive anticipative What should I do? What is the next best action? - Stale Work - WIP by Person - Aging Work In Progress - Requirements Readiness Where can you get it? - SenseAdapt
discover & explore Predictive forecast Prescriptive anticipative What should I do? What is the next best action? - Stale Work - WIP by Person - Aging Work In Progress - Requirements Readiness Where can you get it? - Actionable Agile
discover & explore Predictive forecast Prescriptive anticipative What should I do? What is the next best action? - Stale Work - WIP by Person - Aging Work In Progress - Requirements Readiness Where can you get it? - SenseAdapt
the problem? Why is it happening? What are the trends? What happened? What is happening? Visuals What should I do? What is the next best action? Diagnostic discover & explore Predictive forecast Prescriptive anticipative - WIP Items per Week - Scatter Plot - Net flow per week - Throughput History Trend - Stuck Work - Flow Efficiency - Estimate Correlation - Cumulative Flow (CFD) - Stale Work - WIP by Person - Aging Work In Progress - Requirements Readiness - PDS - Landing Zone (Burn-up) - Throughput Forecaster - Monte Carlo: How Many? What is likely to happen? What options are there?
• Dan Vacanti - Actionable Agile Metrics for Predictability - tiny.cc/danvac • Dominica Degrandis - Making Work Visible - tiny.cc/workvisible • Bazil Arden - Try data-based coaching to counteract cognitive biases - tiny.cc/bazil1 • Bazil Arden - How data-based coaching enhances psychological safety - tiny.cc/bazil2 • Jerry Z. Muller - The Tyranny of Metrics - tiny.cc/tyranny • Goodhart, Charles (1981). "Problems of Monetary Management: The U.K. Experience" • Webb, T., Chang, B. and Benn, Y. (2013). ‘The Ostrich Problem’: Motivated Avoidance or Rejection of Information About Goal Progress.
PwC network and/or one or more of its member firms, each of which is a separate legal entity. Please see www.pwc.com/structure for further details. Nicolas Brown, Agile Lead [email protected] @nbrown02 Thank you! Any questions?