of diversity in the Wakatobi Marine National Park, Indonesia. L. Michie¹*, S. Cragg¹, R.S.K. Barnes², S. Armbruster ¹ ¹ Institute of Marine Sciences, University of Portsmouth, Ferry Road, PO4 9LY ²Biodiversity Program, Queensland Museum, Brisbane, Australia *[email protected]
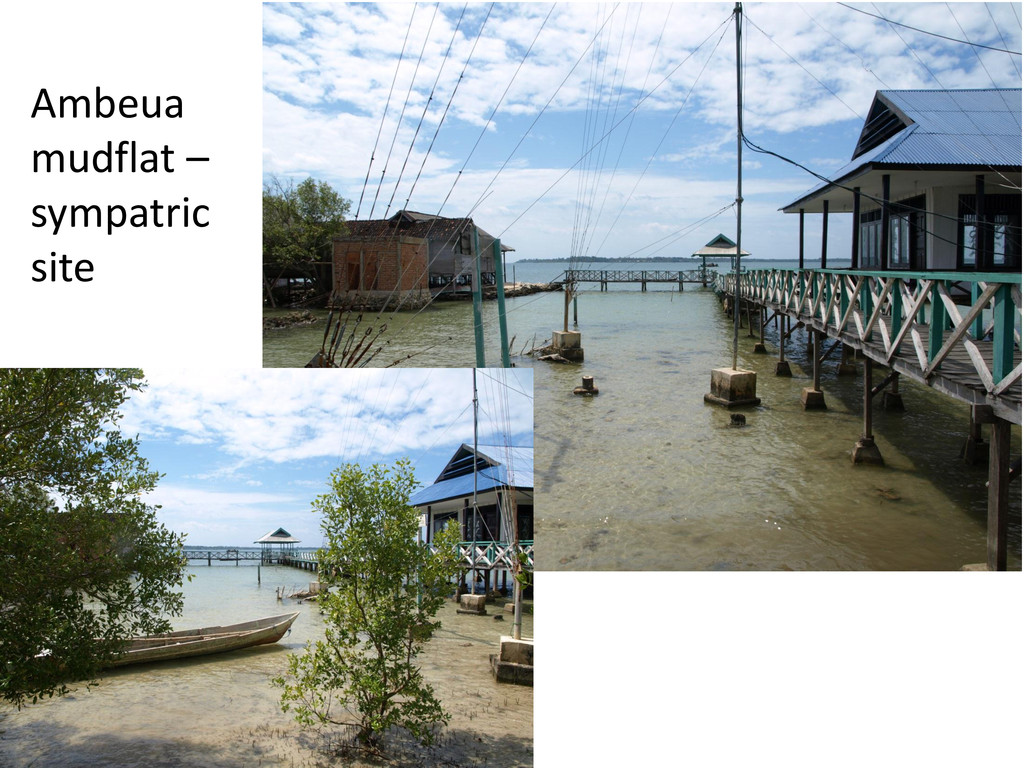
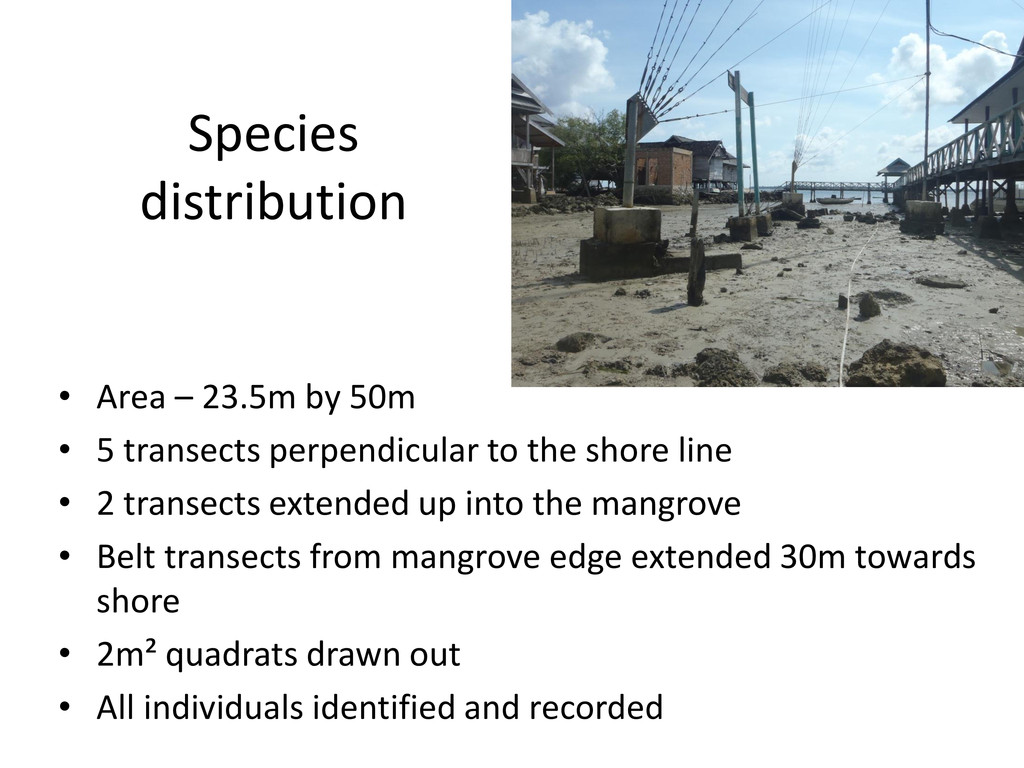
transects perpendicular to the shore line • 2 transects extended up into the mangrove • Belt transects from mangrove edge extended 30m towards shore • 2m² quadrats drawn out • All individuals identified and recorded
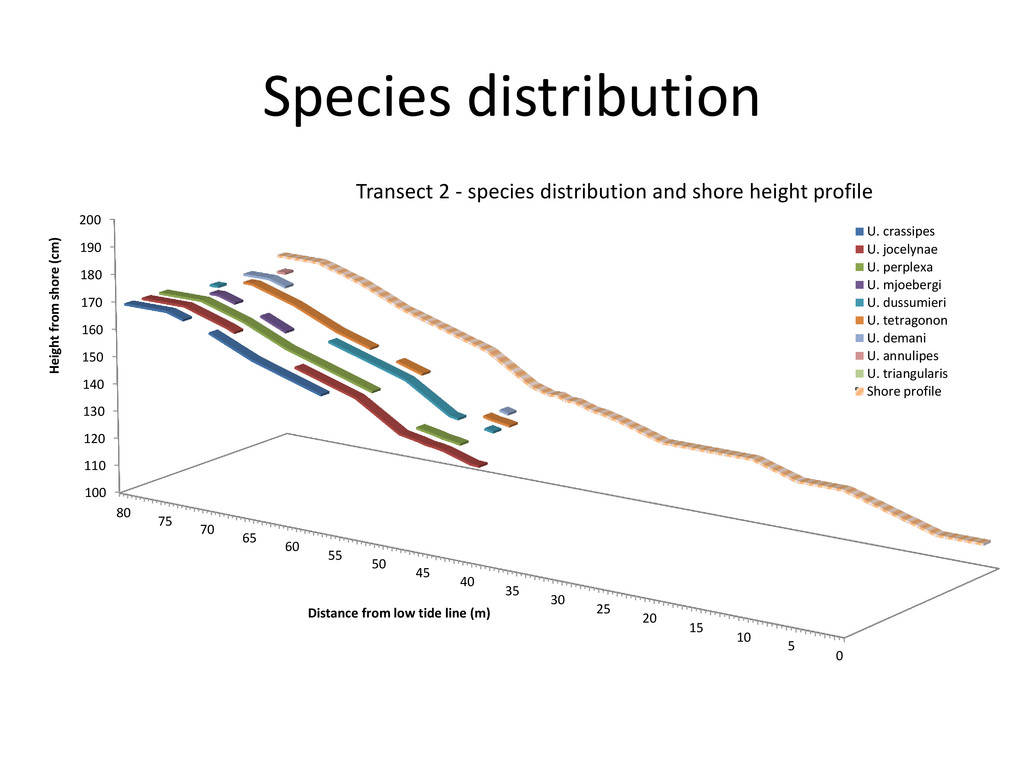
180 190 200 80 75 70 65 60 55 50 45 40 35 30 25 20 15 10 5 0 Height from shore (cm) Distance from low tide line (m) Transect 2 - species distribution and shore height profile U. crassipes U. jocelynae U. perplexa U. mjoebergi U. dussumieri U. tetragonon U. demani U. annulipes U. triangularis Shore profile
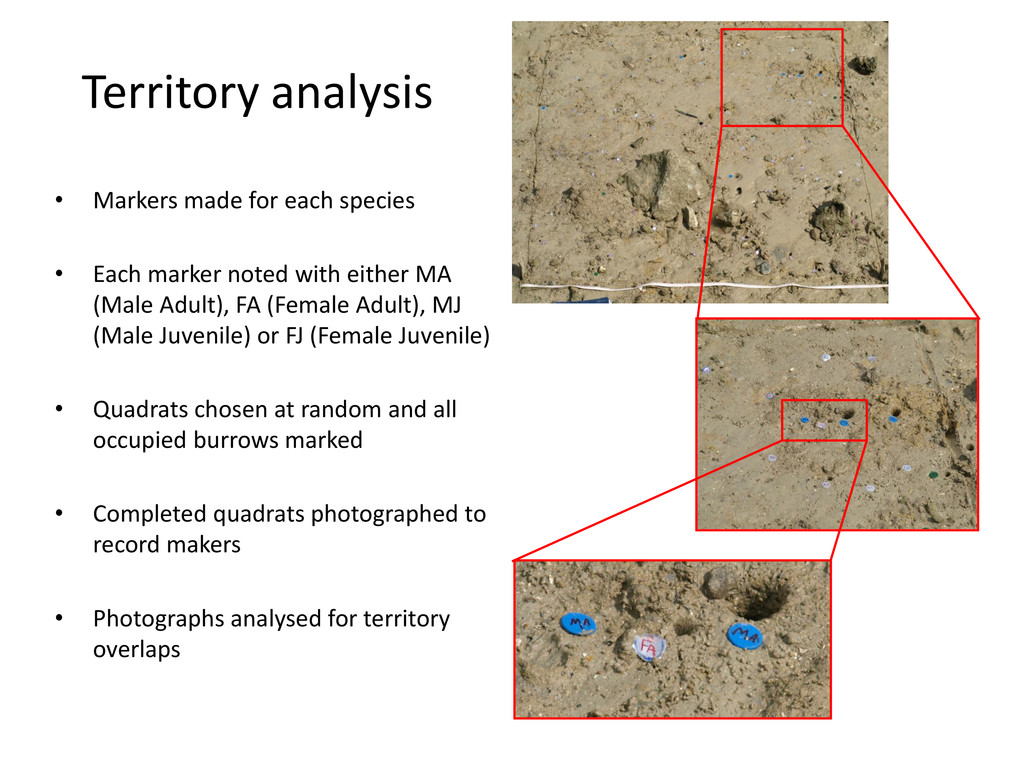
marker noted with either MA (Male Adult), FA (Female Adult), MJ (Male Juvenile) or FJ (Female Juvenile) • Quadrats chosen at random and all occupied burrows marked • Completed quadrats photographed to record makers • Photographs analysed for territory overlaps
T4 • Top 5mm sampled • ~10g of each sample measured and wet sieved (1mm, 500µm, 250µm, 125µm and 63µm) • Sieved content transferred to filter papers • Filter paper dried in oven at 60°C for 48 hours
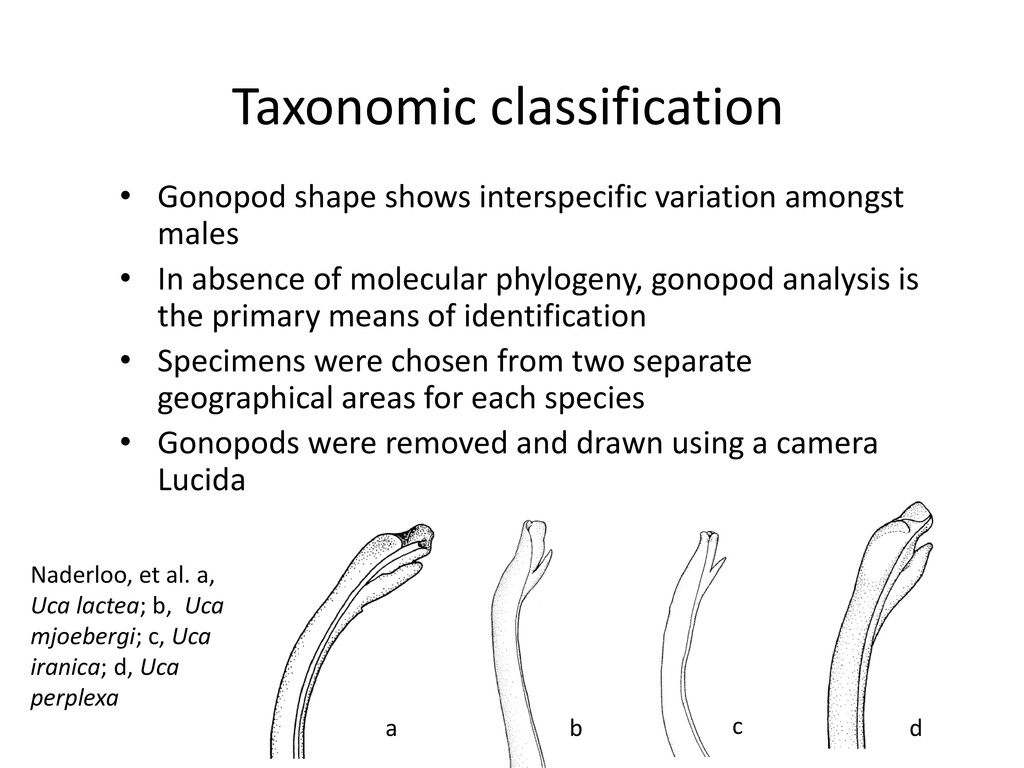
• In absence of molecular phylogeny, gonopod analysis is the primary means of identification • Specimens were chosen from two separate geographical areas for each species • Gonopods were removed and drawn using a camera Lucida Naderloo, et al. a, Uca lactea; b, Uca mjoebergi; c, Uca iranica; d, Uca perplexa a b c d